


Summary
In evolutionary biology, developmental bias refers to the production against or towards certain ontogenetic trajectories which ultimately influence the direction and outcome of evolutionary change by affecting the rates, magnitudes, directions and limits of trait evolution.[1][2] Historically, the term was synonymous with developmental constraint,[1][3][4] however, the latter has been more recently interpreted as referring solely to the negative role of development in evolution.[5]
The role of the embryo edit

In modern evolutionary biology, the idea of developmental bias is embedded into a current of thought called Structuralism, which emphasizes the role of the organism as a causal force of evolutionary change.[6][page needed] In the Structuralist view, phenotypic evolution is the result of the action of natural selection on previously ‘filtered’ variation during the course of ontogeny.[7][8] It contrasts with the Functionalist (also “adaptationist”, “pan-selectionist” or “externalist”) view in which phenotypic evolution results only from the interaction between the deterministic action of natural selection and variation caused by mutation.[3][7]
The rationale behind the role of the organism, or more specifically the embryo, as a causal force in evolution and for the existence of bias is as follows: The traditional, neo-Darwinian, approach to explain the process behind evolutionary change is natural selection acting upon heritable variation caused by genetic mutations.[9] However, natural selection acts on phenotypes and mutation does not in itself produce phenotypic variation, thus, there is a conceptual gap regarding the connection between a mutation and the potential change in phenotype.[6] For a mutation to readily alter a phenotype, and hence be visible to natural selection, it has to modify the ontogenetic trajectory, a process referred to as developmental reprogramming.[10] Some kinds of reprogramming are more likely to occur than others given the nature of the genotype–phenotype map, which determines the propensity of a system to vary in a particular direction,[8][11] thus, creating a bias. In other words, the underlying architecture of the developmental systems influences the kinds of possible phenotypic outcomes.
However, developmental bias can evolve through natural selection, and both processes simultaneously influence phenotypic evolution. For example, developmental bias can affect the rate or path to an adaptive peak (high-fitness phenotype),[5] and conversely, strong directional selection can modify the developmental bias to increase the phenotypic variation in the direction of selection.[12]

Types of bias edit
Developmental constraints edit
Developmental constraints are limitations on phenotypic variability (or absence of variation) caused by the inherent structure and dynamics of the developmental system.[1] Constraints are a bias against a certain ontogenetic trajectory, and consequently are thought to limit adaptive evolution.[12][13]
Developmental drive edit
Developmental drive is the inherent natural tendency of organisms and their ontogenetic trajectories to change in a particular direction (i.e. a bias towards a certain ontogenetic trajectory).[14][5][6] This type of bias is thought to facilitate adaptive evolution by aligning phenotypic variability with the direction of selection.[15][12]
Distribution of phenotypic variation edit
Morphospace edit

The morphospace is a quantitative representation of phenotypes in a multidimensional space, where each dimension corresponds to a trait. The phenotype of each organism or species is then represented as a point in that space that summarizes the combination of values or states at each particular trait.[16] This approach is used to study the evolution of realized phenotypes compared to those that are theoretically possible but inexistent.[16][17]
Nonrandom (anisotropic) distribution of phenotypic variation edit
Describing and understanding the drivers of the distribution of phenotypic variation in nature is one of the main goals in evolutionary biology.[2] One way to study the distribution of phenotypic variation is through depicting the volume of the morphospace occupied by a set of organisms or species. Theoretically, there can exist a natural process that generates an almost-evenly (quasi stochastic) distributed pattern of phenotypes in the morphospace, regarding that new species necessary tend to occupy a point in the morphospace that is close to those of its phylogenetic relatives.[18] However, it is now widely acknowledged that organisms are not evenly distributed along the morphospace, i.e. isotropic variation, but instead are nonrandomly distributed, i.e. anisotropic variation.[17][19] In other words, there exists a discordance between the apparent (or theoretical) possible phenotypes and their actual accessibility.[17]

Thus, some phenotypes are inaccessible (or impossible) due to the underlying architecture of the developmental trajectory, while others are accessible (or possible).[20] However, of the possible phenotypes, some are ‘easier’ or more probable to occur than others.[8][19] For example, a phenotype such as the classical figure of a dragon (i.e. a giant reptile-like creature with two pairs of limbs and an anterior pair of wings) may be impossible because in vertebrates the fore-limbs and the anterior pair of wings are homologous characters (e.g. birds and bats), and, thus, are mutually exclusive. On the other hand, if two phenotypes are possible (and equally fit), but one form of reprogramming requires only one mutation while the other requires two or more, the former will be more likely to occur (assuming that genetic mutations occur randomly).[8]
An important distinction between structuralism and functionalism regards primarily with the interpretation of the causes of the empty regions in the morphospace (that is, the inexistent phenotypes): Under the functionalist view, empty spaces correspond to phenotypes that are both ontogenetically possible and equally probable but are eliminated by natural selection due to their low fitness.[20] In contrast, under the structuralist view, empty spaces correspond to ontogenetically impossible or improbable phenotypes,[3][20] thus, implying a bias in the types of phenotypes that can be produced assuming equal amounts of variation (genetic mutations) in both models.[6][8]
Classical examples of anisotropic variation edit

In a classical natural example of bias it was shown that only a small proportion of all possible snail shell shapes was realized in nature and actual species were confined to discrete regions of the shell-morphospace rather than being continuously distributed.[21] In another natural example, it was shown that soil-dwelling centipedes have an enormous variation in the number of pairs of legs, the lowest being 27 and the highest 191 pairs; however, there are no species with an even number of leg pairs, which suggests that either these phenotypes are somehow restricted during development or that there is a developmental drive into odd numbers.[22]

A study of the polydactyl toe counts of 375 Hemingway mutants of the Maine Coon cat showed that the number of additional toes was variable (plastic) and contained a bias. The Maine Coon cat (as the basic model of the Hemingway mutants) has 18 toes in the wild. Polydactyly occurred in some cases with an unchanged number of toes (18 toes), whereby the deviation consisted of a three-jointed thumb due to the extension of the first toe. However, 20 toes were found much more frequently and then 22, 24 or 26 toes with decreasing frequency. Odd total numbers of toes on the feet were less common. There is another bias between the number of toes on the front and rear feet, and a left-right asymmetry in the number of toes. Random bistability during the development process could explain the observed bias.[23]
Conversely, developmental abnormalities (or teratologies) have been used to understand the logic behind the mechanisms that produce variation.[24] For example, in a wide range of animals, from fish to humans, two-headed organisms are much more common than three-headed organisms; similarly, Siamese twins theoretically could ‘fuse’ through any region in the body but the fusion occurs more frequently in the abdominal region.[7][24] This trend was referred to as transpecific parallelism, suggesting the existence of profound historical rules governing the expression of abnormal forms in distantly related species.[7]
Biased phenotypes I: Continuous variation edit
Developmental integration and the P-matrix edit
Integration or covariation among traits during development has been suggested to constrain phenotypic evolution to certain regions of the morphospace and limit adaptive evolution.[25] These allometric changes are widespread in nature and can account for a wide variety of realized morphologies and subsequent ecological and physiological changes.[26][27] Under this approach, phenotype is seen as an integrated system where each trait develops and evolves in concert with the other traits, and thus, a change in one trait affects the interacting parts in a correlated manner.[25][28] The correlation between traits is a consequence of the architecture of the genotype–phenotype map, particularly the pleiotropic effects of underlying genes.[11] This correlated change between traits can be measured and analyzed through a phenotypic variance-covariance matrix (P-matrix) which summarizes the dimensions of phenotypic variability and the main axis of variation.[25]
Quantitative genetics and the G-matrix edit
Quantitative genetics is a statistical framework mainly concerned with modeling the evolution of continuous characters.[9] Under this framework, correlation between traits could be the result of two processes: 1) natural selection acting simultaneously on several traits ensuring that they are inherited together (i.e. linkage disequilibrium),[29] or 2) natural selection acting on one trait causing correlated change in other traits due to pleiotropic effects of genes.[11] For a set of traits, the equation that describe the variance among traits is the multivariate breeder’s equation Δz = β x G, where Δz is the vector of differences in trait means, β is a vector of selection coefficients, and G is a matrix of the additive genetic variance and covariance between traits.[30][31] Thus, a population’s immediate ability to respond to selection is determined by the G-matrix, in which the variance is a function of standing genetic variation, and the covariance arises from pleiotropy and linkage disequilibrium.[31][32] Although the G-matrix is one of the most relevant parameters to study evolvability,[12] the mutational matrix (M-matrix), also known as the distribution of mutational effects, has been shown to be of equivalent importance.[32] The M-matrix describes the potential effects of new mutations on the existing genetic variances and covariances, and these effects will depend on the epistatic and pleiotropic interactions of the underlying genes.[12][32][33] In other words, the M-matrix determines the G-matrix, and thus, the response to selection of a population.[32] Similarly to the P-matrix, the G-matrix describes the main axis of variation.
Paths of least resistance edit

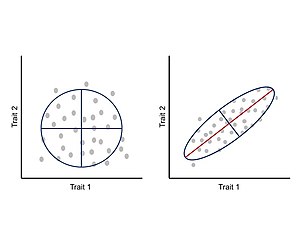
A general consequence of the P-matrices and G-matrices is that evolution will tend to follow the ‘path of least resistance’. In other words, if the main axis of variation is aligned with the direction of selection, covariation (genetic or phenotypic) will facilitate the rate of adaptive evolution; however, if the main axis of variation is orthogonal to the direction of selection, covariation will constraint the rate of adaptive evolution.[2][12][25] In general, for a population under the influence of a single fitness optimum, the rate of morphological divergence (from an ancestral to a new phenotype or between pairs of species) is inversely proportional to the angle formed by the main axis of variation and the direction of selection, causing a curved trajectory through the morphospace.[34]
From the P-matrix for a set of characters, two broadly important measures of the propensity of variation can be extracted: 1) Respondability: ability of a developmental system to change in any direction, and 2) Evolvability: ability of a developmental system to change in the direction of natural selection.[25] In the latter, the main axis of phenotypic variation is aligned with the direction of selection. Similarly, from the G-matrix, the most important parameter that describes the propensity of variation is the lead eigenvector of G (gmax), which describes the direction of greatest additive genetic variance for a set of continuous traits within populations.[32][34] For a population undergoing directional selection, gmax will bias the main direction of the trajectory.[34]
Biased phenotypes II: Properties of gene regulatory networks edit
Hierarchy and optimal pleiotropy edit

GRNs are modular, multilayered, and semi-hierarchically systems of genes and their products: each transcription factor provides multiple inputs to other genes, creating a complex array of interactions,[36] and information regarding the timing, place and amount of gene expression generally flows from few high-level control genes through multiple intermediate genes to peripheral gene batteries that ultimately determine the fate of each cell.[19][36] This type of architecture implies that high-level control genes tend to be more pleiotropic affecting multiple downstream genes, whereas intermediate and peripheral genes tend to have moderate to low pleiotropic effects, respectively.[19][36]
In general, it is expected that newly arisen mutations with higher dominance and fewer pleiotropic and epistatic effects are more likely to be targets of evolution,[37] thus, the hierarchical architecture of developmental pathways may bias the genetic basis of evolutionary change. For instance, genes within GRNs with "optimally pleiotropic" effects, that is, genes that have the most widespread effect on the trait under selection but few effects on other traits, are expected to accumulate a higher proportion of mutations that cause evolutionary change.[38] These strategically-positioned genes have the potential to filter random genetic variation and translate it to nonrandom functionally integrated phenotypes, making adaptive variants effectively accessible to selection,[12] and, thus, many of the mutations contributing to phenotypic evolution may be concentrated in these genes.[37][39]
Neutral networks edit
The genotype–phenotype map perspective establishes that the way in which genotypic variation can be mapped to phenotypic variation is critical for the ability of a system to evolve.[11] The prevalence of neutral mutations in nature implies that biological systems have more genotypes than phenotypes,[40] and a consequence of this "many-to-few" relationship between genotype and phenotype is the existence of neutral networks.[6][41] In development, neutral networks are clusters of GRNs that differ in only one interaction between two nodes (e.g. replacing transcription with suppression) and yet produce the same phenotypic outcome.[6][12] In this sense, an individual phenotype within a population could be mapped to several equivalent GRNs, that together constitute a neutral network. Conversely, a GRN that differs in one interaction and causes a different phenotype is considered non-neutral.[6] Given this architecture, the probability of mutating from one phenotype to another will depend on the number of neutral-neighbors relative to non-neutral neighbors for a particular GRN,[6][12] and thus, phenotypic change will be influenced by the position of a GRN within the network and will be biased towards changes that require few mutations to reach a neighboring non-neutral GRN.[12][41]
See also edit
References edit
- ^ a b c Maynard Smith, John; Burian, R.; Kauffman, S.; Alberch, P.; Campbell, J.; Goodwin, B.; Lande, R.; Raup, D.; Wolpert, L. (1985). "Developmental constraints and evolution". The Quarterly Review of Biology. 60 (3): 265–287. doi:10.1086/414425. S2CID 85201850.
- ^ a b c Arthur, Wallace (2004). "The effect of development on the direction of evolution: toward a twenty-first century consensus". Evolution and Development. 6 (4): 282–288. doi:10.1111/j.1525-142x.2004.04033.x. ISSN 1520-541X. PMID 15230968.
- ^ a b c Gould, S. J.; Lewontin, R. C. (1979). "The spandrels of San Marco and the Panglossian paradigm: a critique of the adaptationist programme". Proceedings of the Royal Society of London B. 205 (1161): 581–598. Bibcode:1979RSPSB.205..581G. doi:10.1098/rspb.1979.0086. ISSN 0080-4649. PMID 42062. S2CID 2129408.
- ^ Gould, Stephen Jay (1989). "A Developmental Constraint in Cerion, with Comments of the Definition and Interpretation of Constraint in Evolution". Evolution. 43 (3): 516–539. doi:10.2307/2409056. JSTOR 2409056. PMID 28568388.
- ^ a b c Arthur, Wallace (2001). "Developmental drive: an important determinant of the direction of phenotypic evolution". Evolution and Development. 3 (4): 271–278. doi:10.1046/j.1525-142x.2001.003004271.x. ISSN 1520-541X. PMID 11478524. S2CID 41698287.
- ^ a b c d e f g h Wagner, Gunter P. (2014). Homology, Genes, and Evolutionary Innovation. Princeton University Press. ISBN 978-0691180670. OCLC 1005108561.[page needed]
- ^ a b c d Alberch, Pere (1989). "The logic of monsters: Evidence for internal constraint in development and evolution". Geobios. 22: 21–57. Bibcode:1989Geobi..22...21A. doi:10.1016/s0016-6995(89)80006-3. ISSN 0016-6995.
- ^ a b c d e Arthur, Wallace (2004). Biased Embryos and Evolution. Cambridge: Cambridge University Press. doi:10.1017/cbo9780511606830. ISBN 9780511606830.
- ^ a b Zimmer, Carl.; Emlen D.; Perkins, Alison EH (2013). Evolution: Making sense of life. Greenwood Village, CO: Roberts. ISBN 9781319202590. OCLC 1051973071.
- ^ Arthur, Wallace (2000). "The concept of developmental reprogramming and the quest for an inclusive theory of evolutionary mechanisms". Evolution and Development. 2 (1): 49–57. doi:10.1046/j.1525-142x.2000.00028.x. ISSN 1520-541X. PMID 11256417. S2CID 11972625.
- ^ a b c d Wagner, Günter P.; Altenberg, Lee (1996). "Perspective: Complex Adaptations and the Evolution of Evolvability". Evolution. 50 (3): 967–976. doi:10.1111/j.1558-5646.1996.tb02339.x. ISSN 0014-3820. PMID 28565291.
- ^ a b c d e f g h i j Uller, Tobias; Moczek, Armin P.; Watson, Richard A.; Brakefield, Paul M.; Laland, Kevin N. (2018). "Developmental Bias and Evolution: A Regulatory Network Perspective". Genetics. 209 (4): 949–966. doi:10.1534/genetics.118.300995. ISSN 0016-6731. PMC 6063245. PMID 30049818.
- ^ Drost, Hajk-Georg; Janitza, Philipp; Grosse, Ivo; Quint, Marcel (2017). "Cross-kingdom comparison of the developmental hourglass". Current Opinion in Genetics & Development. 45: 69–75. doi:10.1016/j.gde.2017.03.003. PMID 28347942.
- ^ Altenberg, L. (1995). "Genome Growth and the Evolution of the Genotype-Phenotype Map". In Banzhaf, W.; Eeckman, F. H. (eds.). Evolution and Biocomputation: Computational Models of Evolution. Berlin: Springer. pp. 205–259. ISBN 978-3-540-49176-7.
- ^ Altenberg, L. (2005). "Modularity in Evolution: Some Low-Level Questions". In Callebaut, W.; Rasskin-Gutman, D.; Simon, Herbert A. (eds.). Modularity: Understanding the Development and Evolution of Natural Complex Systems. Cambridge, MA: MIT Press. pp. 99–128. ISBN 978-0-262-03326-8.
- ^ a b Chartier, Marion; Jabbour, Florian; Gerber, Sylvain; Mitteroecker, Philipp; Sauquet, Hervé; von Balthazar, Maria; Staedler, Yannick; Crane, Peter R.; Schönenberger, Jürg (2014). "The floral morphospace - a modern comparative approach to study angiosperm evolution". New Phytologist. 204 (4): 841–853. doi:10.1111/nph.12969. ISSN 0028-646X. PMC 5526441. PMID 25539005.
- ^ a b c Gerber, Sylvain (2014). "Not all roads can be taken: development induces anisotropic accessibility in morphospace". Evolution & Development. 16 (6): 373–381. doi:10.1111/ede.12098. ISSN 1520-541X. PMID 25212955. S2CID 21562182.
- ^ Kemp, T.S. (2016). The Origin of Higher Taxa: Palaeobiological, developmental and ecological perspectives. Oxford University Press. doi:10.1093/acprof:oso/9780199691883.001.0001. ISBN 9780199691883.
- ^ a b c d Jablonski, D. (2017). "Approaches to Macroevolution: 1. General Concepts and Origin of Variation". Evolutionary Biology. 44 (4): 427–450. doi:10.1007/s11692-017-9420-0. ISSN 0071-3260. PMC 5661017. PMID 29142333.
- ^ a b c Olson, M.E. (2012). "The developmental renaissance in adaptationism". Trends in Ecology & Evolution. 27 (5): 278–287. doi:10.1016/j.tree.2011.12.005. ISSN 0169-5347. PMID 22326724.
- ^ Raup, David M. (1966). "Geometric Analysis of Shell Coiling: General Problems". Journal of Paleontology. 40 (5): 1178–1190. JSTOR 1301992.
- ^ Arthur, Wallace (2002). "The interaction between developmental bias and natural selection: from centipede segments to a general hypothesis". Heredity. 89 (4): 239–246. doi:10.1038/sj.hdy.6800139. ISSN 0018-067X. PMID 12242638.
- ^ Lange, Axel; Nemeschkal, Hans L.; Müller, Gerd B. (2014). "Biased Polyphenism in Polydactylous Cats Carrying a Single Point Mutation: The Hemingway Model for Digit Novelty". Evolutionary Biology. 41 (2): 262–275. doi:10.1007/s11692-013-9267-y. ISSN 0071-3260.
- ^ a b Blumberg, M.S. (2009). Freaks of Nature What Anomalies Tell Us About Development and Evolution. Oxford University Press. ISBN 978-0-1997-5064-1. OCLC 1058406207.
- ^ a b c d e Goswami, A.; Smaers, J. B.; Soligo, C.; Polly, P. D. (2014-08-19). "The macroevolutionary consequences of phenotypic integration: from development to deep time". Phil. Trans. R. Soc. B. 369 (1649): 20130254. doi:10.1098/rstb.2013.0254. ISSN 0962-8436. PMC 4084539. PMID 25002699.
- ^ Gould, S.J. (1966). "Allometry and Size in Ontogeny and Phylogeny". Biol. Rev. 41 (4): 587–640. doi:10.1111/j.1469-185X.1966.tb01624.x. PMID 5342162. S2CID 28606846.
- ^ Emlen, Douglas J. (2001-02-23). "Costs and the Diversification of Exaggerated Animal Structures". Science. 291 (5508): 1534–1536. Bibcode:2001Sci...291.1534E. doi:10.1126/science.1056607. ISSN 0036-8075. PMID 11222856. S2CID 24821274.
- ^ Pigliucci, M (2003). "Phenotypic integration: studying the ecology and evolution of complex phenotypes". Ecology Letters. 6 (3): 265–272. doi:10.1046/j.1461-0248.2003.00428.x. ISSN 1461-023X.
- ^ Lande, Russell; Arnold, Stevan J. (1983). "The Measurement of Selection on Correlated Characters". Evolution. 37 (6): 1210–1226. doi:10.1111/j.1558-5646.1983.tb00236.x. JSTOR 2408842. PMID 28556011.
- ^ Arnold, S.J. (1992). "Constraints on phenotypic evolution". The American Naturalist. 140: S85–S107. doi:10.1086/285398. PMID 19426028. S2CID 5965825.
- ^ a b Steppan, Scott J.; Patrick C. Phillips; David Houle (2002). "Comparative quantitative genetics: evolution of the G matrix". Trends in Ecology & Evolution. 17 (7): 320–327. doi:10.1016/S0169-5347(02)02505-3. ISSN 0169-5347.
- ^ a b c d e Jones, Adam G.; Arnold, Stevan J.; Bürger, Reinhard (2007). "The Mutation Matrix and the Evolution of Evolvability". Evolution. 61 (4): 727–745. doi:10.1111/j.1558-5646.2007.00071.x. ISSN 0014-3820. PMID 17439608.
- ^ Cheverud, James M. (1984). "Quantitative genetics and developmental constraints on evolution by selection". Journal of Theoretical Biology. 110 (2): 155–171. Bibcode:1984JThBi.110..155C. doi:10.1016/s0022-5193(84)80050-8. ISSN 0022-5193. PMID 6492829.
- ^ a b c Schluter, Dolph (1996). "Adaptive Radiation Along Genetic Lines of Least Resistance". Evolution. 50 (5): 1766–1774. doi:10.2307/2410734. JSTOR 2410734. PMID 28565589.
- ^ Hoekstra, H. E. (2006-07-05). "Genetics, development and evolution of adaptive pigmentation in vertebrates". Heredity. 97 (3): 222–234. doi:10.1038/sj.hdy.6800861. ISSN 0018-067X. PMID 16823403.
- ^ a b c Erwin, Douglas H.; Davidson, Eric H. (2009). "The evolution of hierarchical gene regulatory networks" (PDF). Nature Reviews Genetics. 10 (2): 141–148. doi:10.1038/nrg2499. ISSN 1471-0056. PMID 19139764. S2CID 7613857.
- ^ a b Stern, D.L. (2011). Evolution, development, & the predictable genome. Greenwood Village, Colorado: Roberts and Company Publishers. ISBN 978-1936221011. OCLC 762460688.
- ^ Kopp, A. (2009). "Metamodels and phylogenetic replication: A systematic approach to the evolution of developmental pathways". Evolution. 63 (11): 2771–2789. doi:10.1111/j.1558-5646.2009.00761.x. PMID 19545263.
- ^ Stern, D.L.; Orgogozo, V. (2008). "The Loci of Evolution: How Predictable is Genetic Evolution?". Evolution. 62 (9): 2155–2177. doi:10.1111/j.1558-5646.2008.00450.x. ISSN 0014-3820. PMC 2613234. PMID 18616572.
- ^ Schuster, Peter; Fontana, Walter; Stadler, Peter F.; Hofacker, Ivo L. (1994). "From sequences to shapes and back: a case study in RNA secondary structures". Proceedings of the Royal Society of London B. 255 (1344): 279–284. Bibcode:1994RSPSB.255..279S. doi:10.1098/rspb.1994.0040. ISSN 0962-8452. PMID 7517565. S2CID 12021473.
- ^ a b Wagner, Andreas (2011). "Genotype networks shed light on evolutionary constraints" (PDF). Trends in Ecology & Evolution. 26 (11): 577–584. doi:10.1016/j.tree.2011.07.001. ISSN 0169-5347. PMID 21840080.
Further reading edit
- Ontogeny and Phylogeny (Gould, 1977)
- Biased Embryos and Evolution (Arthur, 2004)
- Evolution: A developmental approach (Arthur, 2010)
- Homology, Genes, and Evolutionary Innovation (Wagner, 2014)
- Evolution, development, and the predictable genome (Stern, 2011)