


Summary
Differential item functioning (DIF) is a statistical property of a test item that indicates how likely it is for individuals from distinct groups, possessing similar abilities, to respond differently to the item. It manifests when individuals from different groups, with comparable skill levels, do not have an equal likelihood of answering a question correctly. There are two primary types of DIF: uniform DIF, where one group consistently has an advantage over the other, and nonuniform DIF, where the advantage varies based on the individual's ability level.[1] The presence of DIF requires review and judgment, but it doesn't always signify bias. DIF analysis provides an indication of unexpected behavior of items on a test. DIF characteristic of an item isn't solely determined by varying probabilities of selecting a specific response among individuals from different groups. Rather, DIF becomes pronounced when individuals from different groups, who possess the same underlying true ability, exhibit differing probabilities of giving a certain response. Even when uniform bias is present, test developers sometimes resort to assumptions such as DIF biases may offset each other due to the extensive work required to address it, compromising test ethics and perpetuating systemic biases.[2] Common procedures for assessing DIF are Mantel-Haenszel procedure, logistic regression, item response theory (IRT) based methods, and confirmatory factor analysis (CFA) based methods.[3]
Description edit
DIF refers to differences in the functioning of items across groups, oftentimes demographic, which are matched on the latent trait or more generally the attribute being measured by the items or test.[4][5] It is important to note that when examining items for DIF, the groups must be matched on the measured attribute, otherwise this may result in inaccurate detection of DIF. In order to create a general understanding of DIF or measurement bias, consider the following example offered by Osterlind and Everson (2009).[6] In this case, Y refers to a response to a particular test item which is determined by the latent construct being measured. The latent construct of interest is referred to as theta (θ) where Y is an indicator of θ which can be arranged in terms of the probability distribution of Y on θ by the expression f(Y)|θ. Therefore, response Y is conditional on the latent trait (θ). Because DIF examines differences in the conditional probabilities of Y between groups, let us label the groups as the "reference" and "focal" groups. Although the designation does not matter, a typical practice in the literature is to designate the reference group as the group who is suspected to have an advantage while the focal group refers to the group anticipated to be disadvantaged by the test.[3] Therefore, given the functional relationship and under the assumption that there are identical measurement error distributions for the reference and focal groups it can be concluded that under the null hypothesis:


with G corresponding to the grouping variable, "r" the reference group, and "f" the focal group. This equation represents an instance where DIF is not present. In this case, the absence of DIF is determined by the fact that the conditional probability distribution of Y is not dependent on group membership. To illustrate, consider an item with response options 0 and 1, where Y = 0 indicates an incorrect response, and Y = 1 indicates a correct response. The probability of correctly responding to an item is the same for members of either group. This indicates that there is no DIF or item bias because members of the reference and focal group with the same underlying ability or attribute have the same probability of responding correctly. Therefore, there is no bias or disadvantage for one group over the other. Consider the instance where the conditional probability of Y is not the same for the reference and focal groups. In other words, members of different groups with the same trait or ability level have unequal probability distributions on Y. Once controlling for θ, there is a clear dependency between group membership and performance on an item. For dichotomous items, this suggests that when the focal and reference groups are at the same location on θ, there is a different probability of getting a correct response or endorsing an item. Therefore, the group with the higher conditional probability of correctly responding to an item is the group advantaged by the test item. This suggests that the test item is biased and functions differently for the groups, therefore exhibits DIF. It is important to draw the distinction between DIF or measurement bias and ordinary group differences. Whereas group differences indicate differing score distributions on Y, DIF explicitly involves conditioning on θ. For instance, consider the following equation:

This indicates that an examinee's score is conditional on grouping such that having information about group membership changes the probability of a correct response. Therefore, if the groups differ on θ, and performance depends on θ, then the above equation would suggest item bias even in the absence of DIF. For this reason, it is generally agreed upon in the measurement literature that differences on Y conditional on group membership alone is inadequate for establishing bias.[7][8][9] In fact, differences on θ or ability are common between groups and establish the basis for much research. Remember to establish bias or DIF, groups must be matched on θ and then demonstrate differential probabilities on Y as a function of group membership.
Forms edit
Uniform DIF is the simplest type of DIF where the magnitude of conditional dependency is relatively invariant across the latent trait continuum (θ). The item of interest consistently gives one group an advantage across all levels of ability θ.[10] Within an item response theory (IRT) framework this would be evidenced when both item characteristic curves (ICC) are equally discriminating yet exhibit differences in the difficulty parameters (i.e., ar = af and br < bf) as depicted in Figure 1.[11] However, nonuniform DIF presents an interesting case. Rather than a consistent advantage being given to the reference group across the ability continuum, the conditional dependency moves and changes direction at different locations on the θ continuum.[12] For instance, an item may give the reference group a minor advantage at the lower end of the continuum while a major advantage at the higher end. Also, unlike uniform DIF, an item can simultaneously vary in discrimination for the two groups while also varying in difficulty (i.e., ar ≠ af and br < bf). Even more complex is "crossing" nonuniform DIF. As demonstrated in Figure 2, this occurs when an item gives an advantage to a reference group at one end of the θ continuum while favors the focal group at the other end. Differences in ICCs indicate that examinees from the two groups with identical ability levels have unequal probabilities of correctly responding to an item. When the curves are different but do not intersect, this is evidence of uniform DIF. However, if the ICCs cross at any point along the θ scale, there is evidence of nonuniform DIF.


Procedures for detecting DIF edit
Mantel-Haenszel edit
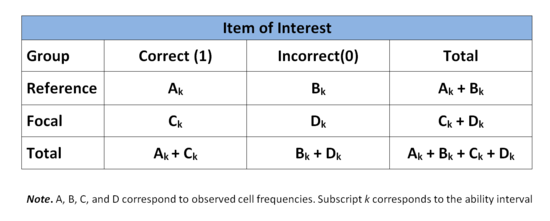
A common procedure for detecting DIF is the Mantel-Haenszel (MH) approach.[13] The MH procedure is a chi-squared contingency table based approach which examines differences between the reference and focal groups on all items of the test, one by one.[14] The ability continuum, defined by total test scores, is divided into k intervals which then serves as the basis for matching members of both groups.[15] A 2 x 2 contingency table is used at each interval of k comparing both groups on an individual item. The rows of the contingency table correspond to group membership (reference or focal) while the columns correspond to correct or incorrect responses. The following table presents the general form for a single item at the kth ability interval.
Odds ratio edit
The next step in the calculation of the MH statistic is to use data from the contingency table to obtain an odds ratio for the two groups on the item of interest at a particular k interval. This is expressed in terms of p and q where p represents the proportion correct and q the proportion incorrect for both the reference (R) and focal (F) groups. For the MH procedure, the obtained odds ratio is represented by α with possible value ranging from 0 to ∞. A α value of 1.0 indicates an absence of DIF and thus similar performance by both groups. Values greater than 1.0 suggest that the reference group outperformed or found the item less difficult than the focal group. On the other hand, if the obtained value is less than 1.0, this is an indication that the item was less difficult for the focal group.[8] Using variables from the contingency table above, the calculation is as follows:
α = (pRk / qRk)⁄(pFk / qFk)
= (Ak / (Ak + Bk)) / (Bk / (Ak + Bk)) ⁄ (Ck / (Ck + Dk)) / (Dk / (Ck + Dk))
= (Ak / Bk)⁄(Ck / Dk)
= AkDk⁄BkCk
The above computation pertains to an individual item at a single ability interval. The population estimate α can be extended to reflect a common odds ratio across all ability intervals k for a specific item. The common odds ratio estimator is denoted αMH and can be computed by the following equation:
αMH = Σ(AkDk / Nk)⁄ Σ(BkCk / Nk)
for all values of k and where Nk represents the total sample size at the kth interval.
The obtained αMH is often standardized through log transformation, centering the value around 0.[16] The new transformed estimator MHD-DIF is computed as follows:
MHD-DIF = -2.35ln(αMH)
Thus an obtained value of 0 would indicate no DIF. In examining the equation, it is important to note that the minus sign changes the interpretation of values less than or greater than 0. Values less than 0 indicate a reference group advantage whereas values greater than 0 indicate an advantage for the focal group.
Item response theory edit
Item response theory (IRT) is another widely used method for assessing DIF. IRT allows for a critical examination of responses to particular items from a test or measure. As noted earlier, DIF examines the probability of correctly responding to or endorsing an item conditioned on the latent trait or ability. Because IRT examines the monotonic relationship between responses and the latent trait or ability, it is a fitting approach for examining DIF.[17] Three major advantages of using IRT in DIF detection are:[18]
- Compared to classical test theory, IRT parameter estimates are not as confounded by sample characteristics.
- Statistical properties of items can be expressed with greater precision which increases the interpretation accuracy of DIF between two groups.
- These statistical properties of items can be expressed graphically, improving interpretability and understanding of how items function differently between groups.
In relation to DIF, item parameter estimates are computed and graphically examined via item characteristic curves (ICCs) also referred to as trace lines or item response functions (IRF). After examination of ICCs and subsequent suspicion of DIF, statistical procedures are implemented to test differences between parameter estimates. ICCs represent mathematical functions of the relationship between positioning on the latent trait continuum and the probability of giving a particular response.[19] Figure 3 illustrates this relationship as a logistic function. Individuals lower on the latent trait or with less ability have a lower probability of getting a correct response or endorsing an item, especially as difficulty increases. Thus, those higher on the latent trait or in ability have a greater chance of a correct response or endorsing an item. For instance, on a depression inventory, highly depressed individuals would have a greater probability of endorsing an item than individuals with lower depression. Similarly, individuals with higher math ability have a greater probability of getting a math item correct than those with lesser ability. Another critical aspect of ICCs pertains to the inflection point. This is the point on the curve where the probability of a particular response is .5 and also represents the maximum value for the slope.[20] This inflection point indicates where the probability of a correct response or endorsing an item becomes greater than 50%, except when a c parameter is greater than 0 which then places the inflection point at 1 + c/2 (a description will follow below). The inflection point is determined by the difficulty of the item which corresponds to values on the ability or latent trait continuum.[21] Therefore, for an easy item, this inflection point may be lower on the ability continuum while for a difficult item it may be higher on the same scale.

Before presenting statistical procedures for testing differences of item parameters, it is important to first provide a general understanding of the different parameter estimation models and their associated parameters. These include the one-, two-, and three-parameter logistic (PL) models. All these models assume a single underling latent trait or ability. All three of these models have an item difficulty parameter denoted b. For the 1PL and 2PL models, the b parameter corresponds to the inflection point on the ability scale, as mentioned above. In the case of the 3PL model, the inflection corresponds to 1 + c/2 where c is a lower asymptote (discussed below). Difficulty values, in theory, can range from -∞ to +∞; however in practice they rarely exceed ±3. Higher values are indicative of harder test items. Items exhibiting low b parameters are easy test items.[22] Another parameter that is estimated is a discrimination parameter designated a . This parameter pertains to an item's ability to discriminate among individuals. The a parameter is estimated in the 2PL and 3PL models. In the case of the 1PL model, this parameter is constrained to be equal between groups. In relation to ICCs, the a parameter is the slope of the inflection point. As mentioned earlier, the slope is maximal at the inflection point. The a parameter, similar to the b parameter, can range from -∞ to +∞; however typical values are less than 2. In this case, higher value indicate greater discrimination between individuals.[23] The 3PL model has an additional parameter referred to as a guessing or pseudochance parameter and is denoted by c. This corresponds to a lower asymptote which essentially allows for the possibility of an individual to get a moderate or difficult item correct even if they are low in ability. Values for c range between 0 and 1, however typically fall below .3.[24] When applying statistical procedures to assess for DIF, the a and b parameters (discrimination and difficulty) are of particular interest. However, assume a 1PL model was used, where the a parameters are constrained to be equal for both groups leaving only the estimation of the b parameters. After examining the ICCs, there is an apparent difference in b parameters for both groups. Using a similar method to a Student's t-test, the next step is to determine if the difference in difficulty is statistically significant. Under the null hypothesis H0: br = bf Lord (1980) provides an easily computed and normally distributed test statistic. d = (br - bf) / SE(br - bf) The standard error of the difference between b parameters is calculated by √[SE(br)]2 + √[SE(bf)]2
Wald statistic edit
However, more common than not, a 2PL or 3PL model is more appropriate than fitting a 1PL model to the data and thus both the a and b parameters should be tested for DIF. Lord (1980) proposed another method for testing differences in both the a and b parameters, where c parameters are constrained to be equal across groups. This test yields a Wald statistic which follows a chi-square distribution. In this case the null hypothesis being tested is H0: ar = af and br = bf. First, a 2 x 2 covariance matrix of the parameter estimates is calculated for each group which are represented by Sr and Sf for the reference and focal groups. These covariance matrices are computed by inverting the obtained information matrices. Next, the differences between estimated parameters are put into a 2 x 1 vector and is denoted by V' = (ar - af, br - bf) Next, covariance matrix S is estimated by summing Sr and Sf. Using this information, the Wald statistic is computed as follows: χ2 = V'S−1V which is evaluated at 2 degrees of freedom.
Likelihood-ratio test edit
The Likelihood-ratio test is another IRT based method for assessing DIF. This procedure involves comparing the ratio of two models. Under model (Mc) item parameters are constrained to be equal or invariant between the reference and focal groups. Under model (Mv) item parameters are free to vary.[25] The likelihood function under Mc is denoted (Lc) while the likelihood function under Mv is designated (Lv). The items constrained to be equal serve as anchor items for this procedure while items suspected of DIF are allowed to freely vary. By using anchor items and allowing remaining item parameters to vary, multiple items can be simultaneously assessed for DIF.[26] However, if the likelihood ratio indicates potential DIF, an item-by-item analysis would be appropriate to determine which items, if not all, contain DIF. The likelihood ratio of the two models is computed by G2 = 2ln[Lv / Lc] Alternatively, the ratio can be expressed by G2 = -2ln[Lc / Lv] where Lv and Lc are inverted and then multiplied by -2ln. G2 approximately follows a chi square distribution, especially with larger samples. Therefore, it is evaluated by the degrees of freedom that correspond to the number of constraints necessary to derive the constrained model from the freely varying model.[27] For instance, if a 2PL model is used and both a and b parameters are free to vary under Mv and these same two parameters are constrained in under Mc, then the ratio is evaluated at 2 degrees of freedom.
Logistic regression edit
Logistic regression approaches to DIF detection involve running a separate analysis for each item. The independent variables included in the analysis are group membership, an ability matching variable typically a total score, and an interaction term between the two. The dependent variable of interest is the probability or likelihood of getting a correct response or endorsing an item. Because the outcome of interest is expressed in terms of probabilities, maximum likelihood estimation is the appropriate procedure.[28] This set of variables can then be expressed by the following regression equation:
where β0 corresponds to the intercept or the probability of a response when M and G are equal to 0 with remaining βs corresponding to weight coefficients for each independent variable. The first independent variable, M, is the matching variable used to link individuals on ability, in this case a total test score, similar to that employed by the Mantel-Haenszel procedure. The group membership variable is denoted G and in the case of regression is represented through dummy coded variables. The final term MG corresponds to the interaction between the two above mentioned variables. For this procedure, variables are entered hierarchically. Following the structure of the regression equation provided above, variables are entered by the following sequence: matching variable M, grouping variable G, and the interaction variable MG. Determination of DIF is made by evaluating the obtained chi-square statistic with 2 degrees of freedom. Additionally, parameter estimate significance is tested. From the results of the logistic regression, DIF would be indicated if individuals matched on ability have significantly different probabilities of responding to an item and thus differing logistic regression curves. Conversely, if the curves for both groups are the same, then the item is unbiased and therefore DIF is not present. In terms of uniform and nonuniform DIF, if the intercepts and matching variable parameters for both groups are not equal, then there is evidence of uniform DIF. However, if there is a nonzero interaction parameter, this is an indication of nonuniform DIF.[29]
Considerations edit
Sample size edit
The first consideration pertains to issues of sample size, specifically with regard to the reference and focal groups. Prior to any analyses, information about the number of people in each group is typically known such as the number of males/females or members of ethnic/racial groups. However, the issue more closely revolves around whether the number of people per group is sufficient for there to be enough statistical power to identify DIF. In some instances such as ethnicity there may be evidence of unequal group sizes such that Whites represent a far larger group sample than each individual ethnic group being represented. Therefore, in such instances, it may be appropriate to modify or adjust data so that the groups being compared for DIF are in fact equal or closer in size. Dummy coding or recoding is a common practice employed to adjust for disparities in the size of the reference and focal group. In this case, all Non-White ethnic groups can be grouped together in order to have a relatively equal sample size for the reference and focal groups. This would allow for a "majority/minority" comparison of item functioning. If modifications are not made and DIF procedures are carried out, there may not be enough statistical power to identify DIF even if DIF exists between groups. Another issue that pertains to sample size directly relates to the statistical procedure being used to detect DIF. Aside from sample size considerations of the reference and focal groups, certain characteristics of the sample itself must be met to comply with assumptions of each statistical test utilized in DIF detection. For instance, using IRT approaches may require larger samples than required for the Mantel-Haenszel procedure. This is important, as investigation of group size may direct one toward using one procedure over another. Within the logistic regression approach, leveraged values and outliers are of particular concern and must be examined prior to DIF detection. Additionally, as with all analyses, statistical test assumptions must be met. Some procedures are more robust to minor violations while others less so. Thus, the distributional nature of sample responses should be investigated prior to implementing any DIF procedures.
Items edit
Determining the number of items being used for DIF detection must be considered. No standard exists as to how many items should be used for DIF detection as this changes from study-to-study. In some cases it may be appropriate to test all items for DIF, whereas in others it may not be necessary. If only certain items are suspected of DIF with adequate reasoning, then it may be more appropriate to test those items and not the entire set. However, oftentimes it is difficult to simply assume which items may be problematic. For this reason, it is often recommended to simultaneously examine all test items for DIF. This will provide information about all items, shedding light on problematic items as well as those that function similarly for both the reference and focal groups. With regard to statistical tests, some procedures such as IRT-Likelihood Ratio testing require the use of anchor items. Some items are constrained to be equal across groups while items suspected of DIF are allowed to freely vary. In this instance, only a subset would be identified as DIF items while the rest would serve as a comparison group for DIF detection. Once DIF items are identified, the anchor items can also be analyzed by then constraining the original DIF items and allowing the original anchor items to freely vary. Thus it seems that testing all items simultaneously may be a more efficient procedure. However, as noted, depending on the procedure implemented different methods for selecting DIF items are used. Aside from identifying the number of items being used in DIF detection, of additional importance is determining the number of items on the entire test or measure itself. The typical recommendation as noted by Zumbo (1999) is to have a minimum of 20 items. The reasoning for a minimum of 20 items directly relates to the formation of matching criteria. As noted in earlier sections, a total test score is typically used as a method for matching individuals on ability. The total test score is divided up into normally 3–5 ability levels (k) which is then used to match individuals on ability prior to DIF analysis procedures. Using a minimum of 20 items allows for greater variance in the score distribution which results in more meaningful ability level groups. Although the psychometric properties of the instrument should have been assessed prior to being utilized, it is important that the validity and reliability of an instrument be adequate. Test items need to accurately tap into the construct of interest in order to derive meaningful ability level groups. Of course, one does not want to inflate reliability coefficients by simply adding redundant items. The key is to have a valid and reliable measure with sufficient items to develop meaningful matching groups. Gadermann et al. (2012),[30] Revelle and Zinbarg (2009),[31] and John and Soto (2007)[32] offer more information on modern approaches to structural validation and more precise and appropriate methods for assessing reliability.
Balancing statistics and reasoning edit
As with all psychological research and psychometric evaluation, statistics play a vital role but should by no means be the sole basis for decisions and conclusions reached. Reasoned judgment is of critical importance when evaluating items for DIF. For instance, depending on the statistical procedure used for DIF detection, differing results may be yielded. Some procedures are more precise while others less so. For instance, the Mantel-Haenszel procedure requires the researcher to construct ability levels based on total test scores whereas IRT more effectively places individuals along the latent trait or ability continuum. Thus, one procedure may indicate DIF for certain items while others do not.
Another issue is that sometimes DIF may be indicated but there is no clear reason why DIF exists. This is where reasoned judgment comes into play. Especially by understanding why uniform and nonuniform DIF occurs.[33] The researcher must use common sense to derive meaning from DIF analyses. It is not enough to report that items function differently for groups; there needs to be a qualitative reasoning for why it occurs.
Uniform DIF occurs when there's a consistent advantage for one group compared to another across all levels of ability. This type of bias can often be addressed by using separate test norms for different groups to ensure fairness in assessment. Nonuniform DIF, on the other hand, is more complex as the advantage varies based on individuals' ability levels. Factors such as socioeconomic status, cultural differences, language barriers, and disparities in knowledge access can contribute to nonuniform DIF. Identifying and addressing nonuniform DIF requires a deeper understanding of the underlying cognitive processes involved and may require tailored interventions to ensure fair assessment practices.
In DIF studies, uncovering certain items exhibiting DIF is common, indicating potential issues needing scrutiny. However, DIF evidence doesn't automatically imply the entire test is unfair. Instead, it signals specific items may be biased, requiring attention to maintain test integrity and fairness for all examinees. Identifying items with DIF offers an opportunity to review and potentially revise or remove problematic items, ensuring equitable assessment practices. Therefore, DIF analysis serves as a valuable tool for item analysis, particularly when supplemented with qualitative exploration of causal factors.
Statistical software edit
Below are common statistical programs capable of performing the procedures discussed herein. By clicking on list of statistical packages, you will be directed to a comprehensive list of open source, public domain, freeware, and proprietary statistical software.
Mantel-Haenszel procedure
- SPSS
- SAS
- Stata
- R (e.g., 'difR'[34] package)
- Systat
- Lertap 5
IRT-based procedures
Logistic regression
- SPSS
- SAS
- Stata
- R (e.g., 'difR'[34] package)
- Systat
See also edit
References edit
- ^ National Council on Measurement in Education http://www.ncme.org/ncme/NCME/Resource_Center/Glossary/NCME/Resource_Center/Glossary1.aspx?hkey=4bb87415-44dc-4088-9ed9-e8515326a061#anchorD Archived 2017-07-22 at the Wayback Machine
- ^ De Leo, Joseph A.; Van Dam, Nicholas T.; Hobkirk, Andréa L.; Earleywine, Mitch (2011-04-01). "Examining bias in the impulsive sensation seeking (ImpSS) Scale using Differential Item Functioning (DIF) – An item response analysis". Personality and Individual Differences. 50 (5): 570–576. doi:10.1016/j.paid.2010.11.030. ISSN 0191-8869.
- ^ Zumbo, B.D. (2007). Three generations of differential item functioning (DIF) analyses: Considering where it has been, where it is now, and where it is going. Language Assessment Quarterly, 4, 223–233.
- ^ Camilli, G. (2006). Test fairness: In R. L. (Ed.), Educational measurement (4th ed., pp. 220–256). Westport, CT: American Council on Education.
- ^ Holland, P. W., & Wainer, H. (1993). Differential item functioning. Hillsdale, NJ: Lawrence Erlbaum.
- ^ Osterlind, S. J. & Everson, H. T. (2009). Differential item functioning. Thousand Oaks, CA: Sage Publishing.
- ^ Ackerman, T. (1992). A didactic explanation of item bias, item impact, and item validity from a multidimensional perspective. Journal of Educational Measurement, 29, 674–691.
- ^ Lord, F. M. (1980). Applications of item response theory to practical testing problems. Hillsdale, NJ: Lawrence Erlbaum.
- ^ Millsap, R. E., & Everson, H. T. (1993). Methodological review: Statistical approaches for assessing measurement bias. Applied Psychological Measurement, 17(4), 297–334.
- ^ Walker, C. (2011). What's the DIF? Why differential item functioning analyses are an important part of instrument development and validation. Journal of Psychoeducational Assessment, 29, 364–376
- ^ Mellenbergh, G. J. (1982). Contingency table models for assessing item bias. Journal of Educational Statistics, 7, 105–118.
- ^ Walker, C. M., Beretvas, S. N., Ackerman, T. A. (2001). An examination of conditioning variables used in computer adaptive testing for DIF. Applied Measurement in Education, 14, 3–16.
- ^ Mantel, N., & Haenszel, W. (1959). Statistical aspects of the analysis of data from retrospective studies of disease. Journal of the National Cancer Institute, 22, 719–748.
- ^ Marasculio, L. A., & Slaughter, R. E. (1981). Statistical procedures for identifying possible sources of item bias based on 2 x 2 statistics. Journal of Educational Measurement, 18, 229–248.
- ^ Holland, P. W., & Thayer, D. T. (1988). Differential item performance and the Mantel-Haenszel procedure. In H. Wainer & H. I. Braun (Eds.), Test validity (pp. 129–145). Hillsdale, NJ: Erlbaum.
- ^ Dorans, N. J., & Holland, P. W. (1993). DIF detection and description: Mantel-Haenszel and standardization. In P. W. Holland & H. Wainer (Eds.), Differential item functioning (pp. 35–66). Hillsdale, NJ: Erlbaum.
- ^ Steinberg, L., & Thissen, D. (2006). Using effect sizes for research reporting: Examples using item response theory to analyze differential item functioning. Psychological Methods, 11(4), 402–415.
- ^ Camilli, G., & Shepard, L. (1994). Methods for identifying biased test items. Thousand Oaks, CA: Sage.
- ^ Reise, S. P., & Ainsworth, A. T., & Haviland, M. G. (2005). Item response theory: Fundamentals, applications, and promise in psychological research. Current Directions in Psychological Science, 14, 95–101.
- ^ Edelen, M. O., Reeve, B. B. (2007). Applying item response theory (IRT) modeling to questionnaire development, evaluation, and refinement. Quality of Life Research, 16, 5–18.
- ^ DeMars, C. (2010). Item response theory. New York: Oxford Press.
- ^ Harris, D. (1989). Comparison of 1-, 2-, 3-parameter IRT models. Educational Measurement: Issues and Practice, 8, 35–41.
- ^ Baker, F. B. (2001). The basics of item response theory. ERIC Clearinghouse on Assessment and Evaluation.
- ^ Birnbaum, A. (1968). Some latent trait models and their use in inferring an examinee's ability. Part 5 in F. M. Lord and M. R. Novick. Statistical Theories of Mental Test Scores. Reading, MA: Addison-Wesley
- ^ Thissen, D., Steinberg, L., Gerrard, M. (1986). Beyond group differences: The concept of bias. Psychological Bulletin, 99, 118–128.
- ^ IRTPRO: User Guide. (2011). Lincolnwood, IL: Scientific Software International, Inc.
- ^ Thissen, D., Steinberg, L., & Wainer, H. (1993). Detection of differential item functioning using the parameters of item response models. In P. W. Holland and & H. Wainer (Eds.), Differential item functioning(pp. 67–113). Hillsdale, NJ: Lawrence Erlbaum.
- ^ Bock, R. D. (1975). Multivariate statistical methods. New York: McGraw-Hill.
- ^ Swaminathan, H., & Rogers, H. J. (1990). Detecting differential item functioning using logistic regression procedures. Journal of Educational Measurement, 27, 361–370.
- ^ Gadermann, A., M., Guhn, M., & Zumbo, B. D. (2012). Estimating ordinal reliability for Likert-type and ordinal item response data: A conceptual, empirical, and practical guide. Practical Assessment, Research, & Evaluation, 17(3), 1–13.
- ^ Revelle, W., & Zinbarg, R. E. (2009). Coefficients alpha, beta, omega, and the GLB: Comments on Sijtsma. Psychometrika, 74(1), 145–154.
- ^ John, O. P., & Soto, C. J. (2007). The importance of being valid: Reliability and the process of construct validation. In R. W. Robins, R. C. Fraley, & R. F. Krueger (Eds.), Handbook of research methods in personality psychology (pp. 461–494). New York, NY: Cambridge University Press.
- ^ Holland, P. W., & Thayer, D. T. (1988). Differential item performance and the Mantel-Haenszel procedure. In H. Wainer & H. I. Braun (Eds.), Test validity (pp. 129–145). Lawrence Erlbaum Associates, Inc.
- ^ a b c Magis, David; Béland, Sébastien; Tuerlinckx, Francis; De Boeck, Paul (2010). "A general framework and an R package for the detection of dichotomous differential item functioning". Behavior Research Methods. 42 (3): 847–862. doi:10.3758/BRM.42.3.847. PMID 20805607.
- ^ Chalmers, R. P. (2012). "mirt: A Multidimensional Item Response Theory Package for the R Environment". Journal of Statistical Software. 48 (6): 1–29. doi:10.18637/jss.v048.i06.