


Summary
East Fife was a county constituency represented in the House of Commons of the Parliament of the United Kingdom from 1885 to 1983. Along with West Fife, it was formed by splitting the old Fife constituency.
| East Fife | |
|---|---|
| Former County constituency for the House of Commons | |
| Subdivisions of Scotland | Fife |
| 1885–1983 | |
| Seats | One |
| Created from | Fife and (from 1918) St Andrews Burghs |
| Replaced by | North East Fife and Central Fife[1] |
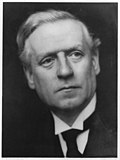
It elected one Member of Parliament using the first-past-the-post voting system, and from 1886 to 1918 it was represented by the Liberal Prime Minister (1908–16), H. H. Asquith.
Boundaries edit
In 1885, the constituency comprised the parishes of Abdie, Abernethy, Anstruther Wester, Anstruther Easter, Auchtermuchty, Balmerino, Cameron, Carnbee, Ceres, Collessie, Crail, Creich, Cults, Cupar, Dairsie, Dunbog, Dunino, Elie, Falkland, Ferry-Port-on-Craig, Flisk, Forgan, Kemback, Kennoway, Kettle, Kilconquhar, Kilmany, Kilrenny, Kingsbarns, Largo, Leuchars, Logie, Monimail, Moonzie, Newburgh, Newburn, Pittenweem, St Andrews, St Leonards, St Monance, Scoonie and Strathmiglo.[2]
In 1918, on the dissolution of the St Andrews Burghs constituency, the burghs of St Andrews, Anstruther Easter, Anstruther Wester, Crail, Cupar, Kilrenny and Pittenweem were added to the constituency. It then consisted of "The Cupar and St. Andrews County Districts, inclusive of all burghs situated therein, together with the burgh of Leven and so much of the Kirkcaldy County District as is contained within the extra-burghal portion of the parish of Scoonie and the parish of Kennoway."
Members of Parliament edit
Election results edit
Elections in the 1880s edit
| Party | Candidate | Votes | % | ±% | |
|---|---|---|---|---|---|
| Liberal | John Boyd Kinnear | 4,533 | 63.8 | ||
| Conservative | John Gilmour | 2,577 | 36.2 | ||
| Majority | 1,956 | 27.6 | |||
| Turnout | 7,110 | 77.0 | |||
| Registered electors | 9,233 | ||||
| Liberal win (new seat) | |||||

| Party | Candidate | Votes | % | ±% | |
|---|---|---|---|---|---|
| Liberal | H. H. Asquith | 2,863 | 53.5 | −10.3 | |
| Liberal Unionist | John Boyd Kinnear | 2,489 | 46.5 | +10.3 | |
| Majority | 374 | 7.0 | −20.6 | ||
| Turnout | 5,352 | 58.0 | -19.0 | ||
| Registered electors | 9,233 | ||||
| Liberal hold | Swing | −10.3 | |||
Elections in the 1890s edit
| Party | Candidate | Votes | % | ±% | |
|---|---|---|---|---|---|
| Liberal | H. H. Asquith | 3,743 | 52.0 | −1.5 | |
| Conservative | John Gilmour | 3,449 | 48.0 | +1.5 | |
| Majority | 294 | 4.0 | −3.0 | ||
| Turnout | 7,192 | 78.7 | +20.7 | ||
| Registered electors | 9,133 | ||||
| Liberal hold | Swing | −1.5 | |||
Asquith is appointed Secretary of State for the Home Department, requiring a by-election.
| Party | Candidate | Votes | % | ±% | |
|---|---|---|---|---|---|
| Liberal | H. H. Asquith | Unopposed | |||
| Liberal hold | |||||
| Party | Candidate | Votes | % | ±% | |
|---|---|---|---|---|---|
| Liberal | H. H. Asquith | 4,332 | 54.5 | +2.5 | |
| Conservative | John Gilmour | 3,616 | 45.5 | -2.5 | |
| Majority | 716 | 9.0 | +5.0 | ||
| Turnout | 7,948 | 84.3 | +5.6 | ||
| Registered electors | 9,432 | ||||
| Liberal hold | Swing | +2.5 | |||
Elections in the 1900s edit
| Party | Candidate | Votes | % | ±% | |
|---|---|---|---|---|---|
| Liberal | H. H. Asquith | 4,141 | 60.4 | +5.9 | |
| Conservative | Arthur Constable | 2,710 | 39.6 | -5.9 | |
| Majority | 1,431 | 20.8 | +11.8 | ||
| Turnout | 6,851 | 72.1 | -12.2 | ||
| Registered electors | 9,505 | ||||
| Liberal hold | Swing | +5.9 | |||
| Party | Candidate | Votes | % | ±% | |
|---|---|---|---|---|---|
| Liberal | H. H. Asquith | 4,723 | 59.0 | -1.4 | |
| Conservative | John Gilmour | 3,279 | 41.0 | +1.4 | |
| Majority | 1,444 | 18.0 | -2.8 | ||
| Turnout | 8,002 | 80.0 | +7.9 | ||
| Registered electors | 9,998 | ||||
| Liberal hold | Swing | −1.4 | |||
Elections in the 1910s edit
| Party | Candidate | Votes | % | ±% | |
|---|---|---|---|---|---|
| Liberal | H. H. Asquith | 5,242 | 62.2 | +3.2 | |
| Conservative | Alexander Sprot | 3,183 | 37.8 | -3.2 | |
| Majority | 2,059 | 24.4 | +6.4 | ||
| Turnout | 8,425 | 81.2 | +1.2 | ||
| Liberal hold | Swing | ||||
| Party | Candidate | Votes | % | ±% | |
|---|---|---|---|---|---|
| Liberal | H. H. Asquith | 5,149 | 60.6 | -1.6 | |
| Conservative | Alexander Sprot | 3,350 | 39.4 | +1.6 | |
| Majority | 1,799 | 21.2 | -3.2 | ||
| Turnout | 8,499 | 78.0 | -3.2 | ||
| Liberal hold | Swing | ||||
| Party | Candidate | Votes | % | ±% | |
|---|---|---|---|---|---|
| Liberal | H. H. Asquith | Unopposed | |||
| Liberal hold | |||||
| Party | Candidate | Votes | % | ±% | |
|---|---|---|---|---|---|
| Unionist | Alexander Sprot | 8,996 | 54.2 | +14.8 | |
| Liberal | H. H. Asquith | 6,996 | 42.2 | -18.4 | |
| Independent Progressive | William Pritchard Morgan | 591 | 3.6 | New | |
| Majority | 2,002 | 12.0 | N/A | ||
| Turnout | 16,581 | 54.0 | -24.0 | ||
| Unionist gain from Liberal | Swing | ||||
Elections in the 1920s edit
| Party | Candidate | Votes | % | ±% | |
|---|---|---|---|---|---|
| Liberal | James Duncan Millar | 12,697 | 56.0 | +13.8 | |
| Unionist | Alexander Sprot | 9,987 | 44.0 | -10.2 | |
| Majority | 2,710 | 12.0 | N/A | ||
| Turnout | 22,684 | 67.2 | +13.2 | ||
| Liberal gain from Unionist | Swing | +12.0 | |||
| Party | Candidate | Votes | % | ±% | |
|---|---|---|---|---|---|
| Liberal | James Duncan Millar | 12,825 | 55.5 | -0.5 | |
| Unionist | Alexander Sprot | 10,275 | 44.5 | +0.5 | |
| Majority | 2,550 | 11.0 | -1.0 | ||
| Turnout | 23,100 | 67.8 | +0.6 | ||
| Liberal hold | Swing | -0.5 | |||
| Party | Candidate | Votes | % | ±% | |
|---|---|---|---|---|---|
| Unionist | Archibald Cochrane | 12,664 | 53.0 | +8.5 | |
| Liberal | James Duncan Millar | 11,242 | 47.0 | -8.5 | |
| Majority | 1,422 | 6.0 | N/A | ||
| Turnout | 23,906 | 69.2 | +1.4 | ||
| Unionist gain from Liberal | Swing | ||||
| Party | Candidate | Votes | % | ±% | |
|---|---|---|---|---|---|
| Liberal | James Duncan Millar | 14,329 | 42.9 | -4.1 | |
| Unionist | Archibald Cochrane | 13,748 | 41.1 | -11.9 | |
| Labour | W R Garson | 5,350 | 6.0 | New | |
| Majority | 581 | 1.8 | N/A | ||
| Turnout | 33,427 | 73.3 | +4.1 | ||
| Liberal gain from Unionist | Swing | +3.9 | |||
Elections in the 1930s edit
| Party | Candidate | Votes | % | ±% | |
|---|---|---|---|---|---|
| National Liberal | James Duncan Millar | Unopposed | |||
| National Liberal gain from Liberal | |||||
| Party | Candidate | Votes | % | ±% | |
|---|---|---|---|---|---|
| National Liberal | James Henderson-Stewart | 15,770 | 52.2 | N/A | |
| Labour | Joseph Westwood | 6,635 | 22.0 | New | |
| Agricultural Party | J. L. Anderson | 4,404 | 14.6 | New | |
| Independent Liberal | David Edwin Keir | 2,296 | 7.6 | New | |
| National (Scotland) | Eric Linklater | 1,083 | 3.6 | New | |
| Majority | 9,135 | 30.2 | N/A | ||
| Turnout | 30,188 | 65.6 | N/A | ||
| National Liberal hold | Swing | ||||
| Party | Candidate | Votes | % | ±% | |
|---|---|---|---|---|---|
| National Liberal | James Henderson-Stewart | 27,915 | 82.3 | +30.1 | |
| Labour | Alexander Kerr Davidson | 6,016 | 17.7 | -4.3 | |
| Majority | 21,899 | 64.6 | +34.4 | ||
| Turnout | 33,931 | 71.0 | +5.4 | ||
| National Liberal hold | Swing | ||||
Elections in the 1940s edit
| Party | Candidate | Votes | % | ±% | |
|---|---|---|---|---|---|
| National Liberal | James Henderson-Stewart | 24,765 | 69.4 | -12.9 | |
| Labour Co-op | Samuel McLaren | 10,920 | 30.6 | +12.9 | |
| Majority | 13,845 | 38.8 | -25.8 | ||
| Turnout | 35,685 | 70.8 | -0.2 | ||
| National Liberal hold | Swing | ||||
Elections in the 1950s edit
| Party | Candidate | Votes | % | ±% | |
|---|---|---|---|---|---|
| National Liberal | James Henderson Stewart | 25,749 | 63.7 | -5.7 | |
| Labour Co-op | Samuel McLaren | 10,694 | 26.5 | -4.1 | |
| Liberal | David Alexander Freeman | 3,975 | 9.8 | New | |
| Majority | 15,055 | 37.2 | -1.6 | ||
| Turnout | 40,418 | 81.1 | +1.3 | ||
| National Liberal hold | Swing | ||||
| Party | Candidate | Votes | % | ±% | |
|---|---|---|---|---|---|
| National Liberal | James Henderson Stewart | 28,446 | 70.6 | +6.9 | |
| Labour | John McGowan | 11,844 | 29.4 | +2.9 | |
| Majority | 16,602 | 41.2 | +4.0 | ||
| Turnout | 40,290 | 78.7 | -2.4 | ||
| National Liberal hold | Swing | ||||
| Party | Candidate | Votes | % | ±% | |
|---|---|---|---|---|---|
| National Liberal | James Henderson Stewart | 26,104 | 70.6 | 0.0 | |
| Labour | John McGowan | 10,872 | 29.4 | 0.0 | |
| Majority | 15,522 | 41.2 | 0.0 | ||
| Turnout | 36,976 | 73.2 | -5.5 | ||
| National Liberal hold | Swing | ||||
| Party | Candidate | Votes | % | ±% | |
|---|---|---|---|---|---|
| National Liberal | James Henderson Stewart | 26,585 | 69.9 | -0.7 | |
| Labour | John Nicol | 11,421 | 30.0 | +0.6 | |
| Majority | 15,164 | 39.9 | -1.3 | ||
| Turnout | 38,006 | 75.2 | +2.0 | ||
| National Liberal hold | Swing | ||||
Elections in the 1960s edit
| Party | Candidate | Votes | % | ±% | |
|---|---|---|---|---|---|
| Unionist | John Gilmour | 15,948 | 47.5 | -22.4 | |
| Labour | John Smith | 8,882 | 26.4 | −3.6 | |
| Liberal | Donald Leach | 8,786 | 26.1 | New | |
| Majority | 7,066 | 21.1 | -18.8 | ||
| Turnout | 33,616 | ||||
| Unionist hold | Swing | -9.3 | |||
| Party | Candidate | Votes | % | ±% | |
|---|---|---|---|---|---|
| Unionist | John Gilmour | 21,001 | 54.2 | -15.7 | |
| Labour | John Smith | 9,765 | 25.2 | -4.8 | |
| Liberal | Derek C Wood | 5,075 | 13.1 | N/A | |
| SNP | James Braid | 2,635 | 6.8 | New | |
| Independent Loyalist | Leslie M.C. Greene | 257 | 0.7 | New | |
| Majority | 11,236 | 29.0 | -10.9 | ||
| Turnout | 38,733 | 77.8 | +2.6 | ||
| Unionist hold | Swing | ||||
| Party | Candidate | Votes | % | ±% | |
|---|---|---|---|---|---|
| Conservative | John Gilmour | 19,323 | 51.5 | −2.7 | |
| Labour | Harry Peaker | 9,229 | 24.6 | −0.6 | |
| SNP | James Braid | 5,394 | 14.4 | +7.6 | |
| Liberal | Derek A. Barrie | 3,574 | 9.5 | −3.6 | |
| Majority | 10,094 | 26.9 | −2.1 | ||
| Turnout | 37,520 | 76.1 | −1.7 | ||
| Conservative hold | Swing | ||||
Elections in the 1970s edit
| Party | Candidate | Votes | % | ±% | |
|---|---|---|---|---|---|
| Conservative | John Gilmour | 21,619 | 54.6 | +3.1 | |
| Labour | Harry Ewing | 9,756 | 24.6 | 0.0 | |
| SNP | James Braid | 4,666 | 11.8 | −2.6 | |
| Liberal | Willis Pickard | 3,577 | 9.0 | −0.5 | |
| Majority | 11,863 | 30.0 | +3.1 | ||
| Turnout | 39,618 | 74.4 | −1.7 | ||
| Conservative hold | Swing | ||||
| Party | Candidate | Votes | % | ±% | |
|---|---|---|---|---|---|
| Conservative | John Gilmour | 21,172 | 47.9 | −6.7 | |
| SNP | James Braid | 8,593 | 19.5 | +7.7 | |
| Liberal | Willis Pickard | 7,766 | 17.6 | +8.6 | |
| Labour | Bashir Maan | 6,634 | 15.0 | −9.6 | |
| Majority | 12,579 | 28.4 | −1.6 | ||
| Turnout | 44,165 | 78.8 | +4.4 | ||
| Conservative hold | Swing | ||||
| Party | Candidate | Votes | % | ±% | |
|---|---|---|---|---|---|
| Conservative | John Gilmour | 16,116 | 38.8 | −9.1 | |
| SNP | James Braid | 13,202 | 31.8 | +12.3 | |
| Labour | Helen Liddell | 7,040 | 16.9 | +1.9 | |
| Liberal | D.W.C. Docherty | 5,247 | 12.6 | −5.0 | |
| Majority | 2,914 | 7.0 | −21.4 | ||
| Turnout | 41,605 | 73.7 | −5.1 | ||
| Conservative hold | Swing | ||||
| Party | Candidate | Votes | % | ±% | |
|---|---|---|---|---|---|
| Conservative | Barry Henderson | 20,117 | 43.0 | +4.2 | |
| Liberal | Menzies Campbell | 10,762 | 23.0 | +10.4 | |
| Labour | Henry McLeish | 9,339 | 19.9 | +3.0 | |
| SNP | J. Marshall | 6,612 | 14.1 | −17.7 | |
| Majority | 9,355 | 20.0 | +13.0 | ||
| Turnout | 46,830 | 79.0 | +5.3 | ||
| Conservative hold | Swing | ||||
References edit
- ^ "'Fife East', Feb 1974 - May 1983". ElectionWeb Project. Cognitive Computing Limited. Retrieved 22 March 2016.
- ^ Redistribution of Seats Act 1885
- ^ a b c d e f g Craig, FWS, ed. (1974). British Parliamentary Election Results: 1885-1918. London: Macmillan Press. ISBN 9781349022984.
- ^ Debrett's House of Commons and the Judicial Bench
- ^ Whitaker's Almanack, 1934
- ^ Whitaker's Almanack, 1939
Sources edit
- Leigh Rayment's Historical List of MPs – Constituencies beginning with "F"
- Election results, 1950 - 1970 Archived 5 May 2004 at the Wayback Machine
- F. W. S. Craig, British Parliamentary Election Results 1974 - 1983
- F. W. S. Craig, British Parliamentary Election Results 1918 - 1949
- F. W. S. Craig, British Parliamentary Election Results 1885 - 1918