


Summary
East Grinstead was a parliamentary constituency in the Kingdom of England, the Kingdom of Great Britain, and the United Kingdom. It first existed as a Parliamentary borough from 1307, returning two Members of Parliament to the House of Commons elected by the bloc vote system. The borough was disfranchised under the Reform Act 1832, but the name was revived at the 1885 election when the Redistribution of Seats Act created a new single-member county division of the same name.
| East Grinstead | |
|---|---|
| Former County constituency for the House of Commons | |
| County | East Sussex |
| Major settlements | East Grinstead |
| 1885–1983 | |
| Seats | One |
| Created from | East Sussex |
| Replaced by | Mid Sussex and Wealden |
| 1307–1832 | |
| Seats | Two |
| Type of constituency | Borough constituency |
Upon its abolition for the 1983 election, its territory was divided between Mid Sussex and Wealden.
Boundaries edit
1885–1918: The Sessional Divisions of Cuckfield (except the parish of Crawley), East Grinstead, and Uckfield (except the parishes of East Heathley and Waldron).
1918–1950: The Urban Districts of Burgess Hill, Cuckfield, East Grinstead, Hayward's Heath, and Uckfield, and the Rural Districts of Cuckfield, East Grinstead, and Uckfield.
1950–1955: The Urban Districts of Cuckfield and East Grinstead, the Rural District of Uckfield, in the Rural District of Cuckfield the parishes of Ardingly, Balcombe, Bolney, Cuckfield Rural, Horsted Keynes, Lindfield Rural, Slaugham, West Hoathly, and Worth, and in the Rural District of Battle the parishes of Burwash, Etchingham, and Ticehurst.
1955–1974: As 1950 less the Battle RD parishes.
1974–1983: The Urban District of East Grinstead, and the Rural District of Uckfield.
Members of Parliament edit
MPs 1307–1660 edit
| Year | First member | Second member | |
|---|---|---|---|
| 1388 (Feb) | John Dyne | John Heldele[1] | |
| 1388 (Sep) | William Nelond | Richard Woghere[1] | |
| 1390 (Jan) | |||
| 1390 (Nov) | |||
| 1391 | John Alfray I | John Dyne[1] | |
| 1393 | Thomas Alleyn | Thomas Rasse[1] | |
| 1394 | |||
| 1395 | Thomas Farlegh | William atte Hull[1] | |
| 1397 (Jan) | John Dyne | John Punget[1] | |
| 1397 (Sep) | John Dyne | John Punget[1] | |
| 1399 | John Dyne | Richard Woghere[1] | |
| 1401 | |||
| 1402 | John Dyne | Richard Woghere[1] | |
| 1404 (Jan) | |||
| 1404 (Oct) | |||
| 1406 | |||
| 1407 | John Dyne | Richard Woghere[1] | |
| 1410 | |||
| 1411 | |||
| 1413 (Feb) | |||
| 1413 (May) | Thomas Alleyn | John Hoke[1] | |
| 1414 (Apr) | |||
| 1414 (Nov) | John Dyne | John Woghere[1] | |
| 1415 | |||
| 1416 (Mar) | John Ermyte | John Mason[1] | |
| 1416 (Oct) | |||
| 1417 | |||
| 1419 | William Fenningham | John Hamme[1] | |
| 1420 | |||
| 1421 (May) | Richard Fowell | John Woghere[1] | |
| 1421 (Dec) | John Alfray II | John Woghere[1] | |
| 1433 | Thomas Russell[2] | ||
| 1447 John Alfray[3] | 1457 | Ralph Legh | |
| 1459 John Alfray[3] | 1510-1523 | No names known [4] | |
| 1529 | William Rutter | Edward Goodwin[4] | |
| 1536 | ? | ||
| 1539 | ? | ||
| 1542 | ? | John Sackville[4] | |
| 1545 | ? | ||
| 1547 | Jasper Culpeper | John Sackville II, died and replaced by Jan 1552 by George Darrell [4] | |
| 1553 (Mar) | Sir Robert Oxenbridge | George Darrell[4] | |
| 1553 (Oct) | Sir Thomas Stradling | John Story[4] | |
| 1554 (Apr) | Richard Whalley | Anthony Stapleton[4] | |
| 1554 (Nov) | Thomas Duffield | ||
| 1555 | ?William Barnes | John Wiseman[4] | |
| 1558 | Thomas Farnham | Thomas Parker[4] | |
| 1559 | Thomas Sackville | Humphrey Llwyd[5] | |
| 1562–3 | John Sackville | Lawrence Banester[5] | |
| 1571 | John Jeffrey | Henry Berkeley[5] | |
| 1572 | Thomas Cure | Michael Heneage[5] | |
| 1584 | Thomas Cure | Francis Alford[5] | |
| 1586 | John Covert | Drew Pickesse[5] | |
| 1589 | Francis Alford | Thomas Frere[5] | |
| 1593 | Reade Stafford | John Shurley[5] | |
| 1597 | George Rivers | Richard Baker[5] | |
| 1601 | Sir Henry Compton | George Rivers[5] | |
| 1604 | Sir Henry Compton | Sir John Swynnerton | |
| 1614 | Sir Henry Compton | George Rivers | |
| 1621 | Sir Henry Compton | Thomas Pelham | |
| 1624 | Robert Heath | Thomas Caldicot | |
| 1625 | Robert Heath | Sir Henry Compton | |
| 1626 | Robert Goodwin | Sir Henry Compton | |
| 1628-1629 | Robert Goodwin | Sir Henry Compton | |
| 1629–1640 | No Parliaments summoned | ||
| 1640 (Apr) | Sir Henry Compton | Robert Goodwin | |
| 1640 (Nov) | Lord Buckhurst, disabled 1644 | Robert Goodwin | |
| 1648 | Robert Goodwin | John Baker | |
| 1653 | Not represented in Barebones Parliament | ||
| 1654 | John Goodwin | (one seat only) | |
| 1656 | John Goodwin | (one seat only) | |
| 1659 | Robert Goodwin | George Courthope | |
MPs 1660–1832 edit
- Constituency abolished (1832)
MPs 1885–1983 edit
- Constituency revived (1885)
| Election | Name | Party | Notes | |
|---|---|---|---|---|
| 1885 | George Gregory | Conservative | MP for East Sussex 1868–1885 | |
| 1886 | Alfred Gathorne-Hardy | Conservative | MP for Canterbury 1878–1880. Son of 1st Earl of Cranbrook | |
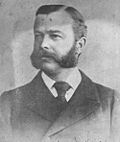
| 1895 | George Goschen | Conservative | Governor of Madras 1924–1929; 2nd Viscount Goschen 1907–1952 | |
| 1906 | Charles Corbett | Liberal | ||
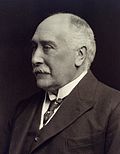
| 1910 (Jan) | Henry Cautley | Conservative | ennobled in 1936 as Baron Cautley, triggering a by-election | |
| 1936 by-election | Ralph Clarke | Conservative | ||
| 1955 | Evelyn Emmet | Conservative | Made a life peer in 1965 as Baroness Emmet of Amberley, triggering a by-election | |
| 1965 by-election | Geoffrey Johnson-Smith | Conservative | Former broadcaster. MP for Wealden 1983–2001 | |
| 1983 | Constituency abolished. See Wealden and Mid Sussex | |||
Elections edit
Elections in the 1880s edit
| Party | Candidate | Votes | % | ±% | |
|---|---|---|---|---|---|
| Conservative | George Gregory | 3,530 | 57.8 | ||
| Liberal | Charles John Heald | 2,579 | 42.2 | ||
| Majority | 951 | 15.6 | |||
| Turnout | 6,109 | 79.8 | |||
| Registered electors | 7,660 | ||||
| Conservative win (new seat) | |||||
| Party | Candidate | Votes | % | ±% | |
|---|---|---|---|---|---|
| Conservative | Alfred Gathorne-Hardy | 3,289 | 63.7 | +5.9 | |
| Liberal | Charles John Heald | 1,877 | 36.3 | -5.9 | |
| Majority | 1,412 | 27.4 | +11.8 | ||
| Turnout | 5,166 | 67.4 | −12.4 | ||
| Registered electors | 7,660 | ||||
| Conservative hold | Swing | +5.9 | |||
Elections in the 1890s edit
| Party | Candidate | Votes | % | ±% | |
|---|---|---|---|---|---|
| Conservative | Alfred Gathorne-Hardy | 3,987 | 62.9 | −0.8 | |
| Liberal | Edward George Jenkinson | 2,349 | 37.1 | +0.8 | |
| Majority | 1,638 | 25.8 | −1.6 | ||
| Turnout | 6,336 | 72.4 | +5.0 | ||
| Registered electors | 8,754 | ||||
| Conservative hold | Swing | −0.8 | |||

| Party | Candidate | Votes | % | ±% | |
|---|---|---|---|---|---|
| Conservative | George Goschen | 3,731 | 56.5 | -6.4 | |
| Liberal | Charles Corbett | 2,874 | 43.5 | +6.4 | |
| Majority | 857 | 13.0 | -12.8 | ||
| Turnout | 6,605 | 71.3 | −1.1 | ||
| Registered electors | 9,262 | ||||
| Conservative hold | Swing | -6.4 | |||
Elections in the 1900s edit
| Party | Candidate | Votes | % | ±% | |
|---|---|---|---|---|---|
| Conservative | George Goschen | 3,890 | 56.4 | −0.1 | |
| Liberal | Charles Corbett | 3,003 | 43.6 | +0.1 | |
| Majority | 887 | 12.8 | −0.2 | ||
| Turnout | 6,893 | 71.8 | +0.5 | ||
| Registered electors | 9,596 | ||||
| Conservative hold | Swing | −0.1 | |||
| Party | Candidate | Votes | % | ±% | |
|---|---|---|---|---|---|
| Liberal | Charles Corbett | 4,793 | 51.4 | +7.8 | |
| Conservative | Edgar Crookshank | 4,531 | 48.6 | -7.8 | |
| Majority | 262 | 2.8 | N/A | ||
| Turnout | 9,324 | 86.9 | +15.1 | ||
| Registered electors | 10,726 | ||||
| Liberal gain from Conservative | Swing | +7.8 | |||
Elections in the 1910s edit
| Party | Candidate | Votes | % | ±% | |
|---|---|---|---|---|---|
| Conservative | Henry Cautley | 6,563 | 64.2 | +15.6 | |
| Liberal | Charles Corbett | 3,660 | 35.8 | −15.6 | |
| Majority | 2,903 | 28.4 | N/A | ||
| Turnout | 10,223 | 88.4 | +1.5 | ||
| Registered electors | 11,562 | ||||
| Conservative gain from Liberal | Swing | +15.6 | |||
| Party | Candidate | Votes | % | ±% | |
|---|---|---|---|---|---|
| Conservative | Henry Cautley | 5,926 | 62.7 | -1.5 | |
| Liberal | Henry Norman Spalding | 3,531 | 37.3 | +1.5 | |
| Majority | 2,395 | 25.4 | -3.0 | ||
| Turnout | 9,457 | 81.8 | -6.6 | ||
| Registered electors | 11,562 | ||||
| Conservative hold | Swing | -1.5 | |||
General Election 1914–15:
Another General Election was required to take place before the end of 1915. The political parties had been making preparations for an election to take place and by July 1914, the following candidates had been selected;
- Unionist: Henry Cautley
- Liberal: Richard Arthur Austen-Leigh
| Party | Candidate | Votes | % | ±% | |
|---|---|---|---|---|---|
| Unionist | Henry Cautley | Unopposed | |||
| Unionist hold | |||||
| Party | Candidate | Votes | % | ±% | |
|---|---|---|---|---|---|
| C | Unionist | Henry Cautley | 12,584 | 67.0 | +4.3 |
| Labour | David Pole | 6,208 | 33.0 | New | |
| Majority | 6,376 | 34.0 | +8.6 | ||
| Turnout | 18,792 | 52.3 | −29.5 | ||
| Registered electors | 35,955 | ||||
| Unionist hold | Swing | +4.3 | |||
| C indicates candidate endorsed by the coalition government. | |||||
Elections in the 1920s edit
| Party | Candidate | Votes | % | ±% | |
|---|---|---|---|---|---|
| Unionist | Henry Cautley | 15,981 | 71.0 | +4.0 | |
| Labour | Thomas Crawford | 6,527 | 29.0 | −4.0 | |
| Majority | 9,454 | 42.0 | +8.0 | ||
| Turnout | 22,508 | 58.2 | +5.9 | ||
| Registered electors | 38,664 | ||||
| Unionist hold | Swing | +4.0 | |||
| Party | Candidate | Votes | % | ±% | |
|---|---|---|---|---|---|
| Unionist | Henry Cautley | 14,215 | 68.8 | −2.2 | |
| Labour | Thomas Crawford | 6,451 | 31.2 | +2.2 | |
| Majority | 7,764 | 37.6 | −4.4 | ||
| Turnout | 20,666 | 52.4 | −5.8 | ||
| Registered electors | 39,405 | ||||
| Unionist hold | Swing | −2.2 | |||
| Party | Candidate | Votes | % | ±% | |
|---|---|---|---|---|---|
| Unionist | Henry Cautley | 18,365 | 64.6 | −4.2 | |
| Liberal | Godfrey Frerichs Mowatt | 5,604 | 19.7 | New | |
| Labour | John Morgan | 4,479 | 15.7 | −15.5 | |
| Majority | 12,761 | 44.9 | +7.3 | ||
| Turnout | 28,448 | 70.2 | +17.8 | ||
| Registered electors | 40,500 | ||||
| Unionist hold | Swing | +5.7 | |||
| Party | Candidate | Votes | % | ±% | |
|---|---|---|---|---|---|
| Unionist | Henry Cautley | 21,940 | 57.9 | −6.7 | |
| Liberal | Barbara Bliss | 9,718 | 25.6 | +5.9 | |
| Labour | Thomas Crawford | 6,265 | 16.5 | +0.8 | |
| Majority | 12,222 | 32.3 | −12.6 | ||
| Turnout | 37,923 | 68.5 | −1.7 | ||
| Registered electors | 55,352 | ||||
| Unionist hold | Swing | −6.3 | |||
Elections in the 1930s edit

| Party | Candidate | Votes | % | ±% | |
|---|---|---|---|---|---|
| Conservative | Henry Cautley | 34,826 | 87.2 | +29.3 | |
| Labour | Evan Durbin | 5,121 | 12.8 | -3.7 | |
| Majority | 29,705 | 74.4 | +42.1 | ||
| Turnout | 39,947 | 69.2 | +0.7 | ||
| Conservative hold | Swing | ||||
- Liberal candidate Lewis R. Jones withdrew at the last minute.
| Party | Candidate | Votes | % | ±% | |
|---|---|---|---|---|---|
| Conservative | Henry Cautley | 29,440 | 78.4 | -8.8 | |
| Labour | Stanislaus Seuffert | 8,097 | 21.6 | +8.8 | |
| Majority | 21,343 | 56.8 | -17.6 | ||
| Turnout | 37,537 | 61.2 | -8.0 | ||
| Conservative hold | Swing | ||||
| Party | Candidate | Votes | % | ±% | |
|---|---|---|---|---|---|
| Conservative | Ralph Clarke | 22,207 | 79.6 | +1.2 | |
| Labour | Albert Edward Millett | 5,708 | 20.4 | -1.2 | |
| Majority | 16,499 | 59.2 | +2.4 | ||
| Turnout | 27,915 | 45.5 | -15.7 | ||
| Conservative hold | Swing | +1.2 | |||
General Election 1939–40: Another General Election was required to take place before the end of 1940. The political parties had been making preparations for an election to take place and by the Autumn of 1939, the following candidates had been selected;
- Conservative: Ralph Clarke
- Liberal: William Cavendish Searle[8]
Elections in the 1940s edit
| Party | Candidate | Votes | % | ±% | |
|---|---|---|---|---|---|
| Conservative | Ralph Clarke | 28,273 | 57.1 | -21.3 | |
| Labour | David George Packham | 12,519 | 25.3 | +3.7 | |
| Liberal | John Charles McLaughlin | 8,711 | 17.6 | New | |
| Majority | 15,754 | 31.8 | -25.0 | ||
| Turnout | 49,503 | 70.9 | +9.7 | ||
| Conservative hold | Swing | ||||
Elections in the 1950s edit
| Party | Candidate | Votes | % | ±% | |
|---|---|---|---|---|---|
| Conservative | Ralph Clarke | 29,786 | 55.1 | -2.0 | |
| Labour | Catherine Williamson | 12,983 | 24.0 | -1.3 | |
| Liberal | John Charles McLaughlin | 11,329 | 20.9 | +3.3 | |
| Majority | 16,803 | 31.1 | -0.7 | ||
| Turnout | 54,098 | 81.7 | +11.8 | ||
| Conservative hold | Swing | ||||
| Party | Candidate | Votes | % | ±% | |
|---|---|---|---|---|---|
| Conservative | Ralph Clarke | 32,803 | 60.3 | +5.2 | |
| Labour | Herbert Atkinson | 14,271 | 26.2 | +2.2 | |
| Liberal | John Charles McLaughlin | 7,375 | 13.5 | -7.4 | |
| Majority | 18,532 | 34.1 | +3.0 | ||
| Turnout | 54,449 | 80.3 | -1.4 | ||
| Conservative hold | Swing | ||||
| Party | Candidate | Votes | % | ±% | |
|---|---|---|---|---|---|
| Conservative | Evelyn Emmet | 28,450 | 61.5 | +1.2 | |
| Labour | Martin Mason | 11,750 | 25.4 | -0.8 | |
| Liberal | Judith St John Thornton | 6,034 | 13.1 | -0.4 | |
| Majority | 16,700 | 36.1 | +2.0 | ||
| Turnout | 46,234 | 75.1 | -5.2 | ||
| Conservative hold | Swing | ||||
| Party | Candidate | Votes | % | ±% | |
|---|---|---|---|---|---|
| Conservative | Evelyn Emmet | 31,759 | 62.3 | +0.8 | |
| Labour | Robert William G Humphreys | 10,104 | 19.8 | -5.6 | |
| Liberal | Patrick Furnell | 9,100 | 17.9 | +4.8 | |
| Majority | 21,655 | 42.5 | +6.4 | ||
| Turnout | 50,963 | 77.9 | +2.8 | ||
| Conservative hold | Swing | ||||
Elections in the 1960s edit
| Party | Candidate | Votes | % | ±% | |
|---|---|---|---|---|---|
| Conservative | Evelyn Emmet | 29,094 | 53.2 | -10.1 | |
| Liberal | Richard Holme | 14,753 | 26.7 | +8.8 | |
| Labour | William H Hill | 10,859 | 19.8 | 0.0 | |
| Majority | 14,341 | 26.5 | -16.0 | ||
| Turnout | 54,706 | 78.0 | +0.1 | ||
| Conservative hold | Swing | ||||
| Party | Candidate | Votes | % | ±% | |
|---|---|---|---|---|---|
| Conservative | Geoffrey Johnson-Smith | 24,896 | 55.0 | +1.8 | |
| Liberal | Richard Holme | 14,279 | 31.5 | +4.8 | |
| Labour | Jon Antony A Evans | 6,101 | 13.5 | -6.4 | |
| Majority | 10,617 | 23.5 | -3.0 | ||
| Turnout | 45,276 | 64.5 | -13.5 | ||
| Conservative hold | Swing | -1.4 | |||
| Party | Candidate | Votes | % | ±% | |
|---|---|---|---|---|---|
| Conservative | Geoffrey Johnson-Smith | 31,595 | 53.2 | 0.0 | |
| Liberal | James H Downie | 13,611 | 27.0 | +0.3 | |
| Labour | Arthur Harris Roberts | 11,938 | 19.8 | 0.0 | |
| Majority | 17,984 | 26.2 | -0.3 | ||
| Turnout | 57,144 | 76.8 | -1.2 | ||
| Conservative hold | Swing | ||||
Elections in the 1970s edit
| Party | Candidate | Votes | % | ±% | |
|---|---|---|---|---|---|
| Conservative | Geoffrey Johnson-Smith | 38,359 | 61.2 | +8.0 | |
| Liberal | David Carleton Bruce Smithers | 12,343 | 19.7 | -7.3 | |
| Labour | Tony Banks | 12,014 | 19.2 | -0.6 | |
| Majority | 26,016 | 41.5 | +15.3 | ||
| Turnout | 62,716 | 72.5 | -4.3 | ||
| Conservative hold | Swing | ||||
| Party | Candidate | Votes | % | ±% | |
|---|---|---|---|---|---|
| Conservative | Geoffrey Johnson-Smith | 23,928 | 53.3 | -7.9 | |
| Liberal | Peter Hasler Billenness | 15,351 | 34.2 | +14.5 | |
| Labour | William J Short | 5,629 | 12.5 | -6.7 | |
| Majority | 8,577 | 19.1 | -22.4 | ||
| Turnout | 44,908 | 81.5 | +9.0 | ||
| Conservative hold | Swing | ||||
| Party | Candidate | Votes | % | ±% | |
|---|---|---|---|---|---|
| Conservative | Geoffrey Johnson-Smith | 22,035 | 53.2 | -0.1 | |
| Liberal | Paul Hayden | 12,755 | 30.8 | -3.4 | |
| Labour | David William John Blake | 6,648 | 16.0 | +3.5 | |
| Majority | 9,280 | 22.4 | +3.3 | ||
| Turnout | 41,438 | 74.5 | -7.0 | ||
| Conservative hold | Swing | ||||
| Party | Candidate | Votes | % | ±% | |
|---|---|---|---|---|---|
| Conservative | Geoffrey Johnson-Smith | 28,279 | 62.0 | +8.8 | |
| Liberal | Jeremy Nieboer | 11,102 | 24.4 | -6.4 | |
| Labour | RJ Taylor | 6,196 | 13.6 | -2.4 | |
| Majority | 17,177 | 37.6 | +15.2 | ||
| Turnout | 45,577 | 77.1 | +2.6 | ||
| Conservative hold | Swing | ||||
References edit
- ^ a b c d e f g h i j k l m n o p "History of Parliament". History of Parliament Trust. Retrieved 20 October 2011.
- ^ "RUSSELL, Thomas II, of Chichester, Suss. | History of Parliament Online".
- ^ a b "ALFRAY, John II, of East Grinstead, Suss. | History of Parliament Online".
- ^ a b c d e f g h i "History of Parliament". History of Parliament Trust. Retrieved 20 October 2011.
- ^ a b c d e f g h i j "History of Parliament". History of Parliament Trust. Retrieved 20 October 2011.
- ^ a b c d e f g h i British parliamentary election results, 1885-1918 (Craig)
- ^ a b c d e f g h i British Parliamentary Election Results 1918-1949, FWS Craig
- ^ The Liberal Magazine, 1939
- ^ a b c d e f British parliamentary election results, 1950-1973 by FWS Craig
- ^ a b F W S Craig, British Parliamentary Election Results 1950-1973; Political Reference Publications, Glasgow 1973
- ^ a b c British parliamentary election results, 1974-1983 by FWS Craig
- Leigh Rayment's Historical List of MPs – Constituencies beginning with "E" (part 1)
- Election results, 1950 - 1979 Archived 5 May 2004 at the Wayback Machine
- Craig, F. W. S. (1989) [1974]. British parliamentary election results 1885–1918 (2nd ed.). Chichester: Parliamentary Research Services. p. 404. ISBN 0-900178-27-2.
- Craig, F. W. S. (1983) [1969]. British parliamentary election results 1918–1949 (3rd ed.). Chichester: Parliamentary Research Services. p. 481. ISBN 0-900178-06-X.
Further reading edit
- Hills, Wallace Henry (c. 1906). "The Borough of East Grinstead and its Members of Parliament". The History of East Grinstead: The rise and progress of the town and the history of its institutions & People. Farncombe. Retrieved 29 October 2010.