


Summary
The economy of Europe comprises about 748 million people in 50 countries. The formation of the European Union (EU) and in 1999 the introduction of a unified currency, the Euro, brought participating European countries closer through the convenience of a shared currency.[12] The European Union is a unique global organisation, an entity forming one of the largest economies in the world. The European Union also “regulates” the global market by the single market. The difference in wealth across Europe can be seen roughly in the former Cold War divide, with some countries breaching the divide (Greece, Portugal, Slovenia, the Czech Republic, Lithuania, Latvia and Estonia).[13] Whilst most European states have a GDP per capita higher than the world's average and are very highly developed, some European economies, despite their position over the world's average in the Human Development Index, are relatively poor. Europe has total banking assets of more than $50 trillion and its Global assets under management has more than $20 trillion.[14][15]
 The London Metropolitan Area has the largest gross domestic product in Europe[1] | |
| Statistics | |
|---|---|
| Population | 748 million[2][3] (2021) |
| GDP | |
| GDP rank | |
GDP growth | 0.3% (2023 est.)[6] |
GDP per capita | |
GDP per capita rank | |
| 6.9% (2023 est.)[9] | |
Millionaires (US$) | 16.7 million (2022)[10] |
| Public finances | |
| 75.4% of GDP (2023 est.)[11] | |
| Most numbers are from the International Monetary Fund. IMF Europe Datasets All values, unless otherwise stated, are in US dollars. | |
Throughout this article "Europe" and derivatives of the word are taken to include selected states whose territory is only partly in Europe, such as Turkey, Azerbaijan and Georgia, and states that are geographically in Asia, bordering Europe and culturally adherent to the continent, such as Armenia and Cyprus.[16]
Europe's largest national economies by nominal GDP over US$1.0 trillion are:[17]
- Germany ($4.43 trillion),
- United Kingdom ($3.33 trillion),
- France ($3.05 trillion),
- Italy ($2.19 trillion),
- Russia ($1.86 trillion),
- Spain ($1.58 trillion)
- Netherlands ($1.09 trillion)
Of the top 500 largest corporations measured by revenue (Fortune Global 500 in 2010), 184 have their headquarters in Europe. 161 are located in the EU, 15 in Switzerland, 6 in Russia, 1 in Turkey, 1 in Norway.[18]
As noted in 2010 by the Spanish sociologist Manuel Castells, the average standard of living in Western Europe is very high: "The bulk of the population in Western Europe still enjoys the highest living standards in the world, and in the world's history."[19]
Economic development edit

Pre–1945: Industrial growth edit
Prior to World War II, Europe's major financial and industrial states were the United Kingdom, France and Germany. The Industrial Revolution, which began in Britain, spread rapidly across Europe, and before long the entire continent was at a high level of industry.[20] World War I briefly led to the industries of some European states stalling, but in the run-up to World War II Europe recovered well and was competing with the ever-increasing economic might of the United States of America.[21]
However, World War II caused the destruction of most of Europe's industrial centres and much of the continent's infrastructure was laid to waste.[22]
1945–1992: The Cold War era edit
Following World War II, European governments were in tatters. Many non-Socialist European governments moved to link their economies, laying the foundation for what would become the European Union.[23] This meant a huge increase in shared infrastructure and cross-border trade. Whilst these European states rapidly improved their economies, by the 1980s, the economy of the COMECON was struggling, mainly due to the massive cost of the Cold War. The GDP and the living standards of Central and Eastern European states were lower than in other parts of Europe.[24]
The European Community grew from 6 original members following World War II, to 12 in this period.
Average living standards in Europe rose significantly during the post-war period, as characterised by these findings:[25]
Per capita private consumption (PPSs) in 1980
- Luxembourg: 5495
- France: 5395
- Germany, Federal Republic: 5319
- Belgium: 5143
- Denmark: 4802
- Netherlands: 4792
- United Kingdom: 4343
- Italy: 4288
- Ireland: 3029
Per capita personal disposable income (PPSs) in 1980
- Belgium: 6202
- France: 6044
- Germany, Federal Republic: 5661
- Netherlands: 5490
- Italy: 5378
- Denmark: 4878
- United Kingdom (UK): 4698
Rise of the European Union edit
When the 'Eastern Bloc' dissolved around 1992, these states struggled to adapt to free-market systems.[26] There was, however, a huge variation in degrees of success, with Central European states such as the Czech Republic, Hungary, Slovakia, Slovenia and Poland adapting reasonably quickly, whilst states that used to form the USSR such as Russia, Belarus and Ukraine struggled to reform their crumbling infrastructures.[27][28]
Many developed European countries were quick to develop economic ties with fellow European states, where democracy was reintroduced. After the Revolutions of 1989, states in Central Europe and the Baltic states dealt with change, former Yugoslavian republics descended into war and Russia, Ukraine and Belarus are still struggling with their old systems.
Europe's largest economy, Germany, struggled upon unification in 1991 with former communist German Democratic Republic, or East Germany, influenced by the Soviet Union. The GDR had much of its industrial infrastructure removed during the Cold War, and for many years unified Germany struggled to build infrastructure in the former East Germany up to the level of former West Germany.
Peace did not come to Yugoslavia for a decade, and by 2003, there were still many NATO and EU peacekeeping troops present in Bosnia and Herzegovina, North Macedonia, and Kosovo.[29] War severely hampered economic growth, with only Slovenia making any real progress in the 1990s.
The European economy was affected by the September 11 Attacks in the United States in 2001, with Germany, Switzerland, France, and the United Kingdom being the worst hit. But, in 2002/2003, the economy began to recover from the attacks in US.
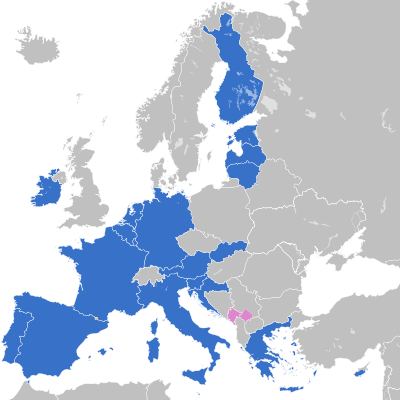
The economy of Europe was by this time dominated by the EU, a huge economic and political organization with then 15 of Europe's states as full members. EU membership was seen as something to aspire to, and the EU gave significant support and aid to those Central and Eastern European states willing to work towards achieving economies that met the entry criteria. During this time, 12 of the 15 members of the EU became part of the Eurozone, a currency union launched in 1999, whereby each member uses a shared currency, the euro, which replaced their former national currencies. Three states chose to remain outside the Eurozone and continue with their own currencies, namely Denmark, Sweden and the United Kingdom.
2004–2007: EU expansion edit
In early 2004, 10 mostly former communist states joined the EU in its biggest ever expansion, enlarging the union to 25 members, with another eight making associated trade agreements. The acceding countries are bound to join the Eurozone and adopt the common currency euro in the future. The process includes the European Exchange Rate Mechanism, of which some of these countries are already part.
Most European economies are in very good shape, and the continental economy reflects this. Conflict and unrest in some of the former Yugoslavia states and in the Caucasus states are hampering economic growth in those states, however.
In response to the massive EU growth, in 2005 the Russian-dominated Commonwealth of Independent States (CIS) created a rival trade bloc to the EU, open to any previous USSR state, (including both the European and Asian states).[30] 12 of the 15 signed up, with the three Baltic states deciding to align themselves with the EU. Despite this, the three Caucasus states have said in the past they would one day consider applying for EU membership, particularly Georgia.[31] This is also true of Ukraine since the Orange Revolution.
2008–2015: Eurozone expansion and European debt crisis edit


Slovenia became the first republic from the former Yugoslavia as well as the first formerly communist nation overall to adopt the EU currency, the euro, in 2007, followed by Malta and Cyprus in 2008, and Slovakia in 2009. In 2011, Estonia became the first republic from the former Soviet Union to adopt the euro, followed by Latvia in 2014, and Lithuania in 2015. In 2013, Croatia became the 28th member of the European Union, and adopted the euro on 1 January 2023.
In 2008, the Global Financial Crisis, triggered by the housing bubble in the United States, caused a significant decline in the GDP of the majority of the European economies, which was a precedent to a far broader and more problematic Eurozone debt crisis, which threatened the collapse of economies in the south, particularly Greece, Italy recently affected by the ongoing political crisis, Portugal and Spain. Having also been hit hard, Ireland exited the crisis in mid-2013. Meanwhile, increased bailouts of the International Monetary Fund and European Central Bank alleviated somehow the situation in the debt-stricken nations, with Central and East European economies led by Germany escaping the worst of the 2010s debt crisis.
By the mid-2010s, 2014–2015, Ireland was recovering at a steady pace having graduated from the bail out programme successfully. The Eurozone as a whole had become more stable, however problems in Greece and slow recovery in Italy and in Iberia (Spain and Portugal) continue in keeping growth in the Euro area to a minimum. Germany continues to lead Europe in stability and growth, while both the UK and Ireland are seeing strong growth of 3–4%. Unemployment in Ireland reducing at the fastest levels in Europe, expected to reach 8% by 2016, down from double that in 2011. The Czech Republic and Germany have constantly the lowest unemployment rate in the EU.[32] Growth outlook in general remains optimistic for Europe in the future. With positive growth expected across the Euro area. Although uncertainty still surrounds Greece and debt payments in the Greek state, at present things appear stable.
European businesses have been in decline against worldwide ones since the crisis. Of the 50 most valuable global firms, only seven were European as of 2015, compared to 17 in 2006. Out of 24 economic sectors, Europe only leads in one - food, which is led by Nestlé from Switzerland. Companies like HSBC, Vodafone, TotalEnergies and BNP Paribas have all also sled in their respective industries against American and Asian competitors. In addition, former technologic heavyweights like Nokia, Ericsson and Alcatel have also declined against evolving American companies in the Silicon Valley.[33]
While the bottom 80% of the European population's income has increased by an estimated 40% on average since 1980, the top 1%'s pre-tax income has more than doubled.[34] Employment in the European Union reached a new high in 2019.[34]
While many social and economic indicators have converged across EU regions, the global financial crisis resulted in a sharp divergence in unemployment rates. Recently, these ranged from less than 2% in Prague to more than 20% in parts of Greece, southern Spain, and southern Italy. Rapid technological change also had an effect on medium-skilled workers resulting in more low-skilled jobs being taken up.[34]
2016–present: Brexit, COVID pandemic and Russian invasion of Ukraine edit
In 2016, the United Kingdom became the first nation to vote to leave the European Union since its modern iteration in the post-Cold War era, reducing the number of the said bloc's membership down to 27 member states for the time being. U.K.'s exit prolonged the country's ongoing economic recession beyond the COVID pandemic era in the 2020s decade. In 2022, the Russian war on Ukraine prompted both Ukraine and Moldova to be granted immediate candidate status by the European Union for economic and security reasons, with Bosnia and Herzegovina and Georgia following suit by the end of the following year. Croatia recently became the newest member of the Eurozone after officially adopting the euro as its currency in the beginning of 2023, while Finland and Sweden became the newest members of the NATO the following year.
Regional variation edit
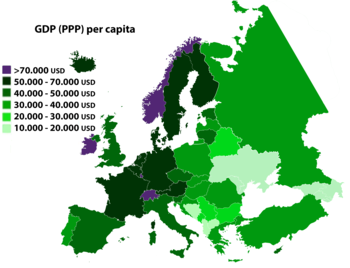

European countries with a long history of trade, a free market system, and a high level of development in the previous century are generally in the north and west of the continent. They tend to be wealthier and more stable than countries congregated in the European East and South, even though the gap is converging, especially in Central and Eastern Europe, due to higher growth rates.
The poorest states are those that just emerged from communism, fascist dictatorships and civil wars, namely those of the former Soviet Union and Yugoslavia, with some exceptions. Former Western Bloc itself presents some living standards and development differences, with the greatest contrast seen between the Nordics (Norway, Denmark, Sweden, Finland) and Greece, Portugal, Spain and Italy.
Below is a map of European countries by gross national income per capita.[35] High income in blue ($12,616 or more, as defined by the World Bank), upper middle income in green ($4,086 – $12,615) and lower middle income ($1,036 – $4,085) in yellow.
The predicted impact of the COVID-19 pandemic on GDP is greatest in Southern Europe, where structural improvements are expected to enhance GDP levels by up to 5% by 2030, with the effect decreasing to 2.5% by 2040. The effect is projected to be a little less than 1% in Western Europe and Northern Europe, with cross-border spillover effects from the rest of Europe accounting for half of the predicted impact.[36]
A survey conducted in 2021 found that many businesses cut back on operations as a result of the COVID-19 epidemic, resulting in a significant decline in revenue and job changes. Due to the pandemic, over 40% of the businesses surveyed had to close temporarily. Sales in the region declined by roughly 25% on average, but there was substantial variation within sub-regions.[37][38]
One out of every five businesses launched or grew their online business or distribution of products and services, while one out of every four businesses started or increased their remote operations.[37][39][40][41]
The pandemic has also hastened corporate transformation, with over 30% of companies altering or transforming their output as a result of it. Chemical manufacturers and wholesalers were the first to respond, with one in three expanding online business activity, beginning or boosting delivery of products and services, increasing remote employment, and changing manufacturing.[37][42]
Economic activity decreased by almost 4% in the majority of sub-regions in 2020, which was similar to the global average of 3.2%. However, the variance between nations is prominent. The high infection and mortality rates of the pandemic in countries in the Western Balkans, the Eastern Neighbourhood, and Central and Eastern Europe meant they faced deeper recessions.[37][43]
European Union edit
The European Union has the second largest economy in the world, behind that of the United States.[44] Trade within the Union accounts for more than one-third of the world total.
The European Union or EU is a supranational union of 27 European states, the most recent acceding member being Croatia, which became full member on 1 July 2013. It has many functions, the most important being the establishment and maintenance of a common single market, consisting of a customs union, a single currency (adopted by 18 of the 27 member states[45]), a Common Agricultural Policy and a Common Fisheries Policy. The European Union also undertakes various initiatives to co-ordinate activities of the member states.
The union has evolved over time from a primarily economic union to an increasingly political one. This trend is highlighted by the increasing number of policy areas that fall within EU competence: political power has tended to shift upwards from the Member States to the EU.
European Free Trade Association edit
The European Free Trade Association (EFTA) was established on 3 May 1960 as an alternative for European states that did not wish to join the European Union, creating a trade bloc with fewer central powers.
The EFTA member states as of 1992 were Austria, Denmark, Finland, Iceland, Liechtenstein, Norway, Sweden and Switzerland. In 2014 only four countries, Iceland, Norway, Switzerland and Liechtenstein, remained members of EFTA, as the other members have gradually left to join the EU.
European Economic Area edit
The European Economic Area (EEA) came into being on 1 January 1994 following an agreement between the European Free Trade Association (EFTA) and the European Union (EU). It was designed to enable EFTA countries to participate in the European Single Market without having to join the EU.
In a referendum, Switzerland (ever keen on neutrality) chose not to participate in the EEA (although it is linked to the European Union by bilateral agreements similar in content to the EEA agreement), so the current members are the EU states plus Norway, Iceland and Liechtenstein.
A Joint Committee consisting of the non EU members plus the European Commission (representing the EU) has the function of extending relevant EU Law to the non EU members.
Commonwealth of Independent States edit
The Commonwealth of Independent States (CIS) is a confederation consisting of 9 of the 15 states of the former Soviet Union, (the exceptions being the three Baltic states, Georgia, Turkmenistan, and Ukraine (Turkmenistan and Ukraine are participating states in the CIS)). Although the CIS has few supranational powers, it is more than a purely symbolic organization and possesses co-ordinating powers in the realm of trade, finance, lawmaking and security. It 2012 the Commonwealth of Independent States Free Trade Area was established.
Central European Free Trade Agreement edit
The Central European Free Trade Agreement (CEFTA) is a trade bloc of: Albania, Bosnia and Herzegovina, North Macedonia, Moldova, Montenegro, Serbia and the United Nations Interim Administration Mission in Kosovo (UNMIK) on behalf of Kosovo.
Currency and central banks edit
European Central Bank edit
Non-Eurozone currencies edit
Stock exchanges edit
Economic sectors edit
Agriculture and fishing edit
Europe's agricultural sector is in general highly developed and also has the lowest percentage of the population working in agriculture of any continent.[48] The process of improving Central Europe's agriculture is ongoing and is helped by the accession of Central European states to the EU. The agricultural sector in Europe is helped by the Common Agricultural Policy (CAP), which provides farmers with a minimal price for their products and subsidizes their exports, which increases competitiveness for their products. This policy is highly controversial as it hampers free trade worldwide (protectionism sparks protectionism from other countries and trade blocs: the concept of trade wars) and is violating the concept of fair trade.
This means because of the protectionist nature of the CAP, agricultural products from developing countries are rendered uncompetitive in both Europe (an important export market for developing countries) and on their home markets (as European agricultural products are dumped on developing countries' markets with help from European agricultural subsidies). This controversy surrounds every system of agricultural subsidies (the United States' policy of subsidizing farmers is also controversial). The CAP is also controversial because 40% of the EU's budget is spent on it, and because of the overproduction caused by it.
The Common Fisheries Policy is surrounded by an extensive system of rules (mainly consisting of quotas) to protect the environment from overfishing. Despite these rules, the cod is becoming increasingly rare in the North Sea resulting in drastic shortages in countries such as Canada and the United Kingdom. Strict fishing rules are the main reason for Norway and Iceland to stay out of the European Union (and out of the Common Fisheries Policy). Price guarantees and subsidizations of fishermen are implemented in the same way as agricultural subsidies are. Bluefin tuna is also a problem. Global stocks of the species are overfished with extinction in the wild a possibility in the near future. This also has the negative effect of threatening their traditional, natural predators.
Manufacturing edit
Europe has a thriving manufacturing sector, with a large part of the world's industrial production taking place in Europe. Most of the continent's industries are concentrated in the 'Blue Banana' (covering Southern England, the Benelux, western Germany, eastern France, Switzerland, and northern Italy). However, because of the higher wage level and hence production costs, Europe is suffering from deindustrialization and offshoring in the labour-intensive manufacturing sectors. This means that manufacturing has become less important and that jobs are moved to regions with cheaper labour costs (mainly China and Central and Eastern Europe).
Central Europe (Berlin, Saxony, the Czech Republic and Little Poland) was largely industrialised by 1850[49] but Eastern Europe (European Russia) begun industrialisation between 1890–1900 and intensified it during the communist regime (as the USSR), but it suffered from contraction in the 1990s when the inefficient heavy-industry-based manufacturing sector was crippled after the collapse of communism and the introduction of the market economy.
In the 21st century the manufacturing sector in Central and Eastern Europe picked up because of the accession of ten formerly Communist European states to the EU and their resulting accession to the European Common Market. This caused firms within the European Union to move jobs from their manufacturing sector to Central European countries such as Poland (see above), which sparked both Central and Eastern European industrial growth and employment.
According to Fortune Global 500, 195 of the top 500 companies are headquartered in Europe.[50] The main products in European industry are automobiles, bicycles, rail, machinery, marine, aerospace equipment, food, chemical and pharmaceutical goods, software and electronics.
Investing and banking edit
Europe has a well-developed financial sector. Many European cities are financial centres with London being the largest.[51][52][53] The financial sector of the Eurozone is helped by the introduction of the euro as common currency. This has made it easier for European households and firms to invest in companies and deposit money in banks in other European countries. Exchange rate fluctuations are now non-existent in the Eurozone. The financial sector in Central and Eastern Europe is helped by economic growth in the region, European Regional Development Fund and the commitment of Central and Eastern European governments to achieve high standards.
According to the Global Financial Centres Index, as of 19 September 2019[update], four European cities rank among the 20 largest financial centres in the world: London (2nd), Zurich (14th), Frankfurt (15th), and Paris (17th).[54]
European banks are amongst the largest and most profitable in the world, such as HSBC, BNP Paribas, Crédit Agricole, Grupo Santander, Société Générale, Barclays, Groupe BPCE, Deutsche Bank, Intesa Sanpaolo, Lloyds Banking Group, ING Group, Crédit Mutuel, UBS and UniCredit.
At the start of the COVID-19 pandemic in the economy, aggregate investment levels fell in the second quarter of 2020. The corporate sector was the most responsible for this reduction. Investment appeared to be increasing in early 2021, coinciding with the relaxation of COVID-19 restrictions.[55][36]
30% of EU firms reported in the European Investment Bank's Investment Survey 2021 that they adjusted their investment expectations to fit the COVID-19 pandemic. This is reported as more than the US where the positive revision of investment plans was more common, with 25% of firms reporting.[36] 72% of EU enterprises state that the COVID-19 pandemic will have a long-term influence on investment requirements and priorities.[56][36]
Businesses in Europe received governmental support following the economic crisis. Governments ensured that enterprises had access to financing, with some governments covering labour expenses so that people could remain employed. This initiative targeted enterprises experiencing the greatest revenue loss, and the companies who got assistance were more likely to stick to their investment goals.[36][57]
Mid-2021, the European Union's gross saving rate was still 18% of gross disposable income, higher above the average of 11-13%, prior to the COVID-19 pandemic.[58][36][59]
63% of large firms, 61% of infrastructure firms and 58% of firms in the service sector are the largest share expecting long term effects of COVID-19.[36][60]

Across the European Union, the most commonly mentioned investment barrier is the lack of trained labor. 75% of businesses in transitional regions found this to be problematic. In less developed and non-cohesion regions, it is 79%. Demographics and rising demand for skills that are less common on the market, such as those needed to support digitalization activities, might contribute to the lack of competent workers.[61]
Companies that are located in the countries under the European cohesion policy are less likely to spend money on the types of intangible assets, like R&D or training. Businesses in cohesion regions tend to concentrate their investments more on purchasing real estate, machinery, and other tangible assets.[62][63] Only 28% of investments are made in intangible activity in areas considered less developed, compared to 35% in transition areas and 39% in more developed areas.[62][64]
In all regions, bank loans are the most prevalent type of external financing. In less developed regions, they account for 49% of finance, in more developed regions, 58%, and in transitional regions, 69%. Grants make up a larger portion of the financing in less developed areas.[62][65]
Intangible assets (R&D, software, training, and business processes) were invested in by firms in Central, Eastern and Southeastern Europe countries at a lower rate (24%) in 2022 than the EU average (37%). The proportion of enterprises aiming to prioritize innovation in new goods and services was higher in these regions (27%) than in the EU (24%) and the US (21%).[66][67] Manufacturing enterprises (36%) and big firms (31%), in particular, have innovation as an investment priority. Among CESEE enterprises, Slovenia (38%) and the Czech Republic (37%), are the most likely to prioritize innovation.[66] Over half of businesses (57%) altered their operations in response to COVID-19. The majority (44%), produced new items (26%), while a minority (16%) reduced their supply chain.[66] 39% of EU enterprises created or introduced new goods, processes, or services in the previous fiscal year, compared to 57% of US firms. In both the EU and the US, little more than 12% of enterprises introduced ideas that were novel to the country or the global market.[68][69][70]
Europe's level of productive investment has lagged behind that of the United States - by two percentage points of GDP annually since 2010, according to European Commission data.[71] In comparison to 2021, there is a significant increase in the proportion of enterprises citing energy prices as a limitation to investment (87%), particularly those considering it as a substantial obstacle (63%).[66] The transition to cleaner energy is seen as a danger to investments by 41% of energy-intensive manufacturers in Europe, thus affecting all investment plans. This is compared to 31% of enterprises in non-energy heavy industries.[72] For future investment plans, European energy-intensive manufacturers and firms are more interested in climate investments than non-energy-intensive enterprises, with 48% now investing and 57% planning to invest.[72]
Productive investment, as of 2023 (excluding housing), has been increasing as a percentage of GDP in Europe. There remains a gap of around 1.5 percentage points in productive investment between Europe and the United States, but this growth has helped Europe keep up with the rate of productive investment growth in the United States to a certain extent. Although Europe is not falling further behind like during the sovereign debt crisis, European firms state narrowing this gap as a priority. [73]
Infrastructure enterprises were somewhat more likely than other firms to invest insufficiently in 2022 according to survey data. The same was true for SMEs (21%) against large businesses (15%). Firms in Lithuania (28%) and Latvia (30%) are the most likely to believe they have invested insufficiently during the previous three years. The proportion of enterprises that believe they have overinvested was largest (but still minor) in Hungary (7%), Bulgaria (7%), and the Czech Republic (6%).[66]
Most companies in Central, Eastern and Southeastern Europe (59%), and the rest of the EU (57%) projected their revenues to be greater in 2022 than they were in 2019. COVID-19 has had a negative impact on 45% of the enterprises in those regions. Almost one-third of those surveyed (13% of total enterprises) did not anticipate a recovery, whereas the vast majority did. Even throughout the pandemic, 41% of enterprises observed an increase in revenue, and the majority of them predicted stronger sales in 2022.[66]
Long-term hurdles to corporate investment continue to be energy prices, uncertainty, and a shortage of skills, with 83%, 78%, and 81% of enterprises citing these concerns as restraints, respectively. EU enterprises were more likely than US firms to cite energy prices as a key impediment.[68][74] In 2022 - 2023, EU businesses were found increasingly unhappy with the cost of credit as monetary policy tightened and external finance conditions deteriorated. This dissatisfaction is at more than 14% in 2023, compared to 5% in 2022.[68][75]
In 2023, Austrian enterprises are the most likely to grow stock and inventory, while Romanian firms are the most likely to invest in digital inventory and input tracking.[68] Romania has the largest proportion of importers lowering the proportion of goods/services imported from abroad, as well as the highest proportion of enterprises diversifying or growing the number of countries from which they import.[68][76] Also in the same year, 80% of EU firms were profitable, which was 2 percentage points higher than the historical average. Firms that achieved profits of at least 10% of their turnover were 8% more likely to increase their investment compared to firms that only broke even. Policy support and financial reserves have played a crucial role in protecting and maintaining corporate investment. Despite the energy crisis that started in 2022, firms were able to meet their investment expectations, thanks to the support and buffers in place.[77]
Credit demand in the Central, Eastern and Southern European regions remained strong in the first six months of 2023, although it has been steadily declining since 2021-22. Fixed investments and retail components, particularly the housing sector, contributed adversely, while credit demand was once again driven by corporate liquidity requirements (particularly for inventories and working capital).[78] In the previous six months, most parent banks in Central, Eastern, and South-Eastern Europe nations have maintained their level of exposure. Major players in Serbia and Romania engaged in some mergers and acquisitions activities. Banks foresee an increase in non-performing loans (NPLs), which would hit the retail and business sectors in virtually all countries (excluding Albania).[79]
According to data from a European survey, big mid-caps account for the greatest percentage of high-growth and very high-growth enterprises, at 7.5% and 3.1%, respectively, followed by SMEs at 6% and 2%. XLs and tiny mid-caps trail somewhat, accounting for 5.2-5.5% and 1.9-2.1% of high- and very-high-growth enterprises, respectively. Manufacturing businesses with big mid-caps and XL firms have the greatest percentage of extremely high-growth firms.[80][81]
Europe in particular suffers from a lack of funding for more mature scale-up operations. Financing for these operations is six to eight times higher in the United States (in dollars).[82] Corporate investment among EU countries varies significantly due to distinct national factors. The sectoral breakdown of aggregate investment is not yet accessible for all EU members, even for early 2023. In some European nations, real corporate investment increased by 5% or more by early 2023, while in others it remained stagnant or far lower than pre-pandemic levels.[83] In 2023, enterprises with profits of at least 10% of turnover were 8 percentage points more likely to increase investment than enterprises that broke even.[84] A main point in 2023 has been that EU enterprises embraced modern digital technology and were able to close an 11 point deficit with the United States in their usage of those technology. [85]
Transport edit
Transport in Europe provides for the movement needs of over 700 million people[86] and associated freight. The political geography of Europe divides the continent into over 50 sovereign states and territories. This fragmentation, along with increased movement of people since the industrial revolution, has led to a high level of cooperation between European countries in developing and maintaining transport networks. Supranational and intergovernmental organisations such as the European Union (EU), Council of Europe and the Organization for Security and Co-operation in Europe have led to the development of international standards and agreements that allow people and freight to cross the borders of Europe, largely with unique levels of freedom and ease.
Rail transport edit
Rail networks in Western and Central Europe are often well maintained and well developed, whilst Eastern, Northern and Southern Europe often have less coverage and/or infrastructure problems. Electrified railway networks operate at a plethora of different voltages AC and DC varying from 750 to 25,000 volts, and signalling systems vary from country to country, hindering cross-border traffic. EU rail subsidies amounted to €73 billion in 2005.[87]
Air transport edit
Despite an extensive road and rail network, most long-distance travel within Europe is by air. A large tourism industry also attracts many visitors to Europe, most of whom arrive into one of Europe's many large international airports. London is the second busiest airport in the world by number of international passengers, only trailing Dubai.[88] The advent of low cost carriers in recent years has led to a large increase in air travel within Europe. Air transportation is now often the cheapest way of travelling between cities. This increase in air travel has led to problems of airspace overcrowding and environmental concerns. The Single European Sky is one initiative aimed at solving these problems.[89]
Global trade relations edit
The bulk of the EU's external trade is done with China, Mercosur and the United States,[90] Japan, Russia and non-member European states.
EU members are represented by a single official at the WTO.
The EU is involved in a few minor trade disputes. It had a long running dispute with the USA of allegedly unfair subsidies the US government gives to several companies, such as Boeing. The EU has a long running ban prohibiting arms trade with the Chinese. The EU issued a brief accusing Microsoft of predatory and monopolistic practices.
See also edit
- Free trade areas in Europe
- Golden Banana
- Cryptocurrencies in Europe
- Culture of Europe
- List of companies of the European Union
- List of largest European companies by revenue
- Regions of Europe
Statistics edit
- International organisations in Europe
- List of European countries by budget revenues
- List of European countries by budget revenues per capita
- List of European countries by GDP (nominal)
- List of European countries by GDP (PPP)
- List of European countries by GDP (nominal) per capita
- List of European countries by GDP (PPP) per capita
- List of European countries by GNI (nominal) per capita
- List of European countries by GNI (PPP) per capita
- List of sovereign states in Europe by minimum wage
Notes edit
- ^ a b c d Monaco, San Marino, Vatican City State, and Andorra have concluded monetary agreements with the EU, granting them the rights to produce limited quantities of euro coins with their own design on the national side, but not to issue euro banknotes. Kosovo and Montenegro also use the euro however they have no agreements with the EU.[46]
- ^ British Crown Dependencies of Guernsey, Isle of Man, Jersey and a British Overseas Territory of Gibraltar are the other Pound Sterling users in Europe. All four issue local versions of the Pound Sterling which are pegged with GBP.
References edit
- ^ Dimitropoulou, Alexandra (20 August 2023). "The world's wealthiest 300 cities, 2023". CEOWORLD magazine. Retrieved 23 October 2023.
- ^ "World Population Prospects 2022". United Nations Department of Economic and Social Affairs, Population Division. Retrieved 17 July 2022.
- ^ "World Population Prospects 2022: Demographic indicators by region, subregion and country, annually for 1950-2100" (XSLX) ("Total Population, as of 1 July (thousands)"). United Nations Department of Economic and Social Affairs, Population Division. Retrieved 17 July 2022.
- ^ "GDP (Nominal), current prices". International Monetary Fund. Retrieved 5 November 2022.
- ^ "GDP (PPP), current prices". International Monetary Fund. Retrieved 5 November 2022.
- ^ International Monetary Fund (2022). "Real GDP growth". IMF Data Mapper. International Monetary Fund. Retrieved 5 November 2022.
- ^ International Monetary Fund (2022). "Nominal GDP per capita". IMF Data Mapper. International Monetary Fund. Retrieved 5 November 2022.
- ^ International Monetary Fund (2022). "GDP PPP per capita". IMF Data Mapper. International Monetary Fund. Retrieved 5 November 2022.
- ^ International Monetary Fund (2022). "Inflation rate, average consumer prices". IMF Data Mapper. International Monetary Fund. Retrieved 5 November 2022.
- ^ Shorrocks, Anthony; Davies, James; Lluberas, Rodrigo (2022). Global Wealth Databook 2022 (PDF). Credit Suisse Research Institute.
- ^ International Monetary Fund (2022). "General government gross debt". IMF Data Mapper. International Monetary Fund. Retrieved 5 November 2022.
- ^ "The euro: the birth of a new currency". European Central Bank. 21 May 1999. Retrieved 12 February 2023.
- ^ "The ABC of EU law". op.europa.eu. Retrieved 12 February 2023.
- ^ "• Europe: bank assets | Statista".
- ^ "• Assets under management in Europe 2020 | Statista".
- ^ Desai, Seiju (1 September 2005). "Turkey in the European Union: A Security Perspective – Risk or Opportunity?". Defence Studies. 5 (3): 366–393. doi:10.1080/14702430500492807. ISSN 1470-2436. S2CID 154726691.
- ^ "World Economic Outlook Database, October 2023". IMF.org. International Monetary Fund. 10 October 2023. Retrieved 14 October 2023.
- ^ "Global 500 2010: Countries – Australia". Fortune. Retrieved 8 July 2010. Number of companies data taken from the "Pick a country" box.
- ^ Castells, Manuel (26 January 2010). End of Millennium. John Wiley & Sons. ISBN 9781444323443.
- ^ "Industrial Revolution | Definition, History, Dates, Summary, & Facts | Britannica". www.britannica.com. Retrieved 12 February 2023.
- ^ "United States - World War II | Britannica". www.britannica.com. Retrieved 12 February 2023.
- ^ "History of Europe - The blast of World War II | Britannica". www.britannica.com. Retrieved 12 February 2023.
- ^ "Chapter 3: What is the European Union | CES at UNC". Retrieved 12 February 2023.
- ^ "Comecon | international organization | Britannica". www.britannica.com. Retrieved 12 February 2023.
- ^ Responses to poverty: lessons from Europe by Robert Walker, Roger Lawson, and Peter Townsend
- ^ Duch, Raymond M. (1993). "Tolerating Economic Reform: Popular Support for Transition to a Free Market in the Former Soviet Union". The American Political Science Review. 87 (3): 590–608. doi:10.2307/2938738. ISSN 0003-0554. JSTOR 2938738. S2CID 144487069.
- ^ Åslund, Andres; Boone, Peter; Johnson, Simon; Fischer, Stanley; Ickes, Barry W. (1996). "How to Stabilize: Lessons from Post-Communist Countries". Brookings Papers on Economic Activity. 1996 (1): 217–313. doi:10.2307/2534649. ISSN 0007-2303. JSTOR 2534649.
- ^ "Member States of Central European Free Trade Agreement". www.imf.org. Retrieved 12 February 2023.
- ^ NATO. "Operations and missions: past and present". NATO. Retrieved 12 February 2023.
- ^ Nuriyev, Elkhan (2015). "Russia, the EU and the South Caucasus: Forging an Efficient Over-Arching Cooperative Regional Security Scheme". Connections. 14 (2): 51–64. doi:10.11610/Connections.14.2.04. ISSN 1812-1098. JSTOR 26326397.
- ^ Oddo, Paola Lo Bue (28 March 2019). "The EU or Russia? Interests and ties in the South Caucasus". The New Federalist. Retrieved 1 April 2019.
- ^ "Unemployment statistics". ec.europa.eu. Eurostat. Retrieved 29 April 2016.
- ^ "From clout to rout". The Economist. 30 June 2016. Retrieved 4 April 2018.
- ^ a b c Bank, European Investment (18 March 2021). On Inequality (Big Ideas). European Investment Bank. ISBN 978-92-861-4935-1.
- ^ GNI (nominal) per capita 2012, World Development Indicators database [1], World Bank, revised 12 Aug 2013, Atlas method
- ^ a b c d e f g Bank, European Investment (12 January 2022). EIB Investment Report 2021/2022: Recovery as a springboard for change. European Investment Bank. ISBN 978-92-861-5155-2.
- ^ a b c d Bank, European Investment (18 May 2022). Business resilience in the pandemic and beyond: Adaptation, innovation, financing and climate action from Eastern Europe to Central Asia. European Investment Bank. ISBN 978-92-861-5086-9.
- ^ Anderton, Robert; Botelho, Vasco; Consolo, Agostino; Da Silva, António Dias; Foroni, Claudia; Mohr, Matthias; Vivian, Lara (6 January 2021). "The impact of the COVID-19 pandemic on the euro area labour market".
{{cite journal}}: Cite journal requires|journal=(help) - ^ "How companies can make remote working a success | McKinsey". www.mckinsey.com. Retrieved 19 July 2022.
- ^ "How B2B sales have changed during COVID-19 | McKinsey". www.mckinsey.com. Retrieved 19 July 2022.
- ^ "E-commerce in the time of COVID-19". OECD. Retrieved 19 July 2022.
- ^ "Resilience during the COVID-19 Pandemic: Perspectives from Somalia's Businesses". blogs.worldbank.org. 5 May 2022. Retrieved 19 July 2022.
- ^ "New EIB-EBRD-WB Enterprise Survey: Are companies in the Western Balkans prepared for another crisis?". European Investment Bank. Retrieved 19 July 2022.
- ^ "Comparing United States and European Union by Economy - StatisticsTimes.com". statisticstimes.com. Retrieved 31 October 2021.
- ^ "EUROPA – The euro". europa.eu. 5 July 2016.
- ^ "The euro outside the euro area". economy-finance.ec.europa.eu.
- ^ a b c d e f g "ABOUT US". Nasdaq. Retrieved 19 February 2024.
- ^ World Food and Agriculture – Statistical Yearbook 2023 | FAO | Food and Agriculture Organization of the United Nations. 2023. doi:10.4060/cc8166en. ISBN 978-92-5-138262-2. Retrieved 13 December 2023.
{{cite book}}:|website=ignored (help) - ^ "Industrialization Map - 1850". mbbnet.umn.edu. Retrieved 4 April 2018.
- ^ "PDF-Human Rights Policies and Management Practices: Results from questionnaire surveys of Governments and Fortune Global 500 firms" (PDF). Retrieved 6 March 2008.
- ^ Europe Economics (6 July 2011). "The value of Europe's international financial centres to the EU economy". City of London and TheCityUK. Archived from the original on 25 May 2015. Retrieved 23 May 2015.
- ^ "Brexit: the United-Kingdom and EU financial services" (PDF). Economic Governance Support Unit of the European Parliament. 9 December 2016. Retrieved 2 March 2018.
- ^ "The Bank of England's approach to the authorisation and supervision of international banks, insurers and central counterparties". Bank of England. Retrieved 2 March 2018.
The UK's financial sector also brings substantial benefits to EU households and firms, allowing them to access a broad range of services efficiently and reliably. UK-located banks underwrite around half of the debt and equity issued by EU companies. UK-located banks are counterparty to over half of the over-the-counter (OTC) interest rate derivatives traded by EU companies and banks. As many as 30 million EEA policyholders are insured through a UK-based insurer. Central counterparties (CCPs) located in the United Kingdom provide services to EU clients in a range of markets. UK-located asset managers account for 37% of all assets managed in Europe.
- ^ "The Global Financial Centres Index 26" (PDF). Long Finance. September 2019. Retrieved 3 October 2019.
- ^ "New EIB study: How do EU and US firms perceive and invest in climate change?". Science|Business. Retrieved 31 January 2022.
- ^ "JRC Publications Repository". publications.jrc.ec.europa.eu. 23 June 2021. Retrieved 9 February 2022.
- ^ "Covid-19: how the EU can help small businesses | News | European Parliament". www.europarl.europa.eu. 14 January 2021. Retrieved 31 January 2022.
- ^ "From savings to spending: Fast track to recovery". European Stability Mechanism. 29 July 2021. Retrieved 14 February 2022.
- ^ "First release for the third quarter of 2021".
- ^ "Impacts of the COVID-19 pandemic on EU industries" (PDF).
- ^ "Green, Digital, Inclusive and Fair: How can Cohesion Policy Rise to the New Territorial Challenges?". RSA Europe. Retrieved 16 August 2022.
- ^ a b c "Regional Cohesion in Europe 2021-2022". EIB.org. Retrieved 9 August 2022.
- ^ "Home". www.oecd-ilibrary.org. Retrieved 9 August 2022.
- ^ "My Region, My Europe, Our Future - European Commission" (PDF). European Commission.
- ^ "European Small Business Finance Outlook" (PDF). EIF.
- ^ a b c d e f Bank, European Investment (11 January 2023). EIB Investment Survey 2022 - CESEE overview. European Investment Bank. ISBN 978-92-861-5435-5.
- ^ Peter Bauer, Aurélien Genty. "INDUSTRIAL PERFORMANCE AND INVESTMENTS IN INTANGIBLE ASSETS DURING CRISES" (PDF).
- ^ a b c d e Bank, European Investment (12 October 2023). EIB Investment Survey 2023 - European Union overview. European Investment Bank. ISBN 978-92-861-5609-0.
- ^ "Press corner". European Commission - European Commission. Retrieved 23 October 2023.
- ^ "Long-term competitiveness of the EU: looking beyond 2030" (PDF).
- ^ "European investment offensive needed to keep up with US subsidies". European Investment Bank. Retrieved 28 February 2023.
- ^ a b Bank, European Investment (12 April 2023). What drives firms' investment in climate change? Evidence from the 2022-2023 EIB Investment Survey. European Investment Bank. ISBN 978-92-861-5537-6.
- ^ Bank, European Investment (7 February 2024). EIB Investment Report 2023/2024 - Key Findings. European Investment Bank. ISBN 978-92-861-5741-7.
- ^ PricewaterhouseCoopers. "Six key challenges for financial institutions to deal with ESG risks". PwC. Retrieved 23 October 2023.
- ^ Bank, European Central (7 June 2023). "Survey on the Access to Finance of Enterprises: strong tightening in perceived financing conditions amid continued rise in turnover".
{{cite journal}}: Cite journal requires|journal=(help) - ^ "International trade in goods for the EU - an overview". ec.europa.eu. Retrieved 15 November 2023.
- ^ Bank, European Investment (7 February 2024). EIB Investment Report 2023/2024 - Key Findings. European Investment Bank. ISBN 978-92-861-5741-7.
- ^ Bank, European Investment (6 December 2023). Central, Eastern and South-Eastern Europe (CESEE) Bank Lending Survey: Second half of 2023. European Investment Bank. ISBN 978-92-861-5622-9.
- ^ Bank, European Investment (6 December 2023). Central, Eastern and South-Eastern Europe (CESEE) Bank Lending Survey: Second half of 2023. European Investment Bank. ISBN 978-92-861-5622-9.
- ^ Bank, European Investment (10 January 2024). Hidden champions, missed opportunities: Mid-caps’ crucial role in Europe’s economic transition. European Investment Bank. ISBN 978-92-861-5731-8.
- ^ "Annual Report on European SMEs 2022/2023" (PDF).
- ^ "EIB Investment Report: Transforming for competitiveness". European Investment Bank. Retrieved 12 February 2024.
- ^ Bank, European Investment (7 February 2024). EIB Investment Report 2023/2024 - Key Findings. European Investment Bank. ISBN 978-92-861-5741-7.
- ^ "Plastic pollution is growing relentlessly as waste management and recycling fall short, says OECD". www.oecd.org. Retrieved 23 February 2023.
- ^ "Plastic pollution is growing relentlessly as waste management and recycling fall short, says OECD". www.oecd.org. Retrieved 23 February 2023.
- ^ "World Population Prospects: The 2008 Revision". United Nations Department of Economic and Social Affairs. 11 March 2009. Archived from the original on 12 October 2009. Retrieved 18 February 2010.
- ^ "EU Technical Report 2007".
- ^ "World's busiest airports announced". cnn.com. 4 April 2016. Retrieved 4 April 2018.
- ^ "The Single Europe Sky". European Organisation for the Safety of Air Navigation. 13 January 2009. Archived from the original on 29 July 2012. Retrieved 18 February 2010.
- ^ As regards the EU-China trade relations, see Paolo Farah (2006) Five Years of China's WTO Membership. EU and US Perspectives on China's Compliance with Transparency Commitments and the Transitional Review Mechanism, Legal Issues of Economic Integration, Kluwer Law International, Volume 33, Number 3, pp. 263–304.
External links edit
 Media related to Economy of Europe at Wikimedia Commons