


Summary
The economy of New Zealand is a highly developed free-market economy.[23] It is the 52nd-largest national economy in the world when measured by nominal gross domestic product (GDP) and the 62nd-largest in the world when measured by purchasing power parity (PPP). New Zealand has one of the most globalised economies and depends greatly on international trade, mainly with China, Australia, the European Union, the United States, and Japan. New Zealand's 1983 Closer Economic Relations agreement with Australia means that the economy aligns closely with that of Australia.
 Auckland's central business district at night | |
| Currency | New Zealand dollar (NZD, NZ$) |
|---|---|
| 1 July – 30 June[1] | |
Trade organisations | APEC, CPTPP, WTO and OECD |
Country group | |
| Statistics | |
| Population | 5,223,100 (June 2023 estimate)[4] |
| GDP | |
| GDP rank | |
GDP growth | |
GDP per capita | |
GDP by sector |
|
Population below poverty line | 11.0% (relative, 2014)[9] |
| 33.9 medium (2019)[10] | |
| |
Labour force | |
Labour force by occupation |
|
| Unemployment | |
Average gross salary | NZ$5,882 / $3,456 monthly[14] (2022) |
| NZ$4,698 / $2,759 monthly[15][16] (2022) | |
Main industries | Food processing, Agriculture, Forestry, Wool, Tourism, Financial Services |
| External | |
| Exports | $72.8 billion (FY 2022/23)[17] |
Export goods | Dairy products, meat, logs and wood products, fruit, wine, machinery and equipment, fish and seafood |
Main export partners |
|
| Imports | $88.8 billion (FY 2022/23)[17] |
Import goods | Petroleum, vehicles, machinery and equipment, electronics, textiles, plastics |
Main import partners |
|
FDI stock | |
Gross external debt | NZ$156.181 billion (53% of GDP) (December 2018)[18] NZ$86.342 billion (30.5% of GDP) (Feb 2018)[19] |
| Public finances | |
| +1.6% (of GDP) (2017 est.)[13] | |
| Revenues | 74.11 billion (2017 est.)[13] |
| Expenses | 70.97 billion (2017 est.)[13] |
| Economic aid | As donor: $99.7 million (FY99/00) |

New Zealand's diverse economy is made up of various types of informal and formal organisations, divided between two sectors, public and private. It has a sizeable service sector, accounting for 63% of all GDP activity as of 2013[update].[24] As a large island nation New Zealand has abundant natural resources and mineral wealth.[25] Prominent manufacturing industries include aluminium production, food processing, metal fabrication, wood and paper products. Mining, manufacturing, electricity, gas, water, and waste services accounted for 16.5% of GDP as of 2013[update].[24] The primary sector continues to dominate New Zealand's exports, despite accounting for only 6.5% of GDP as of 2013[update].[24] The information technology sector is growing rapidly.[26]
The major capital market is the New Zealand Exchange (NZX). As of February 2023[update], NZX had a total of 338 listed securities, equity, debt and funds with a combined market capitalisation of NZD $226 billion.[27] New Zealand's currency, the New Zealand dollar (informally known as the "Kiwi dollar"), also circulates in four Pacific Island territories. The New Zealand dollar is the 10th-most traded currency in the world.[28]
History edit

For many years New Zealand's economy was built on a narrow range of agricultural products, such as wool, meat and dairy. These products became New Zealand's staple and most valuable exports, underpinning the success of the economy, from the 1850s until the 1970s.[29] For example, from 1920 to the late 1930s, the dairy export quota was usually around 35% of New Zealand's total exports, and in some years made up almost 45%.[30] Due to the high demand for these primary products, manifested by the New Zealand wool boom of 1951, New Zealand had one of the highest standards of living in the world for 70 years.[31]
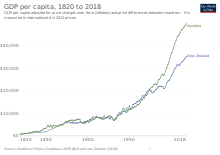
In the 1960s, prices for these traditional exports declined, and in 1973 New Zealand lost its preferential trading position with the United Kingdom when the latter joined the European Economic Community. Partly as a result, from 1970 to 1990, the relative New Zealand GDP per capita adjusted for purchasing power declined from about 115% of the OECD average to 80%.[32]
Between 1984 and 1993, New Zealand changed from a somewhat closed and centrally controlled economy to one of the most open economies in the OECD.[33] In a process often referred to in New Zealand as Rogernomics, successive governments introduced policies which dramatically liberalised the economy.
In 2005, the World Bank praised New Zealand as the most business-friendly country in the world.[34][35] The economy diversified and by 2008, tourism had become the single biggest generator of foreign exchange.[36]
Early years edit
Prior to European settlement and colonisation of New Zealand, Māori had a subsistence economy, the basic economic unit of which was the sub-tribe or hapū.[37] From the 1790s, the waters around New Zealand were visited by British, French and American whaling, sealing and trading ships. Their crews traded European goods, including guns and metal tools, for Māori food, water, wood, flax and sex.[38] Their increasing lawlessness and plans for formal settlement by the New Zealand Company were two of the drivers behind the signing of the Treaty of Waitangi in 1840, which established New Zealand as a colony. Settlers continued to be dependent on Māori for food until the 1860s.[37][38] From then immigrants became self-sufficient in farming, and started quarrying a variety of minerals including gold, which was discovered at Gabriel's Gully in Central Otago, leading to the Otago Gold Rush in 1861. Settlements flourished in areas where these quarries were established. In the 1880s, Dunedin became the richest city in the country largely on the back of investments from the gold rush.[39]
Sheep farming began in the Wairarapa but soon spread up and down the east coast from Southland to the East Cape once rudimentary roads and transport became available. Much of the land used for farming was taken or leased from Māori. Sheep numbers grew quickly and by the mid-1850s, there were already a million sheep in New Zealand; by the early 1870s, there were 10 million.[29] Wool became the first staple export, initially exported from the Wellington settlement in the late 1850s, although unrefrigerated meat and dairy products were exported as far as Australia.[29]
In the 1870s, Julius Vogel was periodically both colonial treasurer and premier. He viewed New Zealand as a "Britain of the South Seas"[40] and began the development of infrastructure in New Zealand investing heavily in roads, railways, telegraphs and bridges funded by public borrowing.[41] Progress slowed after the collapse of the City of Glasgow Bank in 1878 which led to a contraction in credit from London, the centre of the world's financial system at the time. Economic activity was depressed for some years afterwards, until refrigeration was introduced in 1882.[31] This enabled New Zealand to start exporting meat and other frozen products to the United Kingdom. Refrigeration transformed and shaped the development of the economy but, in the process, established New Zealand's economic dependence on Britain.
The success of refrigeration was directly related to the growth and development of farming in the country. In the 19th century, the bulk of economic activity was in the South Island of New Zealand. From around 1900, dairy farming became increasingly viable in areas which were less suitable for sheep, particularly in Northland, the Waikato and Taranaki. As dairying developed, the North Island slowly became more important to the economy.[42] Britain led on to be the sole market for meat and animal products in New Zealand, owing to the increase in its land cultivation and farming. The dairy farming can therefore be seen as a response to the powerful market demands in Europe, transforming not only New Zealand's countryside, economy and production techniques, but also causing migration in order to create the needed supply of dairy farming.[43]
20th century edit
The Reserve Bank of New Zealand was established as New Zealand's central bank on 1 August 1934. Up until that time New Zealand's monetary policy had been set in the United Kingdom, and the New Zealand Pound was issued by private banks. A separate central bank gave New Zealand's government control of monetary policy for the first time,[44] although New Zealand remained part of the sterling area by pegging its pound to the British pound sterling until the introduction of the New Zealand dollar in 1967, after which the dollar was instead pegged to the United States dollar.[45]
By the mid-20th century, pastoral-farming products made up more than 90% of New Zealand's exports,[42] 65% of which was going to Britain in the 1950s. Having a secure market with guaranteed prices also enabled New Zealand to impose high tariffs on imported goods from other countries. Tough import controls gave local manufacturers the ability to produce similar products locally, broaden the base of jobs available in New Zealand and still compete against higher priced imports.
This prosperity continued up to 1955 at which point Britain stopped giving New Zealand guaranteed prices for its exports.[46] From then on, what New Zealand received was dictated by the free market. As a result, during the 1950s and 1960s the country's standard of living began to slip as the export sector was no longer able to pay for the level of imported goods required to meet the country's growing consumerism.
Britain applied to join the European Economic Community (EEC) in 1961, but was vetoed by the French. The government of Keith Holyoake reacted by attempting to diversify New Zealand's export markets, signing the first free trade agreement (Australia New Zealand Free Trade Agreement) in 1965,[47] and opening new diplomatic posts in Hong Kong, Jakarta, Saigon, Los Angeles and San Francisco.[30] Britain applied again to join the EEC in 1967, and entered into negotiations for membership in 1970. Holyoake's deputy and successor, Jack Marshall, (briefly Prime Minister in 1972) negotiated continued access for New Zealand exports to the United Kingdom under the so-called "Luxembourg Agreement".[48]
Britain gained full membership of the EEC on 1 January 1973, and all trade agreements with New Zealand came to an end, except the Luxembourg Agreement.[48] By the end of that year, only 26.8% of New Zealand's exports were to Britain.[49] This had a significant effect on the standard of living. In 1953, New Zealand had the third highest standard in the world. By 1978, it had dropped to 22nd place.[46]
Having lost unrestricted access to its traditional market, New Zealand continued to search for alternative export markets and diversify its economy. The Government of Norman Kirk, who succeeded Marshall, put greater emphasis on expanding New Zealand's trade, especially with South East Asia. Following the Yom Kippur War in October 1973, an oil embargo was put in place by the Middle Eastern oil exporters, leading to the 1973 oil crisis. This compounded New Zealand's dire economic situation further. Inflation greatly increased as the cost of transport and imported goods soared, causing standards of living to decline.[50]
Think Big edit
Following the 1979 energy crisis resulting from the Iranian Revolution of that year, Robert Muldoon, the prime minister between 1975 and 1984, instituted an economic strategy known as Think Big. Large scale industrial plants were established based on New Zealand's abundant natural gas. A new range of products for export such as ammonia, urea fertilizer, methanol and petrol were produced and with greater use of electricity (with the electrification of the North Island Main Trunk railway) with the goal that this would reduce New Zealand's dependence on oil imports.[36]
Other projects included the Clyde Dam on the Clutha River, which was built to meet a growing demand for electricity, and the expansion of the New Zealand Steel plant at Glenbrook.[51]
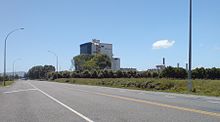
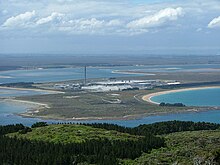
The Tiwai Point Aluminium Smelter, which opened in 1971, was also upgraded as part of the Think Big strategy and now brings in approximately NZ$1 billion in exports every year.[52]
Unfortunately for New Zealand, most of these projects only came on line at the same time as oil prices dropped during the 1980s oil glut. The price of crude went from more than US$90 a barrel in 1980, to about US$30 a few years later. Because these Think Big projects required massive borrowing to get started, public debt soared from $4.2 billion in 1975 when Muldoon became prime minister to $21.9 billion when he left office nine years later. Inflation remained rampant, averaging 11% in the 1980s.[50] Once Labour came to power in 1984, many of these projects were sold to private industry as part of a wider sale of state-assets.[51]
The Muldoon Government did make some moves towards deregulation however. For example, in 1982 it removed the transport licensing restrictions on road carriers carting goods more than 150 km, and turned the Railways Department into a statutory corporation.
Rogernomics edit
Between 1984 and 1993, New Zealand underwent radical economic reform, moving from what had probably been the most protected, regulated and state-dominated system of any capitalist democracy to an extreme position at the open, competitive, free-market end of the spectrum.[53]
The Fourth Labour government, elected in July 1984, moved away from government intervention in the economy and allowed free market mechanisms to dominate. These reforms became known as "Rogernomics", named after minister of finance from 1984 to 1988, Roger Douglas. The changes included making the Reserve Bank independent of political decisions; performance contracts for senior civil servants; public sector finance reform based on accrual accounting; tax neutrality; subsidy-free agriculture; and industry-neutral competition regulation. Government subsidies including agricultural subsidies were eliminated; import regulations were loosened up; the exchange rate was floated; and controls on interest rates, wages, and prices were removed; and personal rates of taxation were reduced. Tight monetary policy and major efforts to reduce the government budget deficit brought the inflation rate down from an annual rate of more than 18% in 1987. The deregulation of government-owned enterprises in the 1980s and 1990s reduced government's role in the economy and permitted the retirement of some public debt.

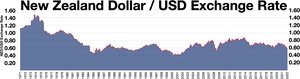
The new Government was faced with an exchange rate crisis the day after it was elected. Speculators expected the change of government to result in a 20% devaluation of the New Zealand dollar, which led to the 1984 New Zealand constitutional crisis due to Muldoon's refusal to devalue, worsening the currency crisis further. As a result, the dollar was floated on 4 March 1985, allowing for the value of the dollar to change with the market.[54] Prior to the dollar being floated, the dollar was pegged against a basket of currencies.[54]
Financial markets were deregulated and tariffs on imported goods lowered and phased out. At the same time subsidies to many industries, notably agriculture, were removed or significantly reduced. Income and company taxes were reduced and the top marginal tax rate was reduced from 66% to 33%. These were replaced by a comprehensive tax on goods and services (GST) initially set at 10%, then increased to 12.5% in 1989 and to 15% in 2010. A surtax on universal superannuation was also introduced.[38] Many government departments were corporatised, and from 1 April 1987 became State owned enterprises, required to make a profit. The new corporations shed thousands of jobs adding to unemployment; Electricity Corporation 3,000; Coal Corporation 4,000; Forestry Corporation 5,000; New Zealand Post 8,000.[55]
The wage and price freeze of the early eighties coupled with the removal of financial restrictions and a lack of investment opportunities, led to a speculative bubble on New Zealand's sharemarket, sharemarket crash of 1987, in which New Zealand's sharemarket shed 60% from its 1987 peak, and taking several years to recover.[56][57]
Inflation continued to be a major problem afflicting the New Zealand economy. Between 1985 and 1992, inflation averaged 9% per year and the economy was in recession.[58] The unemployment rate rose from 3.6% to 11%,[59] New Zealand's credit rating dropped twice, and foreign debt quadrupled.[58] In 1989 the Reserve Bank Act 1989 was passed, creating strict monetary policy under the sole control of the Reserve Bank Governor. From then on the Reserve Bank focused on keeping inflation low and stable, using the Official Cash Rate (OCR) – the price of borrowing money in New Zealand – as its primary means to do so. As a result, inflation rates fell to an average of 2.5% in the 1990s, compared to 12% in the 1970s.[50] However, the tightening of monetary policy contributed to rising unemployment in the early 1990s.[60]
The Labour Party was greatly divided over Rogernomics, especially following the 1987 sharemarket crash and its effect on the economy, which slumped along with the rest of the world into recession in the early 1990s. The National Party was returned to power at the 1990 general election and Ruth Richardson became minister of finance under Prime Minister Jim Bolger. The new Government was again thrown a major economic challenge, with the then state-owned Bank of New Zealand needing a bail-out to stay operational.
Richardson's first budget in 1991, nicknamed the 'Mother of all Budgets',[61] attempted to address constant fiscal deficits and borrowing by cutting state spending. Unemployment and social welfare benefits were cut and 'market rents' were introduced for state houses – in some cases tripling the rents of low-income people.[62] Richardson also introduced user-pays requirements in hospitals and schools.[61] These reforms became known derisively as Ruthanasia.
By this time, New Zealand's economy faced serious social problems; the number of New Zealanders estimated to be living in poverty grew by at least 35% between 1989 and 1992;[58] many of the promised economic benefits of the experiment never materialised.[63] Gross domestic product per capita stagnated between 1986–87 and 1993–94, and by March 1992 unemployment rose to 11.1%[64] Between 1985 and 1992, New Zealand's economy grew by 4.7% during the same period in which the average OECD nation grew by 28.2%.[65] From 1984 to 1993 inflation averaged 9% per year, New Zealand's credit rating dropped twice, and foreign debt quadrupled.[58] Between 1986 and 1993, the unemployment rate rose from 3.6% to 11%.[66]

Deregulation also created a business-friendly regulatory framework which has benefited those able to take advantage of it. A 2008 survey in The Heritage Foundation and The Wall Street Journal ranked New Zealand 99.9% in "Business freedom", and 80% overall in "Economic freedom", noting that it takes, on average, only 12 days to establish a business in New Zealand, compared with a worldwide average of 43 days.[67]
Deregulation has also been blamed for other significant negative effects. One of these was the leaky homes crisis, whereby the loosening up of building standards (in the expectation that market forces would assure quality) led to many thousands of severely deficient buildings, mostly residential homes and apartments, being constructed over a period of a decade. The costs of fixing the damage has been estimated at over NZ$11 billion (as at 2009[update]).[68]
21st century edit

Unemployment continued to fall from 1993 to 1994 fiscal year, until the onset of the 1997 Asian financial crisis again pushed the rate higher.[69] By 2016 the unemployment rate decreased to 5.3 percent, the lowest level in 7 years.[70]
Between 2000 and 2007, the New Zealand economy expanded by an average of 3.5% a year driven primarily by private consumption and the buoyant housing market. During this period, inflation averaged only 2.6% a year, within the Reserve Bank's target range of 1% to 3%.[71] However, in early 2008 the economy entered recession, before the effects of the global financial crisis (GFC) set in later that year. A drought over the 2007/08 summer led to lower production of dairy products in the first half of 2008. Domestic activity slowed sharply over 2008 as high fuel and food prices dampened domestic consumption, while high interest rates and falling house prices drove a rapid decline in residential investment.[71]
Around the world instability was developing in the finance sector. This reached a peak in September 2008 when Lehman Brothers, a major American bank, collapsed propelling the world into the global financial crisis.[72]
Finance company collapses (2006–2012) edit

Inverted yield curve in 1994–1998 and 2004–2008
Uncertainty began to dominate the global financial and economic environment. Business and consumer confidence in New Zealand plummeted as dozens of finance companies collapsed.[73] To try and stop a flight of funds from New Zealand institutions to those in Australia, the Government established the Crown Retail Deposit Guarantee Scheme to cover depositors funds in the event that a bank or finance company went broke.[74] This protected some investors but nevertheless, at least 67 finance companies collapsed within a short period of time.[75] The largest of these was South Canterbury Finance which cost taxpayers NZ$1.58 billion when the company collapsed in August 2010.[76] The directors of many of these finance companies were subsequently investigated for fraud and some high-profile directors went to prison.[77][78][79][80][81]
In an attempt to stimulate the economy, the Reserve Bank lowered the Official Cash Rate (OCR) from a high of 8.25% (July 2008) to an all-time low of 2.5% at the end of April 2009.[71]
Fortunately for New Zealand, the recession was relatively shallow compared to many other nations in the OECD, it was sixth least affected out of the 34 member nations with negative real GDP growth totaling 3.5%.[71] In 2009 the economy picked up, led by strong demand from major trading partners Australia and China, and historically high prices for New Zealand's dairy and log exports. In 2010 the GDP grew by a modest 1.6%, but over the next couple of years economic activity continued to improve, driven by the rebuild in Canterbury after the Christchurch earthquakes and recovery in domestic demand.[71] Through 2011, global conditions deteriorated and the terms of trade eased off their 2011 peak, continuing to moderate until September 2012. Since then, commodity prices have rebounded strongly, with strong demand from China and the international situation improving. Commodity prices have been at record highs in recent quarters and remain elevated. High commodity prices are expected to provide a considerable boost to nominal GDP growth in the near term.[71]
"Rock star" economy edit
In 2013, the economy grew 3.3%. HSBC chief economist for Australia and New Zealand, Paul Bloxham, was so impressed that he predicted New Zealand's growth would outpace most of its peers, and he described New Zealand as the "rock star economy of 2014".[82] Another financial commentator said the New Zealand dollar was the "hottest" currency of 2014.[83] Only three months later, the New Zealand Productivity Commission expressed concern about low living standards and problems affecting the long-term drivers of growth. Paul Conway, Director of Economics and Research at the Productivity Commission, wrote: "New Zealand's broad policy settings should generate GDP per capita 20 per cent above the OECD average, but the actual result is more than 20 per cent below average. We may be punching above our weight, but that's only because we are in the wrong weight division!"[84] In August, Bloxham admitted that "the sharp decline in dairy prices over the last six months has clouded the outlook somewhat".[85] In December however Bloxham stated that he thought the New Zealand economy would continue to grow strongly.[86]
In 2014 increased attention was paid to the growing gap between rich and poor. In The Guardian, Max Rashbrook said policies implemented by both Labour and National governments have increased inequality. He claims that for twenty years outrage "has been muted", but "Alarm bells are finally beginning to sound. Recent polling shows three-quarters of New Zealanders think theirs is no longer an egalitarian country".[87]
2020–22 recession edit
New Zealand recorded its first case of COVID-19 on 28 February 2020. In response to the pandemic, the country closed its borders to everyone except New Zealand citizens and residents on 19 March, and went into full (Level 4) lockdown from 26 March to 27 April, followed by a partial (Level 3) lockdown from 28 April to 13 May.
The border closure combined with the lockdowns saw the retail, accommodation, hospitality, and transport sectors experiencing major declines. On 17 September 2020, New Zealand officially entered a recession, with the country's gross domestic product retracting by 12.2% in the June quarter.[88][89][90] The GDP rebounded 14% in the September quarter to leave a 2.2% year-on-year retraction.[91]
After successfully containing the virus, the New Zealand economy had sharp growth in what is known as a V-shaped recovery and ended the year with an overall economic expansion of 0.4%, better than the predicted 1.7% contraction.[92] Unemployment also dropped to 4.9% in December 2020, down from a peak Covid effected rate of 5.3% in September.[93]
By 23 September 2021, the Restaurant Association's Chief executive Marisa Bidois estimated that about 1,000 hospitality businesses nationwide had been forced to close as a result of the COVID-19 pandemic, leading to the loss of 13,000 jobs. In response, the Association lobbied the Government for Government for continued wage subsidies and incentives to boost customer rates.[94] On 13 November 2021, the Bay of Plenty Times reported that 26,774 companies had been liquidated during the first eight months of 2021.[95]
On 27 January 2022, New Zealand's inflation rate hit a 30-year record high of 5.9% at the end of 2021. According to figures released by Statistics New Zealand, the rising cost of construction, petrol and rents pushed the consumer price index up 1.4 per cent between October and December 2021. Statistics NZ also recorded a two percent increase in household utilities expenses, which was fuelled by the rising costs of new dwellings (which rose by 16% from 2020) and a 30 percent hike in fuel prices (from NZ $1.87 per litre to $2.45 per litre). Prime Minister Jacinda Ardern attributed the sharp inflation rate to rising crude oil prices overseas. By contrast, the opposition National Party leader Christopher Luxon and Finance spokesperson Simon Bridges attributed rising inflation to the Government's alleged "wasteful" spending.[96]
On 1 February 2022, an annual report released by the Organisation of Economic Cooperation and Development (OECD) identified the country's border restrictions and declining house prices as the main risks facing New Zealand's economy that year. While the OECD report credited New Zealand's elimination strategy and macroeconomic stimuli such as wage and socio-economic subsidies with helping the economy to bounce back to pre-COVID-19 levels, it also warned that excessive Government spending was causing the economy to overheat and substantial increases in household and government debt. The OECD welcomed the Reserve Bank's decision to raise interest rates but also urged the Government to raise the superannuation age, eliminate obstacles to building houses, and reduce government spending. The OECD also supported the introduction of a social insurance scheme for unemployed workers.[97]
Overview edit
In 2015 the Social Progress Index, which covers such areas as basic human needs, foundations of well-being, and the level of opportunity available to citizens, ranked the New Zealand economy fifth.[98] However, the outlook includes some challenges. New Zealand income levels, which used to be above those of many countries in Western Europe prior to the crisis of the 1970s, dropped in relative terms and never recovered. As a result, the number of New Zealanders living in poverty has grown and income inequality has increased dramatically.
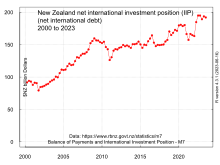
New Zealand has also had persistent current-account deficits since the early 1970s, peaking at −7.8% of GDP in 2006 but falling to −2.6% of GDP in FY 2014.[99] The CIA World Fact Book estimates New Zealand's 2017 public debt (that owed by the government) at 31.7% of GDP.[100] Between 1984 and 2006, net external foreign debt increased 11-fold, to NZ$182 billion.[34] As of 2018[update] gross core crown debt was NZ$84,524 million or 29.5% of GDP and net core crown debt was NZ$62,114 million or 21.7% of GDP.[19]

Despite New Zealand's persistent current-account deficits, the balance on external goods and services has generally been positive. In FY 2014, export receipts exceeded imports by NZ$3.9 billion.[99] There has been an investment income imbalance or net outflow for debt-servicing of external loans. In FY 2014, New Zealand's investment income from the rest of the world was NZ$7 billion, versus outgoings of NZ$16.3 billion, a deficit of NZ$9.3 billion.[99] The proportion of the current-account deficit that is attributable to the investment income imbalance (a net outflow to the Australian-owned banking sector) grew from one third in 1997 to roughly 70% in 2008.[101]
Taxation edit
At the national level the Inland Revenue Department (IRD) collects tax in New Zealand on behalf of the New Zealand Government. New Zealanders pay national taxes on personal and business income, and on the supply of goods and services (GST). There is no capital-gains tax, although certain "gains" such as profits on the sale of patent rights are deemed to be income. Income tax does apply to property transactions in certain circumstances, particularly speculation. Local authorities manage and collect local property taxes (rates). Some goods and services carry a specific tax, referred to as an excise or a duty such as alcohol excise or gaming duty. These are collected by a range of government agencies such as the New Zealand Customs Service. There is no social security (payroll) tax or land tax in New Zealand.
The 2010 New Zealand budget announced cuts to personal tax-rates, with the top personal tax-rate reduced from 38% to 33%[102] The cuts gave New Zealand the second-lowest personal tax burden in the OECD. Only Mexico's citizens retained a higher percentage-wise "take home" proportion of their salaries.[103]
The cuts in income tax were estimated to reduce revenue by $2.46 billion.[104] To compensate, the National government raised GST from 12.5% to 15%.[105] Treasury figures show that top income-earners in New Zealand pay between 6% and 8% of their income on GST. Those at the bottom end, earning less than $356 a week, spend between 11% and 14% on GST. Based on these figures, The New Zealand Herald predicted that putting GST up to 15% would increase living costs for the poor more than twice as much as for the rich.[106]
Corruption edit
New Zealand ranked 1st on the Transparency International Corruption Perceptions Index (CPI) of 2017 with a score of 89 out of 100.[107] In 2018 New Zealand ranked 2nd on the Corruption Perceptions Index with a score of 87 out of 100.[108] In 2019, New Zealand ranked 1st on the Corruption Perceptions Index with a score of 87 out of 100.[109] Although New Zealand is one of the least corrupt countries in the world, corruption still exists in New Zealand.[110]
Regional economies edit

In March 2024, Statistics New Zealand published details of the break-down of gross domestic product in the regions of New Zealand for the year ended March 2023:[111]
| Region (map reference) | GDP, 2022 (NZ$ million) | Share of national GDP | GDP per capita, 2022 (NZ$) | GDP growth, 2021–22 |
|---|---|---|---|---|
| Northland (1) | 10,061 | 2.6% | 49,710 | |
| Auckland (2) | 148,732 | 38.2% | 86,734 | |
| Waikato (3) | 34,613 | 8.9% | 67,028 | |
| Bay of Plenty (4) | 22,581 | 5.8% | 64,462 | |
| Gisborne (5) | 2,665 | 0.7% | 50,955 | |
| Hawke's Bay (6) | 11,385 | 2.9% | 61,977 | |
| Taranaki (7) | 10,241 | 2.6% | 80,072 | |
| Manawatū-Whanganui (8) | 15,289 | 3.9% | 59,010 | |
| Wellington (9) | 47,465 | 12.2% | 86,805 | |
| North Island | 303,033 | 77.9% | 76,645 | |
| Tasman / Nelson (10 / 11)[* 1] | 7,100 | 1.8% | 62,277 | |
| Marlborough (12) | 3,947 | 1.0% | 76,049 | |
| West Coast (13) | 2,095 | 0.5% | 63,876 | |
| Canterbury (14)[* 2] | 47,944 | 12.3% | 72,620 | |
| Otago (15) | 16,755 | 4.3% | 66,700 | |
| Southland (16) | 8,271 | 2.1% | 80,148 | |
| South Island | 86,112 | 22.1% | 70,973 | |
| New Zealand | 389,145 | 100.0% | 75,311 |
- ^ Nelson and Tasman are combined by Statistics New Zealand, but are separate regions.
- ^ Includes the Chatham Islands.
Unemployment edit
Prior to the economic shock created by Britain's decision to join the EEC in 1973, which removed the UK as New Zealand's primary market for exports,[112] unemployment in New Zealand was very low. A recession and a collapse in wool prices in 1966 led to unemployment rising by 131%, but still represented only a 0.7% percentage point increase in the unemployment rate.[113]
After 1973, unemployment became a persistent economic and social issue in New Zealand. Recessions from 1976 to 1978 and from 1982 to 1983 greatly increased unemployment again.[113] Between 1985 and 2012 the unemployment rate averaged 6.29%. After the stock market crash of 1987, unemployment rose 170%[113] reaching an all-time high of 11.20% in September 1991.[114] The Asian financial crisis of 1997 sent unemployment upwards again, by 28%.[113] By 2007 it had dropped again and the rate stood at 3.5% (December 2007), its lowest level since the current method of surveying began in 1986. This gave the country the 5th-best ranking in the OECD (with an OECD average at the time of 5.5%). The low numbers correlated with a robust economy and a large backlog of job positions at all levels.[115] Unemployment numbers are not always directly comparable between OECD nations, as members do not all keep labour market statistics in the same way.
The percentage of the population employed has also increased in recent years, to 68.8% of all inhabitants,[when?] with full-time jobs increasing slightly, and part-time occupations decreasing in turn. The increase in the working population percentage is attributed[by whom?] to increasing wages and higher costs of living moving more people into employment.[115][failed verification] The low unemployment also had some disadvantages, with many companies unable to fill jobs.
From December 2007, mainly as a result of the global financial crisis, unemployment numbers began to rise. This trend continued until September 2012, reaching a high of 6.7%. They began to recover after that point, sitting at 3.9% as of June 2019[update].[116]
Housing affordability edit
Shamubeel Eaqub, formerly a principal economist at the New Zealand Institute of Economic Research (NZIER), said in 2014 that thirty years prior, an average house in New Zealand cost two or three times the average household income. House prices rose dramatically in the first years of the 21st century and by 2007, an average house cost more than six times household income.[117] International surveys in 2013 showed that housing was unaffordable in all eight of New Zealand's major markets – "unaffordable" being defined as house prices which are more than three times the median regional income.[118]
Demand for property has been strongest in Auckland. In 2014 the average sales price there went from $619,136 to $696,047, a rise of 12% in that 12-month period alone.[119] In 2015, prices rose another 14%.[120] This made Auckland New Zealand's least affordable market and one of the most expensive cities in the world[121] with houses costing 8 times the average income.[118] Between 2012 and April 2016, the average Auckland home increased in price by just over two-thirds reaching $931,000 – higher than the cost of an average home in Sydney.[122]
As a result, more people are being priced out of the property market. Those on low incomes are hardest hit, affecting many Maori and Pasifika. New Zealand's relatively high mortgage-rates are exacerbating the problem[123] making it difficult for young people with steady jobs to buy their first home.[124] According to a 2012 submission made to the Housing Affordability Inquiry,[125] escalating house prices are also impacting on many middle income groups, especially those with large families.[126] Mortgage adviser Bruce Patten said the trend was "disturbing" and added to the gap between the "haves and have-nots".[127]
Property-analysis company CoreLogic said[when?] that 45% of house purchases in New Zealand are now made by investors who already own a home, while another 28% are made by people moving from one property to another. Approximately 8% of purchases go to overseas-based cash buyers[117] – primarily Australians, Chinese, and British – although most[quantify] economists believe that foreign investment is currently[when?] too small to have a significant effect on property prices.[128]
Whether purchases are made by New Zealanders or by foreigners, it is generally those who are already well off who are buying the bulk of properties on the market. This has had a dramatic effect on home-ownership rates by Kiwis, now[when?] at its lowest level since 1951. Even as recently as 1991, 76% of New Zealand homes were occupied by their owners. By 2013, this had reduced to 63%,[129] indicating that more and more people are having to rent.[citation needed] Raewyn Cox, chief executive of the Federation of Family Budgeting, says: "High prices and high interest rates (have) sentenced a rising number of New Zealanders to be lifetime tenants" where they are "stuck in expensive rental situations, heading towards retirement."[123]
Inequality edit

Between 1982 and 2011 New Zealand's gross domestic product grew by 35%. Almost half of that increase went to a small group who were already the richest in the country. During this period, the average income of the top 10% of earners in New Zealand (those earning more than $72,000)[130] almost doubled going from $56,300 to $100,200. The average income of the poorest tenth increased by 13% from $9700 to $11,000.[131]
Statistics New Zealand, which keeps track of income disparity using the P80/20 ratio, confirms the increase in income inequality. The ratio shows the difference between high household incomes (those in the 80th percentile) and low household incomes (those in the 20th percentile). The inequality ratio increased between 1988 and 2004, and decreased until the onset of the Global Financial Crisis in 2008, increasing again to 2011 and then declining again from then. By 2013 the disposable income of high-income households was more than two-and-a-half times larger than that of low-income households.[132] Highlighting the disparity, the top 1% of the population now[when?] owns 16% of the country's wealth[citation needed] – the richest at one point 5% owned 38%[133] – while half the population, including beneficiaries and pensioners, earn less than $24,000.[130]
Superannuation edit
New Zealand has a universal superannuation scheme. Only people who are aged 65 years old or over, is a New Zealand citizen or permanent resident and who is residing in New Zealand at the time of application is eligible. They must also have lived in New Zealand for at least 10 years since they turned 20 with five of those years being since they turned 50. Time spent overseas in certain countries and for certain reasons may be counted for New Zealand superannuation. New Zealand superannuation is taxed, the rate of which depends on superannuitants' other income. The amount of superannuation paid depends on the person's household situation. For a married couple the net tax amount is set by legislation to be no less than 66% of net average wage.[134]
Because of the growing number of elderly becoming eligible, superannuation costs rose from $7.3 billion a year in 2008 to $10.2 billion in 2014.[135] In 2011 there were twice as many children in New Zealand as elderly (65 and over); by 2051 there are projected to be 60% more elderly than children. In the ten years from 2014, the number of New Zealanders over the age of 65 was projected to grow by about 200,000.[136]
This poses a significant problem for superannuation. The government gradually increased the age of eligibility from 61 to 65 between 1993 and 2001.[137] In that year the Labour Government of Helen Clark introduced the New Zealand Superannuation Fund (known as the "Cullen Fund" after Minister of Finance Michael Cullen) to part-fund the superannuation scheme into the future. As at October 2014, the fund managed NZ$27.11 billion, 15.9% of which it invested within New Zealand.[138]
In 2007 the same Government introduced a new individual saving-scheme, known as KiwiSaver. KiwiSaver principally targets growing people's retirement savings, but younger participants can also use it to save a deposit for their first home. The scheme is voluntary, work-based and managed by private-sector companies called "KiwiSaver providers". As of 2014[update] KiwiSaver had 2.3 million active members (60.9% of New Zealand's population under 65). NZ$4 billion was contributed annually, and a total of NZ$19.1 billion has been contributed since 2007.[139]
Consumption edit
New Zealanders see themselves as first-world consumers with first-world tastes and habits - mitigated only slightly by the country's remoteness from main global producers.
Infrastructure edit
According to the National Infrastructure Unit of the Treasury, New Zealand "...continues to face challenges to its infrastructure; all forms of infrastructure are long-term investments, and change does not come about easily or quickly."[140] A report prepared for the Association of Consulting and Engineering New Zealand in 2020 claimed that there was an infrastructure deficit of $75 billion (about one quarter of GDP), following decades of under-investment that began in the 1980s.[141]
Transport edit
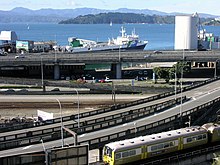
New Zealand's transport infrastructure is "generally well developed."[142]
Road network edit
The New Zealand state highway network consists of 11,000 km of road, with 5981.3 km in the North Island and 4924.4 km in the South Island, built and maintained by the NZ Transport Agency, and paid for from general taxation and fuel excise duty. Heavy road users must pay Road User Charges as well, there is limited use of tolling on state highways. There is also 83,000 km of local roads built and maintained by local authorities.[143]
Railway network edit
The railway network is owned by state-owned enterprise KiwiRail and consists of 3,898 km of railway line, built to the narrow gauge of 1,067 mm (3 ft 6 in).[142] Of this, 506 km is electrified.[144]
Airways edit
There are seven international airports and twenty-eight domestic airports.[142] Air New Zealand, 52% government-owned,[145] is the national carrier and a state owned enterprise. Airways New Zealand, another state owned enterprise, provides air traffic control and communications.
Seaports edit
New Zealand has 14 international seaports.[142]
Telecommunications edit
Present-day telecommunications in New Zealand include telephony, radio, television, and internet usage. A competitive telecommunications market has seen mobile prices drop to some of the lowest in the OECD.[146] The copper wire and fibre cable networks are mostly owned by Chorus Limited, a publicly listed company. Chorus wholesales services to retail providers (such as Spark). In the mobile sector, there are three operators: Spark, One NZ and 2degrees.
Internet edit
New Zealand has a high rate of internet use. As of October 2014[update], there are 1,916,000 broadband connections and 65,000 dial-up connections in New Zealand, of which 1,595,000 are residential and 386,000 are business or government.[147] The majority of connections are digital subscriber line over phone lines.
The Government has two plans to bring Ultra-Fast Broadband to 97.8% of the population by 2019, and is spending NZ$1.35 billion on public-private partnerships to roll out fibre-to-the-home connection in all main towns and cities with population over 10,000. The program aims to deliver ultra-fast broadband capable of at least 100 Mbit/s download and 50 Mbit/s upload to 75% of New Zealanders by 2019.[148] In total, 1,340,000 households in 26 towns and cities will be connected.
Gigabit internet (1000 Mbit/s download speeds) was made available to the entire Ultra-Fast Broadband (UFB) footprint on 1 October 2016, in an announcement from Chorus.[149]
A$300 million Rural Broadband Initiative (RBI) has also been introduced by the Government, with the aim to bring broadband of at least 5 Mbit/s to 86% of rural customers by 2016.[150]
Energy edit
From 1995 to 2013, the energy intensity of the economy per unit of GDP declined by 25 percent.[151] A contributing factor is the growth of relatively less energy-intensive service industries.[152] New Zealand will be potentially among the main winners after the global transition to renewable energy is completed; the country is placed very high – no. 5 among 156 countries – in the index of geopolitical gains and losses after energy transition (GeGaLo Index).[153]
Electricity edit
The electricity market is regulated by the Electricity Industry Participation Code administered by the Electricity Authority (EA).[154] The electricity sector uses mainly renewable energy sources such as hydropower, geothermal power and increasingly wind energy.
The 83% share of renewable energy sources[155] makes New Zealand one of the most sustainable economies in terms of electricity generation;[156] in terms of total energy consumption in the New Zealand economy, this represents the 30% that comes from renewable sources.[157] New Zealand suffers from a geographical imbalance between electricity production and consumption. The most substantial electricity generation (both existing and as remaining potential) is located on the South Island and to a lesser degree in the central North Island, while the main demand (which is continuing to grow) is in the northern North Island, particularly the Auckland Region. This requires electricity to be transmitted north through a power grid which is reaching its capacity more often.
Water edit
As of 2021, almost all of the three waters assets (drinking water, stormwater and wastewater) are owned by local councils and territorial authorities. There are currently 67 different asset-owning organisations in total.[158]
The challenges for local government include funding infrastructure deficits and preparing for large re-investments that are estimated to require $110 billion over the next 30 to 40 years.[159] There are also significant challenges in meeting statutory requirements for the safety of drinking water, and the environmental expectations for management of stormwater and wastewater. Climate change adaptation, and providing for population growth add to these challenges.
A nationwide reform programme is underway, with the intention of amalgamating the three waters assets into a small number of large regional publicly owned utilities.[158]
Trade edit
New Zealand's small size and long distances from major world markets creates significant challenges in its ability to compete in global markets. In 2018, New Zealand's main trading partners were China, Australia, the European Union, the United States and Japan. Together, these five partners account for 66% of New Zealand's two-way trade.[160][161] In March 2014, the total value of goods exported from New Zealand topped $50 billion for the first time, up from $30 billion in 2001.[162] New Zealand Trade and Enterprise (NZTE) offers strategic advice and support to New Zealand businesses wanting to export goods and services to other countries.
Trade agreements edit
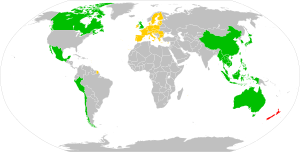
| New Zealand Free trade agreements in force Free trade agreements concluded but not in force |
Since 1960s New Zealand has pursued free trade agreements with many countries to diversify its export markets and increase the competitiveness of New Zealand's exports to the world.[163] As well as reducing barriers to trade, Trade Agreements New Zealand has entered into are designed to ensure existing access is maintained. Trade agreements establish rules by which trade can take place and ensure regulators and officials in countries New Zealand is trading with work closely together.[163]
China edit
China is New Zealand's largest trading partner, buying primarily meat, dairy products and pine logs. In 2013, trade between New Zealand and China was worth NZ$16.8 billion.[161] This has occurred primarily because of soaring demand for imported dairy products, following the Chinese milk scandal in 2008. Since then demand for milk products has been so strong that in the 12 months to March 2014, there was a 51% increase in total exports to China.[164] The increase was facilitated by the New Zealand–China Free Trade Agreement which came into force on 1 October 2008. Since that year exports to China have more than tripled.[165]
Australia edit

Australia was New Zealand's largest bilateral trading partner in 2013, when trade between the two countries was worth NZ$25.6 billion,[161] and before China overtook Australia. Economic and trading links between Australia and New Zealand are underpinned by the "Closer Economic Relations" (CER) agreement, which allows for free trade in goods and most services. Since 1990, CER has created a single market of more than 25 million people. Australia is now the destination of 19% of New Zealand's exports, including light crude oil, gold, wine, cheese and timber, as well as a wide range of manufactured items.
The CER also creates a free labour market which allows New Zealand and Australian citizens to live and work freely in each other's country together with mutual recognition of professional qualifications. This means individuals who are registered to practise an occupation in one country can register to practise an equivalent occupation in the other country. Banking regulation and supervision are co-ordinated through the Trans-Tasman Council on Banking Supervision and there are also ongoing discussions about co-ordinating Australian and New Zealand business law.[166]
European Union edit
The European Union is New Zealand's third largest trading partner. A growing number of New Zealand companies use the United Kingdom as a base to supply their products to the European market.[167] However trade with the European Union is declining as demand from Asia continues to grow. The EU takes only 8% of New Zealand exports but provides around 12% of imports.[166]
In July 2014, negotiations on the Partnership Agreement on Relations and Cooperation (PARC) between New Zealand and the European Union were concluded.[168] The agreement covers the trade and economic relationship between the EU and New Zealand with a view to further liberalisation of trade and investment and acknowledges the intention of the European Union to upgrade its diplomatic presence in New Zealand with a resident ambassador.[169]
United States edit
The United States was New Zealand's third largest trading partner in 2013, when bilateral trade between the two countries was valued at NZ$11.8 billion,[161] and before it was overtaken by the EU. New Zealand's main exports to the United States are beef, dairy products and lamb. Imports from the US include specialised machinery, pharmaceutical products, oil and fuel. In addition to trade, there is a high level of corporate and individual investment between the two countries and the US is a major source of tourists coming to New Zealand. In March 2012, the United States had a total of $44 billion invested in New Zealand.[170] A number of US companies have subsidiary branches in New Zealand. Many operate through local agents, with some joint venture associations. The United States Chamber of Commerce is active in New Zealand, with a main office in Auckland and a branch committee in Wellington.
According to the Ministry of Foreign Affairs, New Zealand and the United States "share a deep and longstanding friendship based on a common heritage, shared values and interests, and a commitment to promoting a free, democratic, secure and prosperous world".[171] This common background has not translated into a free trade agreement between the two countries.[172]
Japan and other Asian economies edit
Japan is New Zealand's fifth largest trading partner. In the 21st century, Asian economies have been developing rapidly providing significant demand for New Zealand's exports. New Zealand also trades with Taiwan, Hong Kong, Malaysia, Indonesia, Singapore, Thailand, India and the Philippines and this now accounts for around 16% of total exports.[166] New Zealand initiated a free trade agreement with Singapore in September 2000 which was extended in 2005 to include Chile and Brunei and is now known as the P4 agreement.
Relationship with Pacific Islands edit
The Pacific region with numerous islands is New Zealand's sixth largest trading market and is growing every year. In 2011 exports to Pacific Islands were worth over $1.5 billion up 12% on the previous year. Fiji is the biggest individual market followed very closely by Papua New Guinea, French Polynesia and New Caledonia. Goods exported to the islands include refined oil, construction materials, medicines, sheep meat, milk, butter, fruit and vegetables.[173] New Zealand also assists Pacific Islands with defence and regional security, and with management of the environment and fisheries.
Because of their small size, the Pacific Islands are some of the most vulnerable environments in the world and are on the receiving end of numerous cyclones every year. When disasters occur, they often have severe social and economic effects which last for years. Since 1992, New Zealand has co-operated with Australia and France to respond to disasters in the Pacific. New Zealand provides emergency supplies and transport, funding for roading and housing and the deployment of specialists to affected areas.[174]
Through the Ministry of Foreign Affairs and Trade, New Zealand also provides international aid and development funding to help stimulate sustainable economic development in underdeveloped economies. The New Zealand Aid Programme, allocated about $550m a year, is focused primarily on promoting development in the Pacific. The allocation of $550 million represents about 0.26% of New Zealand's gross national income (GNI).[175]
Foreign investment edit
New Zealand welcomes and encourages foreign investment, which is overseen by the Overseas Investment Office. In 2014 foreign direct investment totalled NZ$107.69 billion.[19] Between 1989 and 2013, foreign investment increased from NZ$9.7 billion to NZ$101.4 billion - a change of over 1,000%.[176] Between 1989 and 2007, foreign ownership of the New Zealand sharemarket went from 19% to 41% but has since dropped back to 33%. [citation needed]
In 2014, around 7% of all agriculturally productive land in New Zealand was foreign-owned.[34] In 2011, economist Bill Rosenberg claimed that the figure was closer to 9% when including foreign ownership of forestry land.[177] In March 2013, the financial sector, which includes the "big-four" Australian-owned banks, was worth NZ$39.3 billion - the largest share of the NZ$101.4 billion of foreign ownership of New Zealand companies at the time.[176]
Impact edit
Between 1997 and 2014, foreign investors made NZ$50.3 billion profit, 68% of which went overseas. The Campaign Against Foreign Control of Aotearoa (CAFCA) says this has a negative impact on the economy, arguing that when foreign investors buy up New Zealand companies, they tend to cut staff and push down wages.[34] It is also argued that growing foreign ownership has done nothing to reduce New Zealand's foreign debt. In 1984, private and public foreign debt was NZ$16 billion (NZ$50 billion in March 2013 dollars), which was less than half New Zealand's GDP at the time. By March 2013, total foreign debt stood at NZ$251 billion, well over 100% of New Zealand's GDP.[176]
Data edit

The following table shows the main economic indicators in 1980–2020 (with IMF staff estimates in 2021–2026). Inflation below 2% is in green.[178]
| Year | GDP (bil. US$ PPP) | GDP per capita (US$ PPP) | GDP (bil. US$ nominal) | GDP per capita (US$ nominal) | GDP growth (real) | Inflation rate (%) | Unemployment (%) | Government debt in GDP (%) |
|---|---|---|---|---|---|---|---|---|
| 1980 | 28.5 | 9,177.3 | 22.5 | 7,246.9 | 4.0% | n/a | ||
| 1981 | n/a | |||||||
| 1982 | n/a | |||||||
| 1983 | n/a | |||||||
| 1984 | n/a | |||||||
| 1985 | 64.2% | |||||||
| 1986 | ||||||||
| 1987 | ||||||||
| 1988 | ||||||||
| 1989 | ||||||||
| 1990 | ||||||||
| 1991 | ||||||||
| 1992 | ||||||||
| 1993 | ||||||||
| 1994 | ||||||||
| 1995 | ||||||||
| 1996 | ||||||||
| 1997 | ||||||||
| 1998 | ||||||||
| 1999 | ||||||||
| 2000 | ||||||||
| 2001 | ||||||||
| 2002 | ||||||||
| 2003 | ||||||||
| 2004 | ||||||||
| 2005 | ||||||||
| 2006 | ||||||||
| 2007 | ||||||||
| 2008 | ||||||||
| 2009 | ||||||||
| 2010 | ||||||||
| 2011 | ||||||||
| 2012 | ||||||||
| 2013 | ||||||||
| 2014 | ||||||||
| 2015 | ||||||||
| 2016 | ||||||||
| 2017 | ||||||||
| 2018 | ||||||||
| 2019 | ||||||||
| 2020 | ||||||||
| 2021 | ||||||||
| 2022 | ||||||||
| 2023 | ||||||||
| 2024 | ||||||||
| 2025 | ||||||||
| 2026 |
- Industrial production growth rate
- 5.9% (2004) / 1.5% (2007)
- Household income or consumption by percentage share
- Lowest 10%: 0.3% (1991)
- Highest 10%: 29.8% (1991)
- Agriculture – products
- Wheat, barley, potatoes, pulses, fruits, vegetables; wool, beef, dairy products; fish
- Exports – commodities
- Dairy products, meat, wood and wood products, fish, machinery
- Imports – commodities
- Machinery and equipment, vehicles and aircraft, petroleum, electronics, textiles, plastics
- Electricity
- Consumption: 34.88 TWh (2001) / 37.39 TWh (2006)
- Production: 38.39 TWh (2004) / 42.06 TWh (2006)
- Exports: 0 kWh (2006)
- Imports: 0 kWh (2006)
- Hydro: 60% (2020)
- Geothermal: 17% (2020)
- Wind: 5% (2020)
- Fossil fuel: 17% (2020)
- Nuclear: 0% (2020)
- Other: 3.4% (2010)
- Oil
- Production: 42,160 barrels (6,703 m3) 2001 / 25,880 barrels (4,115 m3) 2006
- Consumption: 132,700 barrels (21,100 m3) 2001 / 156,000 barrels (24,800 m3) 2006
- Exports: 30,220 barrels (4,805 m3) 2001 / 15,720 barrels (2,499 m3) 2004
- Imports: 119,700 barrels (19,030 m3) 2001 / 140,900 barrels (22,400 m3) 2004
- Proven reserves: 89.62 million barrels (14,248,000 m3) January 2002
- Exchange rates
- New Zealand dollars (NZ$) per US$1 – 1.4771 (2016), 1.2652 (2012), 1.3869 (2005), 1.5248 (2004), 1.9071 (2003), 2.1622 (2002), 2.3788 (2001), 2.2012 (2000), 1.8886 (1999), 1.8632 (1998), 1.5083 (1997), 1.4543 (1996), 1.5235 (1995)
See also edit
- Agriculture in New Zealand
- Economy of Oceania
- Energy in New Zealand
- History of the banking sector in New Zealand
- Foreign trade of New Zealand
- Median household income in Australia and New Zealand
- Ministry of Business, Innovation and Employment
- Ngai Tahu holdings and Ngāi Tahu trading enterprises
- Reserve Bank of New Zealand
- Telecommunications in New Zealand
References edit
- ^ "Year End Financial Statements". NZ Treasury. Retrieved 5 March 2017.
- ^ "World Economic Outlook Database, April 2019". IMF.org. International Monetary Fund. Retrieved 29 September 2019.
- ^ "World Bank Country and Lending Groups". datahelpdesk.worldbank.org. World Bank. Retrieved 29 September 2019.
- ^ "Subnational population estimates (RC, SA2), by age and sex, at 30 June 1996-2023 (2023 boundaries)". Statistics New Zealand. Retrieved 25 October 2023. (regional councils); "Subnational population estimates (TA, SA2), by age and sex, at 30 June 1996-2023 (2023 boundaries)". Statistics New Zealand. Retrieved 25 October 2023. (territorial authorities); "Subnational population estimates (urban rural), by age and sex, at 30 June 1996-2023 (2023 boundaries)". Statistics New Zealand. Retrieved 25 October 2023. (urban areas)
- ^ a b c d "World Economic Outlook Database, October 2023 Edition. (NZ)". International Monetary Fund. 10 October 2023. Archived from the original on 19 October 2023. Retrieved 12 October 2023.
- ^ a b c "The outlook is uncertain again amid financial sector turmoil, high inflation, ongoing effects of Russia's invasion of Ukraine, and three years of COVID". International Monetary Fund. 11 April 2023.
- ^ "New Zealand Economic and Financial Overview" (PDF). New Zealand Treasury. 2012. pp. 19–23. Archived from the original (PDF) on 4 May 2017. Retrieved 17 March 2017.
- ^ "Annual inflation at 7.3 percent, 32-year high". Statistics New Zealand. 18 July 2022.
- ^ "Relative poverty rate at 50% of the median household income in OECD countries".
- ^ "Household income and housing-cost statistics: Year ended June 2019". Statistics New Zealand. Table 9. Archived from the original (Spreadsheet) on 24 February 2020. Retrieved 24 February 2020.
- ^ a b "Human Development Report 2023/24" (PDF). United Nations Development Programme. 13 March 2024. p. 288. Retrieved 13 March 2024.
- ^ a b c d e "Labour market statistics: June 2022 quarter | Stats NZ". www.stats.govt.nz. Stats NZ. Retrieved 3 August 2022.
- ^ a b c d e f g h "The World Factbook". CIA.gov. Central Intelligence Agency. Retrieved 23 October 2019.
- ^ "Home".
- ^ "Taxing Wages 2023: Indexation of Labour Taxation and Benefits in OECD Countries | READ online".
- ^ "Home".
- ^ a b c d "Overseas merchandise trade: June 2023". Stats NZ. Retrieved 27 October 2023.
- ^ "Balance of Payments and International Investment Position – M7". Statistics New Zealand. Reserve Bank of New Zealand. 19 December 2018. Retrieved 23 February 2019.
- ^ a b c "Financial Statements of the Government of New Zealand for the eight months ended 28 February 2018". New Zealand Treasury. 8 April 2018. Retrieved 17 February 2019.
- ^ "Sovereigns rating list". Standard & Poor's. Retrieved 26 May 2011.
- ^ a b c Rogers, Simon; Sedghi, Ami (15 April 2011). "How Fitch, Moody's and S&P rate each country's credit rating". The Guardian. London. Retrieved 31 May 2011.
- ^ "New Zealand Foreign Exchange Reserves, 2005–2023 | CEIC Data". www.ceicdata.com. Retrieved 8 August 2023.
- ^ Hall, Peter A.; Soskice, David (2001). Varieties of Capitalism: The Institutional Foundations of Comparative Advantage. Oxford University Press. p. 570. ISBN 978-0191647703.
- ^ a b c "New Zealand in Profile 2014: Economy". Statistics New Zealand. March 2011. Retrieved 9 December 2014.
- ^ Minerals, New Zealand Petroleum and. "Mineral resources potential". New Zealand Petroleum and Minerals. Retrieved 9 February 2024.
- ^ "NZ Tech – About the Tech Sector". Retrieved 7 January 2020.
- ^ "1. NZX Annual Report 2022 (including audited financial statements)" (PDF). NZX. 23 February 2023. Retrieved 26 October 2023.
- ^ "Triennial Central Bank Survey, April 2013" (PDF). Triennial Central Bank Survey. Bank for International Settlements. Retrieved 25 March 2014. [pg.10 of PDF]
- ^ a b c "Early pastoral economy". Te Ara: The Encyclopedia of New Zealand. p. 4.
- ^ a b McKinnon, Malcolm, ed. (1997). New Zealand Historical Atlas. David Bateman.
- ^ a b "The introduction of refrigeration". NZ International Business Forum. Archived from the original on 13 May 2015. Retrieved 19 October 2014.
- ^ Drew, Aaron. "New Zealand's productivity performance and prospects" (PDF). Bulletin. 70 (1). Archived from the original (PDF) on 8 May 2014. Retrieved 10 February 2008.
- ^ Evans, Lewis; Grimes, Arthur; Wilkinson, Bryce (December 1996). "Economic Reform in New Zealand 1984–95: The Pursuit of Efficiency". Journal of Economic Literature. 34 (4): 1856–902. Retrieved 4 October 2012.
- ^ a b c d McCarten, Matt (14 January 2007). "Foreign owners muscle in as New Zealand sells off all its assets". The New Zealand Herald.
- ^ "New Zealand rated most business-friendly". International Herald Tribune. 14 September 2005.
- ^ a b "External diversification after 1966". Te Ara: The Encyclopedia of New Zealand. p. 10. Retrieved 9 December 2014.
- ^ a b "Early Māori economies". Te Ara: The Encyclopedia of New Zealand. p. 2. Retrieved 9 December 2014.
- ^ a b c King, Michael (2003). The Penguin History of New Zealand. Penguin Books. ISBN 978-0-14-301867-4.
- ^ "First European economies". Te Ara: The Encyclopedia of New Zealand. Retrieved 9 December 2014.
- ^ Warwick Robert Armstrong. "Vogel, Sir Julius, K.C.M.G". Te Ara: The Encyclopedia of New Zealand.
- ^ "Boom and bust, 1870–1895". Te Ara: The Encyclopedia of New Zealand. p. 5. Retrieved 11 December 2014.
- ^ a b "Refrigeration, dairying and the Liberal boom". Te Ara: The Encyclopedia of New Zealand.
- ^ Baten, Jörg (2016). A History of the Global Economy. From 1500 to the Present. Cambridge University Press. p. 287. ISBN 978-1107507180.
- ^ "Inter-war years and depression". Te Ara: The Encyclopedia of New Zealand.
- ^ Liu, Shirley (13 October 2015). "The history of the New Zealand dollar". finder.com US. Archived from the original on 10 August 2019. Retrieved 11 August 2019.
- ^ a b "New Zealand's trade history". New Zealand International Business Forum. Archived from the original on 13 May 2015. Retrieved 19 October 2014.
- ^ "NAFTA signed". Te Ara: The Encyclopedia of New Zealand. Retrieved 8 December 2014.
- ^ a b "Britain, New Zealand and the EU after 1940". Te Ara: The Encyclopedia of New Zealand. Retrieved 8 December 2014.
- ^ "New Zealand's Export Markets year ended June 2000 (provisional)". Statistics New Zealand. June 2000. Archived from the original on 15 May 2010. Retrieved 15 June 2008.
- ^ a b c "Inflation". Reserve Bank of New Zealand. Archived from the original on 7 December 2014. Retrieved 8 December 2014.
- ^ a b "In the shadow of Think Big". The New Zealand Herald. 31 January 2011.
- ^ "Introduction". New Zealand Aluminium Smelter Limited. Retrieved 8 December 2014.
- ^ Jack H. Nagel (1998). "Social Choice in a Pluralitarian Democracy: The Politics of Market Liberalization in New Zealand". British Journal of Political Science. 28 (2): 223–67. doi:10.1017/s0007123498000155. JSTOR 194306. S2CID 154322735.
- ^ a b "20 years of a floating New Zealand dollar". Reserve Bank of New Zealand. Archived from the original on 25 October 2014. Retrieved 25 October 2014.
- ^ Russell 1996, p. 119.
- ^ "Share Price Index, 1987–1998". Archived from the original on 25 May 2010.
- ^ "Commercial Framework: Stock exchange, New Zealand Official Yearbook 2000". Statistics New Zealand. Archived from the original on 4 March 2016. Retrieved 8 December 2014.
- ^ a b c d Kelsey, Jane (9 July 1999). "Life in the Economic Test-Tube: New Zealand 'experiment' a colossal failure". Archived from the original on 2 November 2016. Retrieved 26 January 2012.
- ^ OECD (28 January 1988). "LFS by sex and age – indicators". Stats.oecd.org. Retrieved 5 September 2018.
- ^ "Reserve Bank statistics – Employment". Reserve Bank of New Zealand. Archived from the original on 22 January 2016. Retrieved 8 December 2014.
- ^ a b "New Zealand as it might have been: From Ruthanasia to President Bolger". The New Zealand Herald. 12 January 2007. Retrieved 8 December 2014.
- ^ Ministry for Culture and Heritage (29 February 2012). "The state steps in and out – housing in New Zealand". New Zealand history online. Retrieved 9 July 2012.
- ^ Dobbin, Murray (15 August 2000). "New Zealand's Vaunted Privatization Push Devastated The Country, Rather Than Saving It". The National Post (Canada). Archived from the original on 24 March 2013.
- ^ "Government and market liberalisation". Te Ara: The Encyclopedia of New Zealand. p. 11.
- ^ OECD. "1. Gross domestic product (GDP)". stats.oecd.org.
- ^ "New Zealand Unemployment Data Set". OECD.
- ^ "Survey ranks NZ in top six for economic freedom". The New Zealand Herald. 16 January 2008.
- ^ Rudman, Brian (18 September 2009). "Government must plug those leaks". The New Zealand Herald.
- ^ Weshah Razzak (February 2014). "New Zealand Labour Market Dynamics: Pre- and Post-global Financial Crisis" (PDF). New Zealand Treasury. Archived from the original (PDF) on 25 January 2015. Retrieved 13 December 2014.
- ^ Joyce, Steven (3 February 2016). "Unemployment figure lowest in seven years". beehive.govt.nz. New Zealand Government.
- ^ a b c d e f "Recent Economic Performance and Outlook" (PDF). New Zealand Treasury. 2014. Archived from the original (PDF) on 18 January 2015. Retrieved 26 December 2014.
- ^ "The Treasury: Learning from managing the Crown Retail Deposit Guarantee Scheme". Controller and Auditor-General of New Zealand.
- ^ Yahanpath, Noel; Cavanagh, John (2011). Causes of New Zealand Finance Company Collapses: A Brief Review. Social Science Research Network. SSRN 1906923.
- ^ "Deposit guarantee scheme introduced". Reserve Bank of New Zealand. Archived from the original on 14 October 2008.
- ^ "Deep freeze list – Finance industry failures". Interest.co.nz.
- ^ "Fran O'Sullivan: Treasury must front up over role in SCF debacle". The New Zealand Herald. 18 October 2014.
- ^ Krause, Nick; Mace, William (2 September 2011). "Nathans Finance directors jailed". Stuff.co.nz. Retrieved 22 January 2017.
- ^ Fletcher, Hamish (31 August 2012). "Capital + Merchant directors jailed". The New Zealand Herald. Retrieved 22 January 2017.
- ^ "Prison for Bridgecorp director". Stuff.co.nz. 17 April 2012. Retrieved 22 January 2017.
- ^ "Remorseless director Rod Petricevic jailed". Stuff.co.nz. 26 April 2012. Retrieved 22 January 2017.
- ^ "David Ross gets 10 years,10 months jail". The New Zealand Herald. 15 November 2013. Retrieved 22 January 2017.
- ^ "NZ economy could hit the rocks – economists". Stuff. 25 August 2014.
- ^ "New Zealand 2014's 'rock star' economy". Stuff. 7 January 2014.
- ^ "Rock star economy or one hit wonder?". New Zealand Productivity Commission. 17 April 2014. Archived from the original on 23 January 2019. Retrieved 26 December 2014.
- ^ "NZ's 'rock star' status dims". The New Zealand Herald. 19 August 2014.
- ^ Niko Kloeten (3 December 2014). "'Rock star' economy to play on". Stuff. Retrieved 21 January 2015.
- ^ "How New Zealand's rich-poor divide killed its egalitarian paradise". The Guardian. 12 December 2014. Retrieved 21 January 2015.
- ^ "Covid-19: GDP results show NZ officially in first recession in a decade". Radio New Zealand. 17 September 2020. Archived from the original on 17 September 2020. Retrieved 17 September 2020.
- ^ Pullar-Strecker, Tom (17 September 2020). "NZ in recession as Covid shrinks GDP by 12.2%". Stuff. Archived from the original on 17 September 2020. Retrieved 17 September 2020.
- ^ Roy, Eleanor (16 September 2020). "New Zealand in Covid recession after worst quarterly GDP fall on record". The Guardian. Archived from the original on 17 September 2020. Retrieved 17 September 2020.
- ^ "GDP jump of 14 per cent completes NZ's 'V'-shaped recovery". Stuff. 16 December 2020. Retrieved 9 February 2021.
- ^ "A country with one of the strictest COVID lockdowns is seeing a V-shaped recovery". Fortune. Retrieved 27 January 2021.
- ^ "Shock fall in unemployment to 4.9%". Stuff. 2 February 2021. Retrieved 2 February 2021.
- ^ Bhattarai, Rahul (23 September 2021). "Covid 19 Delta outbreak: Restaurant Association unveils roadmap as industry loses 13,000 jobs". The New Zealand Herald. Archived from the original on 23 September 2021. Retrieved 1 February 2022.
- ^ Hall, Carmen (13 November 2021). "Gone: 26,774 businesses wiped off NZ Companies Office Register in eight months". Bay of Plenty Times. NZME. Archived from the original on 13 November 2021. Retrieved 1 February 2022.
- ^ Rutherford, Hamish (27 January 2022). "Inflation hits 30-year high of 5.9 per cent". The New Zealand Herald. Archived from the original on 29 January 2022. Retrieved 1 February 2022.
- ^ "Border delays and a crash in house prices are the main risks facing the NZ economy – OECD report". Radio New Zealand. 1 February 2022. Archived from the original on 1 February 2022. Retrieved 1 February 2022.
- ^ "Social Progress Index – New Zealand". Social Progress Imperative. Archived from the original on 5 February 2015. Retrieved 5 February 2015.
Social Progress Index 87.08 (5th)
- ^ a b c "National Accounts (Income and Expenditure): Year ended March 2014". Statistics New Zealand. 21 November 2014. Retrieved 3 December 2015.
- ^ "New Zealand". The World Fact Book. Central Intelligence Agency. Retrieved 12 December 2014.
Public debt
31.7% of GDP (2017 est.)
33.5% of GDP (2016 est.)
country comparison to the world: 162 - ^ Bertram, Geoff (February 2009). "The banks, the current account, the financial crisis and the outlook" (PDF). Policy Quarterly. 5 (1). doi:10.26686/pq.v5i1.4288.
- ^ "Personal tax cuts". IRD. 1 October 2010. Archived from the original on 29 January 2019. Retrieved 9 March 2015.
- ^ Dickison, Michael (12 May 2010). "NZ earners' tax burden second-lowest in OECD". The New Zealand Herald. Retrieved 18 June 2011.
- ^ Bill English (20 May 2010). "Fact sheet – Personal tax cuts". The Beehive. Retrieved 9 March 2015.
- ^ "GST rate increase". IRD. Archived from the original on 24 January 2019. Retrieved 11 October 2014.
- ^ Collins, Simon Collins (30 January 2010). "GST rise will hurt poor the most". The New Zealand Herald. Retrieved 9 March 2015.
- ^ "Transparency International Corruption Perceptions Index 2017". Transparency International. 21 February 2018. Archived from the original on 21 February 2018. Retrieved 25 February 2018.
- ^ "2018 Corruption Perceptions Index - Explore the results". 29 January 2019. Archived from the original on 27 April 2019. Retrieved 18 April 2020.
- ^ "2019 Corruption Perceptions Index - Explore the results". 24 January 2020. Archived from the original on 27 March 2020. Retrieved 18 April 2020.
- ^ "Examples of Corruption in New Zealand - Transparency International New Zealand". Archived from the original on 30 July 2020. Retrieved 18 April 2020.
- ^ "Regional gross domestic product: Year ended March 2023". Statistics New Zealand. 26 March 2024. Retrieved 26 March 2024.
- ^ "New Zealand Business Figures". Archived from the original on 20 April 2020.
- ^ a b c d "How bad is the Current Recession? Labour Market Downturns since the 1960s". Ministry of Business, Innovation and Employment. Archived from the original on 15 December 2014. Retrieved 15 December 2014.
- ^ "Household Labour Force Survey: December 2015 quarter". Statistics New Zealand. 3 February 2016. Retrieved 4 December 2014.
- ^ a b Daly, Michael (7 February 2008). "Unemployment at record low as job growth surges". The New Zealand Herald. APN Holdings. Archived from the original on 23 February 2013. Retrieved 7 August 2010.
- ^ "Unemployment Rate". Statistics New Zealand. Retrieved 10 October 2019.
- ^ a b "Why house prices are up and ownership is down". The New Zealand Herald. 18 July 2014.
Thirty years ago, an average house cost two or three times the average household income. But prices have rocketed since then, especially since 2001. By 2007, an average house cost more than six times household income.
- ^ a b "Housing affordability getting worse". Stuff. 20 January 2014.
- ^ "Auckland house prices continue their relentless rise". National Business Review. 8 January 2014. Archived from the original on 4 August 2020. Retrieved 16 October 2014.
- ^ Gibson, Anne (18 April 2016). "2016 house price hikes tipped by economist". The New Zealand Herald – via www.nzherald.co.nz.
- ^ "House values soar in tight Auckland property market". The New Zealand Herald. 11 June 2014.
- ^ Home truths: City of expensive sales tops Sydney, The New Zealand Herald, 26 April 2016.
- ^ a b "NZ mortgage rates: How we compare with rest of the world". The New Zealand Herald. 18 October 2014.
- ^ "Houses too far from reach?". The Dominion Post. 26 April 2014.
- ^ "Housing Affordability Inquiry" (PDF). New Zealand Productivity Commission. Archived from the original (PDF) on 2 May 2019. Retrieved 16 October 2014.
- ^ Submission of the New Zealand Council of Trade Unions to the Productivity Commission on the Housing Affordability Inquiry, February 2012, p. 5
- ^ "The fading dream of a first home in city". The New Zealand Herald. 15 October 2014.
- ^ "Chinese investment in NZ housing tipped to rise". The New Zealand Herald. 17 October 2014.
- ^ "Why house prices are up and ownership is down". The New Zealand Herald. 18 July 2014.
Home ownership has plunged since 1991. Back then, 76 per cent of homes were occupied by their owners, but by last year, that was down to 63 per cent.
- ^ a b "NZ income gap at crisis level". Stuff. 19 September 2013.
- ^ "Paradise for a few". The New Zealand Herald. 22 June 2013.
- ^ "New Zealand Progress Indicators:Income inequality". Statistics New Zealand. August 2014. Retrieved 22 December 2014.
- ^ "Brian Fallow: Wealth gap goes mainstream". The New Zealand Herald. 24 October 2014.
The nearest comparable New Zealand data - unfortunately 10 years old - shows the lower half of the distribution owning 5 per cent of households' total net worth, while the richest 5 per cent of households had 38 per cent. It is unlikely that things have moved in a more egalitarian direction since then.
- ^ "New Zealand Superannuation and Retirement Income Act 2001 No 84 (as at 01 April 2022), Public Act – New Zealand Legislation". www.legislation.govt.nz. Retrieved 10 June 2022.
- ^ "National lacks courage on retirement age – Act leader". The New Zealand Herald. 24 February 2014.
- ^ "Population aging in New Zealand". Statistics New Zealand.
- ^ "Brian Gaynor: NZ badly behind times with age pensions". The New Zealand Herald. 5 November 2011.
- ^ "October 2014 Monthly Report" (PDF). New Zealand Superannuation Fund. Archived from the original (PDF) on 23 January 2019. Retrieved 14 December 2014.
- ^ "KiwiSaver annual statistics". Inland Revenue. Retrieved 14 December 2014.
- ^ "Infrastructure 2013 National State of Infrastructure Report" (PDF). National Infrastructure Unit, New Zealand Treasury. 2013. Retrieved 22 December 2014.
- ^ MacManus, Joel (6 September 2020). "Major report reveals $75 billion infrastructure deficit, warns of recession risks". Stuff. Retrieved 30 May 2021.
- ^ a b c d "Connecting New Zealand – State of our infrastructure". Ministry of Transport. 26 April 2018. Archived from the original on 17 December 2014.
- ^ "Maintaining our network". NZ Transport Agency. Retrieved 15 December 2014.
- ^ Bell, Mike. "New Zealand Transportation". move2nz. Retrieved 13 December 2016.
- ^ "Frequently Asked Questions". Retrieved 12 September 2018.
- ^ "2013 Annual Telecommunications Monitoring Report". Commerce Commission. 21 May 2014. Retrieved 22 December 2014.
- ^ "Internet Service Provider Survey: 2014". Internet Service Provider Survey. Statistics New Zealand. 14 October 2014. ISSN 1178-0509. Retrieved 14 October 2014.
- ^ "Ultra-Fast Broadband Initiative". Ministry of Business, Innovation and Employment. Retrieved 6 March 2014.
- ^ "Chorus launches gigabit wholesale broadband services nationwide | Chorus". www.chorus.co.nz. Archived from the original on 30 October 2016. Retrieved 30 October 2016.
- ^ "Rural Broadband Initiative contracts". Ministry of Business, Innovation and Employment.
- ^ "Energy in New Zealand". MBIE. July 2014. Retrieved 3 August 2014.
- ^ "Key Findings on New Zealand's Progress Using a Sustainable Development Approach". Statistics New Zealand. 2010. Retrieved 21 April 2012.
- ^ Overland, Indra; Bazilian, Morgan; Ilimbek Uulu, Talgat; Vakulchuk, Roman; Westphal, Kirsten (1 November 2019). "The GeGaLo index: Geopolitical gains and losses after energy transition". Energy Strategy Reviews. 26: 100406. Bibcode:2019EneSR..2600406O. doi:10.1016/j.esr.2019.100406. hdl:11250/2634876.
- ^ "The Code". Electricity Authority / New Zealand government. Retrieved 11 November 2016.
- ^ a b nzcpe (18 May 2020). "Climate explained: why switching to electric transport makes sense even if electricity is not fully renewable". Planetary Ecology. Retrieved 20 May 2020.
- ^ "New Zealand Commits to 90% Renewable Electricity by 2025". RenewableEnergyWorld.com. Retrieved 11 November 2016.
- ^ https://www.mbie.govt.nz/dmsdocument/27344-energy-in-new-zealand-2023-pdf [bare URL]
- ^ a b "Central/Local Government Three Waters Reform Programme". Te Tari Taiwhenua - Department of Internal Affairs. Retrieved 30 May 2021.
- ^ Coughlan, Thomas (26 March 2021). "Government thinks $110 billion needed to fix broken water system". Stuff. Retrieved 30 May 2021.
- ^ "Goods and services trade by country: Year ended June 2018 – corrected". Statistics New Zealand. Retrieved 10 February 2019.
- ^ a b c d "Main trading partners, 2013". Statistics New Zealand. Retrieved 3 December 2014.
- ^ "Export Milestones". Statistics New Zealand.
- ^ a b "Trade Relationships and Agreements". Ministry of Foreign Affairs and Trade (New Zealand). 21 August 2014. Retrieved 10 December 2014.
- ^ "Trade surplus widens as dairy drives exports into China". The New Zealand Herald. 29 April 2014.
- ^ "China overtakes Australia as NZ's biggest export market". National Business Review. 26 April 2013. Retrieved 13 December 2014.
- ^ a b c "Principal Trading Partners". New Zealand Treasury. Archived from the original on 23 October 2014. Retrieved 23 October 2014.
- ^ "United Kingdom". New Zealand Trade and Enterprise.
- ^ "Joint statement on EU-New Zealand Partnership Agreement". Ministry of Foreign Affairs and Trade (New Zealand).
- ^ "Joint declaration by President Van Rompuy, President Barroso and Prime Minister Key on deepening the partnership between New Zealand and the European Union". The Hague. 25 March 2014.
- ^ "The USA". New Zealand Trade and Enterprise.
- ^ "United States of America". Ministry of Foreign Affairs and Trade (New Zealand).
- ^ "Why bother with a US FTA?". The New Zealand Herald. 23 March 2010.
- ^ "Pacific Islands". New Zealand Trade and Enterprise.
- ^ "Pacific". Ministry of Foreign Affairs and Trade (New Zealand). Archived from the original on 27 October 2014.
- ^ "About the aid programme". Ministry of Foreign Affairs and Trade (New Zealand). Archived from the original on 7 October 2015. Retrieved 26 October 2014.
- ^ a b c "Who Owns NZ? Foreign Control Key Facts Updated". Scoop.co.nz. 7 January 2014.
- ^ Bill Rosenberg. "Overseas Ownership of Land".
- ^ "Report for Selected Countries and Subjects: October 2021". World Economic Outlook Database. International Monetary Fund (IMF). Archived from the original on 23 March 2022.
- ^ "Electricity in New Zealand". NZ Electricity Authority/Te Mana Hiko. November 2010. Archived from the original on 2 January 2011. Retrieved 19 January 2011.
Further reading edit
- Dalziel, P. (2002). "New Zealand's Economic Reforms: An assessment". Review of Political Economy. 14 (1): 31–45. CiteSeerX 10.1.1.512.8999. doi:10.1080/09538250120102750. S2CID 154808716.
- Easton, B. (1994). "Economic and other ideas behind the New Zealand reforms". Oxford Review of Economic Policy. 10 (3): 78–94. doi:10.1093/oxrep/10.3.78.
- Evans, L.; Grimes, A.; Bryce, W.; Teece, D. (1996). "Economic Reform in New Zealand 1984–95: The Pursuit of Efficiency". Journal of Economic Literature. 34 (4): 1856–902.
- Harcourt, T. (2005). Closer Economic Relations. Australian Trade Commission Website
- Frezza, William (July 2015). New Zealand's Far-Reaching Reforms: A Case Study on How to Save Democracy from Itself. Universidad Francisco Marroquín (The Antigua Forum). ISBN 978-9929-602-41-0.
- Russell, Marcia (1996). Revolution: New Zealand from Fortress to Free Market. Hodder Moa Beckett. ISBN 1869584287.
 This article incorporates public domain material from The World Factbook (2024 ed.). CIA. (Archived 2005 edition.)
External links edit
- OECD New Zealand country page and OECD Economic Survey of New Zealand
- Ministry of Business, Innovation and Employment
- Statistics New Zealand
- World Bank Trade Summary – New Zealand