


Summary
The economy of Ukraine is an emerging, lower-middle income, mixed economy located in Eastern Europe. It grew rapidly from 2000 until 2008 when the Great Recession began worldwide and reached Ukraine. The economy recovered in 2010 and continued improving until 2013. From 2014 to 2015, the Ukrainian economy suffered a severe downturn, with GDP in 2015 being slightly above half of its value in 2013. In 2016, the economy again started to grow. By 2018, the Ukrainian economy was growing rapidly, and reached almost 80% of its size in 2008.
 Kyiv, the financial capital of Ukraine | |
| Currency | Hryvnia (UAH) |
|---|---|
| calendar year | |
Trade organizations | GUAM, WTO, CISFTA, DCFTA (EU), BSEC |
Country group |
|
| Statistics | |
| Population | |
| GDP | |
| GDP rank | |
GDP growth |
|
GDP per capita | |
GDP per capita rank | |
GDP by sector |
|
| 9.7% (2024)[3] | |
Population below poverty line | |
Labor force | |
Labor force by occupation |
|
| Unemployment | |
Average gross salary | ₴21,809 / €519 / $532 monthly[12] |
| ₴22,000 / €521 / $536 monthly[13][14] | |
Main industries | coal, electric power, ferrous and nonferrous metals, machinery and transport equipment, chemicals, food processing |
| External | |
| Exports | |
Export goods | ferrous and nonferrous metals, fuel and petroleum products, chemicals, machinery and transport equipment, food products |
Main export partners |
|
| Imports | |
Import goods | energy (mainly natural gas),[18] machinery and equipment, chemicals |
Main import partners |
|
FDI stock | |
Gross external debt | |
| Public finances | |
| Revenues | ₴1.1 trillion / €37 bil. / $39 bil. (2017)[24] |
| Expenses | ₴1.1 tril. / €38 bil. / $41 bil. (2017)[24] |
| Economic aid | recipient: $0.4 billion (2006); International Monetary Fund Extended Funds Facility: $2.2 billion (1998) |
The depression during the 1990s included hyperinflation and a fall in economic output to less than half of the GDP of the preceding Ukrainian SSR. GDP growth was recorded for the first time in 2000, and continued for eight years.[32] This growth was halted by the global financial crisis of 2008. The Ukrainian economy recovered and achieved positive GDP growth in the first quarter of 2010. In the early 2010s, Ukraine was noted as possessing many of the components of a major European economy, such as rich farmlands,[33][34] a well-developed industrial base, highly trained labour, and a good education system.[35] It also has important mineral resources.[36]
In October 2013, the Ukrainian economy lapsed into a recession.[37] The previous summer, Ukrainian exports to Russia substantially declined due to stricter border and customs control by Russia.[38] The early 2014 annexation of Crimea by Russia, and the war in Donbas that started in the spring of 2014 severely damaged Ukraine's economy[39] and two of Ukraine's most industrial regions.[40] In 2013, Ukraine saw zero GDP growth.[40] Ukraine's economy shrank by 6.8% in 2014,[41] and this continued with a 12% decline in GDP in 2015.[42] In April 2017, the World Bank stated that Ukraine's economic growth rate was 2.3% in 2016, ending the recession.[43] Despite these improvements, Ukraine remains the poorest country in Europe,[44] which some have attributed to high corruption levels[45] and the slow pace of economic liberalisation and institutional reform.[46][47][48][49] The Russian Invasion of Ukraine in 2022 further deteriorated the country's crumbling economy.
History edit
Before 1917 edit
Geography has long influenced the economy of the Ukrainian lands. Rich fertile soils (such as chernozem areas) made the area a "breadbasket": for ancient Greece[50] as well as for early modern Europe.[51] The maintenance of trade corridors – the route from the Varangians to the Greeks and access through the Straits to the Mediterranean world – became important. Mineral resources encouraged industrialisation – notably in the Donbas – from the 19th century onwards.[52]
The lack of secure borders meant repeated interruptions in economic development. Steppe nomads and other conquerors – Cumans, Mongols, Tatars for example, sometimes saw plundering as more important than fostering economic development. In the 16th to 18th centuries, the wastelands of the Wild Fields left much of Ukraine as an area of tentatively militarised outposts, prior to tsarist Russia's extension of its power into the region in the 17th and 18th centuries.
Soviet period: 1917 to 1991 edit
1991 to 2000 edit
On 24 August 1991, Ukraine established its independence from the Soviet Union.[53] The new state's economy suffered huge output declines and soaring inflation in the following years.[54] Ukraine saw hyperinflation in the early 1990s because of a lack of access to financial markets and massive monetary expansion to finance government spending, while output declined sharply this was catastrophic for the economy because it undid decades of hard-fought economic progress and people became poorer.[54] Huge output declines and soaring inflation was at the time common to most former Soviet republics, but Ukraine was among the hardest hit by these problems.[54]
In response to hyperinflation the National Bank of Ukraine replaced the national currency, the karbovanets, with the hryvnia in September 1996 and pledged to keep it stable in relation to the U.S. dollar.[54][55] The currency remained unstable through the late 1990s, particularly during the 1998 Russian financial crisis.[54]
Deep recession during the 1990s led to a relatively high poverty rate, but beginning in 2001, seven straight years of economic growth, raised the living standard for most citizens. A World Bank report in 2007 noted that: "Ukraine recorded one of the sharpest declines in poverty of any transition economy in recent years. The poverty rate, measured against an absolute poverty line, fell from a high of 32% in 2001 to 8% in 2005."[56] The UN noted that Ukraine had overcome absolute poverty, and that there was only relative poverty in 2009.[57]
2000 to 2014 edit
Ukraine stabilised by the early 2000s.[54] The year 2000 saw the first year of economic growth since Ukraine's independence.[35] The economy continued to grow thanks to a 50% growth in exports between 2000 and 2008[35] – mainly exports from the traditional industries of metals, metallurgy, engineering, chemicals, and food.[35] Between 2001 and 2008, metals and chemicals prices boomed because of fast international economic growth, while the price of natural gas imported from Russia remained low.[35]
Monetisation also helped to drive the economic boom Ukraine experienced between 2000 and 2008.[35] Attracted in part by relatively high interest-rates, foreign cash was injected into Ukraine's economy and money supply grew rapidly: from 2001 to 2010 broad, money increased at an annual rate of 35%.[54] In 2006 and 2007, credit growth averaged 73%.[54]
An effect of this was that Ukrainian assets began to look like a large economic bubble and high inflation started to damage Ukraine's export competitiveness.[54] The ratio of credit to GDP grew extremely fast – from 7% to almost 80% over just several[quantify] years.[35] From 2000 to 2007, Ukraine's real growth averaged 7.4%.[35] This growth was driven by domestic demand: orientation toward consumption, other structural change, and financial development.[35]
Domestic demand grew in constant prices by almost 15% annually.[35] It was supported by expansionary—procyclical—fiscal policy.[35] Ukraine benefited from very low labour costs, slightly lower tariffs, and high prices of its main export goods, but at the same time faced notably higher non-tariff barriers.[35] Russia has not charged Ukraine below-world-market prices for natural gas since the end of 2008. This led to various Russia–Ukraine gas disputes.[35][58][59][60]
Ukraine suffered severely in the economic crisis of 2008. Because of it Ukraine experienced a drought in capital flows.[54] The hryvnia, which had been pegged at a rate of 5:1 to the U.S. dollar, was devalued to 8:1, and was stabilised at that ratio until the beginning of 2014.[61] In 2008, Ukraine's economy ranked 45th in the world according to GDP (nominal), with a total nominal GDP of US$188 billion, and nominal per-capita GDP of US$3,900. There was 3% unemployment at the end of 2008. Over the first 9 months of 2009, unemployment averaged 9.4%.[62] The final official unemployment rates for 2009 and 2010 were 8.8% and 8.4%,[63] although the CIA World Factbook notes a "large number of unregistered or underemployed workers".[63] Ukraine's GDP fell by 15% in 2009.[54]
The Ukrainian economy recovered in the first quarter of 2010[64] due to the recovery of the world economy and increasing prices for metals.[59] Ukraine's real GDP growth in 2010 was 4.3%, leading to a per-capita PPP GDP of US$6,700.[63] In 2011, Ukrainian politicians estimated that 40% of Ukraine's economy was a shadow economy.[65][66]
In the summer of 2013, Ukrainian exports to Russia fell substantially due to Russia's stricter customs controls.[38]
By October 2013, the Ukrainian economy had become stuck in recession.[37] Moody's downgraded Ukraine's credit rating to Caa1 (poor quality and very high credit risk) in September 2013.[37][67][68] At the time, swap markets rated Ukraine's default probability over the next five years at 50%.[37] In 2013, Ukraine saw no growth in GDP.[40]
Post-Euromaidan: 2014 to present edit
Due to the loss of Ukraine's largest trading partner, Russia, over the annexation of Crimea in March 2014, and exacerbated by the war in Donbas which started in April 2014[nb 1] Ukraine's economy shrank by 6.8% in 2014.[39] It had been expected to decline by 8%.[41] A Ukrainian government report stated early in February 2016 that Ukraine's economy had shrunk by 10.4% in 2015.[70] For 2015, the National Bank of Ukraine had expected a further decline of 11.6%, and the World Bank anticipated a 12% shrinkage.[42] The World Bank forecast growth of 1% in 2016.[71]
Early in February 2014, the National Bank of Ukraine changed the hryvnia into a fluctuating/floating currency in an attempt to meet IMF requirements and to try to enforce a stable price for the currency in the Forex market.[72] In 2014 and 2015, the hryvnia lost about 70% of its value against the U.S. dollar.[61][73]
The IMF agreed to a four-year loan programme worth about $17.5 billion in eight tranches over 2015 and 2016, subject to conditions which involved economic reforms.[74] However, due to lack of progress on reforms, only two tranches worth $6.7 billion were paid in 2015. A third tranche of $1.7 billion was provisionally scheduled in June 2016 subject to the bringing into law of 19 further reform measures.[75][76] Some western analysts believed that large foreign loans were not encouraging reform, but enabling the corrupt extraction of funds out of the country.[77]
Since December 2015, Ukraine has refused to pay and hence de facto defaults on a $3 billion debt payment to Russia that formed part of a December 2013 Ukrainian–Russian action plan.[78]
The turnover of retail trade in Ukraine in 2014 shrank by 8.6% (from 2013) and shrank by 20.7% in 2015 (from 2014).[79] Ukraine saw a 30.9% decline in exports in 2015,[80] mainly because of a sharp decline in production output in Donetsk Oblast and in Luhansk Oblast (the two regions of the Donbas).[80] These two regions were responsible for 40.6% of the total export-decline rate.[80] Before the war they had been two of the more industrial oblasts of Ukraine.[40]
According to the Ministry of Economic Development and Trade, Ukraine had a surplus in its balance of payments in January–November 2015 of $566 million and has had a trade deficit of $11.046 billion during the same period in 2014.[80] On 31 December 2015, Ukraine's public debt stood at 79% of its GDP.[81] It had shrank $4.324 billion in 2015 to end up at $65.488 billion.[81] But calculated in hryvnia, the debt had grown by 42.78%.[81] In 2015, the Ministry of Social Policy of Ukraine rated 20–25% of Ukrainian households as poor.[82]
$2.526 billion entered the Ukrainian economy via remittances in 2015, 34.9% less than in 2014.[83] $431 million was sent from Ukraine to elsewhere using remittances.[83] In January 2016, Bloomberg rated Ukraine's economy as the 41st most innovative in the world,[84] down from 33rd in January 2015.[85]
In May 2016, the IMF mission chief for Ukraine, Ron van Rood, stated that reduction of corruption was a key test for continued international support.[76] In February 2016, historian Andrew Wilson assessed progress in reducing corruption as poor as of 2016.[86] Aivaras Abromavičius, Ukraine's then-Minister of Economy and Trade, resigned in February 2016, citing ingrained corruption.[87] In October of the same year, a survey of potential foreign investors conducted by Dragon Capital identified corruption and lack of trust in the judiciary as the largest obstacles to investment.[88]
Late in July 2016, the State Statistics Service of Ukraine reported that, compared with June 2015, real wages had increased by 17.3%.[89] Simultaneously the National Bank of Ukraine reported a $406 million surplus in Ukraine's January–June 2016 balance of payments against a deficit of $1.3 billion in the same period in 2015.[90] According to Ukraine's State Statistics Service, inflation in 2016 came down to 13.9%; while it had stood at 43.3% in 2015 and at 24.9% in 2014.[91]
The Economist has compared the severity of Ukraine's recession to that of the Greek recession in 2011–2012 – pointing to Ukraine experiencing an 8–9% decline in GDP from 2014 to 2015 and Greece experiencing an 8.1% decline of GDP in 2011–2012, and noted that not all areas of Ukraine were equally effected by the economic downturn. Donetsk and Luhansk (the conflict zone) saw industrial production falling by 32% and 42% respectively. On the other hand, Lviv, located over 1000 km from the conflict, posted the largest jump in employment in the nation.[92]
The economy of Ukraine has overcome[when?] the severe crisis caused by armed conflict in the eastern part of country. A 200% devaluation of the hryvnia in 2014–2015 made Ukrainian goods and services cheaper and more competitive.[93] In 2016, for the first time since 2010, the economy grew by more than 2%.[43] A 2017 World Bank statement projected growth of 2% in 2017, of 3.5% in 2018, and of 4% in 2019 and 2020.[94] Inflation in Ukraine in 2017 was 13.7% (12.4% in 2016).[95]
Since about 2015, there has been a growing number of Ukrainians working in the European Union, particularly Poland. Eurostat reported that 662,000 Ukrainians received EU residence permits in 2017, with 585,439 issued by Poland. The head of the National Security and Defence Council of Ukraine has estimated that up to 9 million Ukrainians work abroad for some part of the year, and 3.2 million have regular full-time work abroad with most not planning to return. World Bank statistics show that money remittances back to Ukraine have roughly doubled from 2015 to 2018, worth about 4% of GDP.[96][97]
In Q1 2019, China became Ukraine's largest trading partner, replacing Russia.[98][99] In Q3 2019 real GDP grew by 4.2%. The main driving factors include: increased purchasing power of the population in conditions of increase of the level of wages (during nine months of 2019 real wages increased by 9.5%); high level of business activity and preservation of investment activity, which stimulated mainly the development of construction, in particular, of industrial and transport infrastructure facilities; active consumer lending; maintaining the high dynamics of agricultural development; favourable price situation on selected world commodity markets for domestic exports and others.[100] Ukraine made its largest payment on debt in 2019 at $1.1 billion.[101]
In 2019, Fitch Ratings, a global leader in credit ratings and research, upgraded Ukraine's Long-Term foreign and National Currency Issuer Default Ratings (IDR) from "B−" to "B" and improved the outlook on the credit rating from stable to positive. Ukraine has demonstrated timely access to fiscal and external financing, improving macroeconomic stability, and declining public indebtedness.[102]
Ukraine moved up seven positions in the annual World Bank Doing Business 2020 report.[103] Prudent macroeconomic management helped reduce inflation and interest rates in 2019. Inflation eased to 4.1% at the end of 2019 and 2.4% in February 2020.[citation needed]
In 2020, Ukraine's GDP fell by 4.4%, due to the COVID-19 pandemic.[104] On 27 October 2020, the Constitutional Court of Ukraine ruled that anti-corruption legislation, including the mandatory electronic declaration of income, was unconstitutional.[105] President Volodymyr Zelenskyy warned that if parliament did not restore these anti-corruption laws, foreign aid, loans and visa-free travel to the European Union were at risk. The governor of the National Bank of Ukraine reported that Ukraine will not receive the scheduled $700 million IMF load before the end of 2020 because of the issue. IMF assessment teams had not visited Kyiv for eight months, which is necessary for further IMF loan tranches to be released.[106][107] In February 2021, economist Anders Åslund wrote "for months, senior Ukrainian officials have been claiming that the Ukrainian government has done everything the [IMF] could possibly demand" but "this happy talk was always detached from reality", and the relationship with the IMF remains critical.[108]
On 21 July 2022, Ukraine devalued the Ukrainian hryvnia by 25% against the U.S. dollar due to the economic impact of the ongoing war, to eliminate currency speculation and to improve the international competitiveness of business. The previous day it requested a two-year payment freeze on international bonds; in 2020 it had $130 billion of external debt.[109] When the 2022 Russian invasion began, Ukraine's economy was predicted by the IMF to shrink by up to 35%.[110]
Despite improvements, as in Moldova corruption in Ukraine remains an obstacle to joining the EU; the country was rated 104th out of 180 in the Corruption Perceptions Index for 2023.[111]
Economic data edit
Ukraine is subdivided into nine economic regions: Carpathian, Northwestern, Podillia, Capital, Central-Ukrainian, Northeastern, Black-Sea-Coastal, Trans-Dnipro, and Donetsk. Those regions were redrawn from the three Soviet economic regions of the Ukrainian SSR: Donetsk-TransDnieper, Southwestern, and Southern.
Main economic indicators edit
The following table shows the main economic indicators in 1992–2023. Inflation below 5% is in green.[112]
| Year | GDP
(in Bil. US$PPP) |
GDP per capita
(in US$ PPP) |
GDP
(in Bil. US$nominal) |
GDP per capita
(in US$ nominal) |
GDP growth
(real) |
Inflation rate
(in %) |
Unemployment
(in %) |
Government debt
(in % of GDP) |
|---|---|---|---|---|---|---|---|---|
| 1992 | 331.1 | 6,382.7 | 22.2 | 427.9 | n/a | n/a | n/a | n/a |
| 1993 | n/a | n/a | ||||||
| 1994 | n/a | n/a | ||||||
| 1995 | n/a | |||||||
| 1996 | n/a | |||||||
| 1997 | ||||||||
| 1998 | ||||||||
| 1999 | ||||||||
| 2000 | ||||||||
| 2001 | ||||||||
| 2002 | ||||||||
| 2003 | ||||||||
| 2004 | ||||||||
| 2005 | ||||||||
| 2006 | ||||||||
| 2007 | ||||||||
| 2008 | ||||||||
| 2009 | ||||||||
| 2010 | ||||||||
| 2011 | ||||||||
| 2012 | ||||||||
| 2013 | ||||||||
| 2014 | ||||||||
| 2015 | ||||||||
| 2016 | ||||||||
| 2017 | ||||||||
| 2018 | ||||||||
| 2019 | ||||||||
| 2020 | ||||||||
| 2021 | ||||||||
| 2022 | ||||||||
| 2023 |
Trade edit
Until recently, Russia[nb 2] was Ukraine's largest trading partner with 25.7% of exports and 32.4% of imports in 2012.[114] In 2012, 24.9% of exports and 30.9% of imports were to and from the EU.[114] In 2013, 35.9% of Ukrainian exports went to CIS countries, including eight countries other than Ukraine. Simultaneously, exports to EU countries was 26.6% of all exports.[115][116][117]
In 2015 the EU became Ukraine's largest trading partner, accounting for more than a third of its trade.[118] In 2015, Ukrainian exports to Russia had fallen to 12.7%.[80] In 2017, 14.5% of Ukraine's imports came from Russia.[4] In 2017, Ukrainian exports to Russia stood at 9%.[119] In 2017, 40% of Ukraine's exports went to the EU and 15% to CIS countries.[119] Overall Ukraine increased its exports by 20% in 2017.[119] The growth of imports was faster than the rate of export growth.[119]
In 2015, food and other agricultural products (worth $13 billion), metallurgy ($8.8 billion) and machinery ($4.1 billion) made up most of Ukraine's exports, with trade partners in 217 countries.[80][120] Exports from Ukraine in 2015 decreased by 29.3% to $38.135 billion. Imports were 31.1% down, to $37.502 billion.[120] In 2017 almost half of Ukraine's exports were provided by the agrarian complex and food industry, slightly more than 20% by metallurgy and nearly 10% by machine building products.[119]
In 2019, China replaced Russia as the largest single-nation trading partner with Ukraine achieved $50.06 billion in export and $60.78 billion in import.[98][99] Ukraine was the leading agricultural goods provider in the Chinese market.[121]
Natural gas is Ukraine's biggest import and the main cause of the country's structural trade deficit.[18]
Exports of Ukrainian goods in 2021 reached a record US$68.24 billion.[15]
List of major private owned companies, not considering banks and insurance companies edit
| Rank | Company | Home city | Revenue (₴M), 2020 | Profit (₴M), 2020 |
|---|---|---|---|---|
| 1. | Metinvest | Mariupol | 309,302 | 12,960 |
| 2. | ATB-Market | Dnipro | 123,864 | 5,769 |
| 3. | Kernel | Kyiv | 118,667 | 5,553 |
| 4. | DTEK | Kyiv | 116,046 | −13,895 |
| 5. | Fozzy Group | Kyiv | 80,167 | n/d |
| 6. | ArcelorMittal Kryvyi Rih | Kryvyi Rih | 63,497 | 741 |
| 7. | Tedis Ukraine | Odesa | 54,845 | 244 |
| 8. | Mironivsky Hliboproduct | Kyiv | 51,516 | −3,547 |
| 9. | Epicentr K | Kyiv | 50,382 | 3,171 |
| 10. | Ferrexpo | Horishni Plavni | 45,828 | 17,118 |
| 11. | Zaporizhstal | Zaporizhzhia | 45,631 | −3,678 |
| 12. | BaDM | Lviv | 41,816 | 1,112 |
| 13. | Optima-Pharm | Kyiv | 37,248 | 338 |
| 14. | Ukrnafta | Kyiv | 35,535 | 4,269 |
| 15. | Ukrtatnafta | Kremenchuk | 34,327 | 42 |
Source:[122]
The 2016 Ranking of the Top 500 companies of Central and Eastern Europe by Deloitte has come up with specific features of Ukraine's economy. More than 50% of the biggest Ukrainian companies are therefore owned by local investors whereas for the whole region this number accounts only to 15,4%. Deloitte explains the difference with the low investment attractiveness for foreign investors. Furthermore, the biggest Ukrainian companies feature a considerable higher average headcount (35’600 vs. 6’600 employees) and lower productivity (EUR 47’000 revenue per employee vs. EUR 207’000 for the whole region).[123]
Natural resources edit
Ukraine is relatively rich in natural resources, particularly in mineral deposits. Although oil and natural gas reserves in Ukraine are largely exhausted,[18] it has other important energy sources, such as coal, hydroelectricity, and nuclear-fuel raw materials.[124]
Ukrainian economy in graphics edit
-
 GDP (PPP) of Ukraine
 -
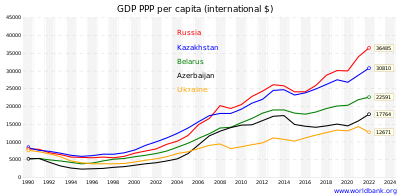 Ukraine's GDP (PPP) per capita
 -
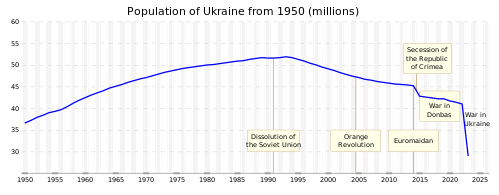 Ukraine's population from 1950
 -
 2022 GNI per capita:Ukraine (3 000 $)Higher GNI per capita compared to UkraineLower GNI per capita compared to Ukraine
 -
 Average monthly salary in November 2021 (ranks by region)


Sectors edit
Industries edit
Ukraine is home to companies operating in around 20 major industries, namely power generation, fuel, ferrous and non-ferrous metallurgy, chemical and petrochemical and gas, machine building and metal-working, forest, wood-working and wood pulp and paper, construction materials, light, food, and others.[125] Industry accounted for 26% of GDP in 2012. Ukraine has a massive high-tech industrial base, including electronics, armaments, and space programme.[126]
Mining and production edit
Ukraine is one of the world's most important mineral producing countries,[127] in terms of both the range and size of its reserves. There are nearly 8,000 separate deposits, harboring some 90 different minerals, of which about 20 are economically significant.[128] About half of all the known deposits are under exploitation. Coal reserves in Ukraine amount to 47.1 billion tons. The annual domestic demand for coal as fuel is about 100 million tons, of which 85 percent can be satisfied by domestic production.
Ukraine has oil and gas fields that meet 10 percent of her oil and 20 percent of her gas consumption, respectively. Ukraine contains natural gas reserves of 39.6 billion cubic feet (1.12 billion cubic metres), but only about 20 percent of Ukraine's demand is met by domestic production. Deposits of iron ore (estimated at 28 billion tons),[129] manganese ore (3 billion tons), chalk and limestone (1.5 billion tons) are also large in Ukraine. The domestic industrial sector suffers from constant energy shortages and energy supply payment debts totaling about $792 million at the end of 1995. Ukraine increased oil and gas production in 2023 up to 18.7 bcm.[130]
In 2019, Ukraine was the 7th largest world producer of iron ore,[131] the world's 8th largest producer of manganese,[132] 6th largest producer of titanium,[133] and 7th largest producer worldwide of graphite.[134] Ukraine was the world's 9th largest producer of uranium in 2018.[135] Ukraine supplies about 50% of the world's neon gas and 40% of its krypton, both of which are needed for the production of semiconductors.[136] It is estimated that over 90% of U.S. semiconductor-grade neon supplies are imported from Ukraine.[137]
Iron and steel edit
Ukraine is rich in mineral deposits, including iron ore (of which it once produced 50 percent of the entire Soviet output), manganese ore (of which it produced 40 percent of world output during the Soviet era), mercury, titanium,[138] and nickel.
Ukraine has a major ferrous metal industry, producing cast iron, steel, and pipes. Among its economy leading companies in that field are Metinvest, Kryvorizhstal, AzovStal, Ilyich Steel & Iron Works, and others. As of 2012, Ukraine is the world's tenth largest steel producer (according to the World Steel Association).
Chemical industry edit
Another important branch was the country's chemical industry which included the production of coke, mineral fertilizers,[139] and sulfuric acid. Production of coke droped dramandously due to the russo-ukrainian war.[140]
Defence industry edit

Ukraine's defence industry is organised around Ukroboronprom, a state owned conglomerate of over 130 companies. These companies include Soviet era giants such as Ivchenko-Progress aircraft design bureau that was opened in 1945, to newer companies such as RPC Fort which came into existence in the 1990s. Ukraine is among the top 10 arms exporters in the world.[141]
The signing of recent large contracts may put Ukraine into 6th place among biggest arms traders, after the United States, Russia, France, Germany, and Israel.[141] The output of Ukrainian defence plants grew 58% in 2009, with largest growth reported by aircraft builders (77%) and ship builders (71%).[141]
In 2013, Ukraine's defence sector manufactured a total of ₴11.7 billion worth of goods, ₴10 billion of which were exported. In the first 9 months of 2014 Ukraine's defence sector produced a record ₴13 billion worth of goods. The increase was largely due to government orders for the war in Donbas.[142]
Fuel and energy complex edit
Due to Ukraine's large population and its significant energy consumption, it is one of the largest energy markets on the European continent. Ukraine's location at the intersection of Europe, Russia, the Black Sea, and the Caspian Sea provides its ample natural resources such as coal, oil, natural gas, as well as significant potential for hydro and biomass energy.[143]
Ukraine relies heavily on imports for natural gas and oil products. It is a key transit site for European imports of Russian gas.[143][144] Ukraine transits more natural gas than any other country.[143] Prior to the full-scale Russian invasion of Ukraine in 2022, economic crises, Russia's closure of its market, and the escalating Russo-Ukrainian conflict in eastern Ukraine since 2014 had stymied some of the country's growth. Ukraine's energy policy has created incentives for investment in renewable energy sources, but these remain uncertain. Since 2015, Ukrainian energy policy has favoured reducing natural gas subsidies alongside diversifying energy supply. Ukraine participates in the European Union's EU4Energy Programme, an effort to promote evidence-based policy making in national energy sectors.[144]
Fuel industry edit
Ukraine remains heavily reliant on oil product and gas imports.[143] Russia ranks as Ukraine's principal supplier of oil, and Russian firms own and/or operate the majority of Ukraine's refining capacity. Natural gas imports come from Russia – which delivers its own gas, as well as the gas from Turkmenistan.[citation needed]
Ukraine has been a key transit point for EU imports of Russian gas,[144] and its pipeline system has been a crucial player in European energy supply, despite recent diversification of transit routes by Russian oil companies such as Gazprom.[143] Since the 2014 Russia–Ukraine gas disputes, the latter's dependence on Russian gas supplies has dramatically affected its economics and foreign policy.[citation needed]
Ukraine is independent in its electricity supply, and exports electricity to Russia and other countries of Eastern Europe. This is achieved through a wide use of nuclear power and hydroelectricity. Recent energy strategy intends a gradual decreasing of gas- and oil-based generation in favour of nuclear power, as well as energy saving measures including lower industrial gas consumption. Reform of the still inefficient and opaque energy sector is a major objective of the International Monetary Fund (IMF) and World Bank programs with Ukraine.[citation needed]
Ukraine was a partner country of the European Union's INOGATE energy programme, which had four key topics: enhancing energy security, convergence of member state energy markets on the basis of EU internal energy market principles, supporting sustainable energy development, and attracting investment for energy projects of common and regional interest. INOGATE was discontinued in 2016.[145]
Automotive industry edit

Ukraine automobile manufacturers produces diesel locomotives, tractors, trucks, buses, trolleybuses, own-designed cars and trams. There are 12 automobile manufacturers in Ukraine, including ZAZ, LuAZ, Bogdan, KrAZ, Eurocar, Electron, and LAZ.
ZAZ (Zaporizhzhia Automobile Building Plant) is the main automobile-manufacturer of Ukraine, based in the south-eastern city of Zaporizhzhia. Passenger car manufacturing in Ukraine started in 1959. From 1960 to 1994, a total of 3,422,444 Zaporozhets vehicles were manufactured in Zaporizhzhia and engines with air-cooling in Melitopol. In 2011–2012, the Zaporizhzhia Automobile Building Plant started serial full-scale production of two new models of vehicle, the ZAZ Forza (a re-badged Chinese Chery A13) and the ZAZ Vida (a re-badged Daewoo Aveo).
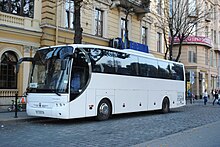
The Bogdan Corporation is a leading Ukrainian automobile-manufacturing group, including several car- and bus-makers of Ukraine. Bogdan buses (re-badged Isuzu models) are used as the primary small buses in most Ukrainian cities.[146]
LAZ is one of the major bus manufacturers in Ukraine. It manufactures city buses, coach buses, trolley buses, and special purpose buses.
The Lviv-based company Electrontrans is an enterprise of a full-scale production, specialising in design and production of modern urban electric transport – trams, trolleybuses, electric buses, units, and spare parts. In 2013 Electrotrans starts producing low-floor trams, the first Ukrainian 100% low-floor tramways.[147]
Aircraft and aerospace industry edit
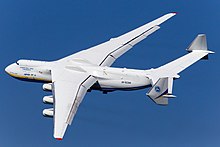
Ukraine is one of nine countries with a full cycle of aerospace hardware engineering and production[citation needed]. Besides the design and production of passenger and transportation aircraft, Ukraine has a network of aircraft repair enterprises, including companies involved in the recovery of military planes and helicopters.[citation needed] In March 2007, the Cabinet of Ministers of Ukraine created the state aircraft building concern Aviation of Ukraine (SACAU), which is governed by the Ministry of Industrial Policy. Production of An-148 aircraft is now one of the most prospective projects for the Ukrainian plane manufacturing industry with 35 units manufactured since 2009 (together with Russian production).
The aircraft were engineered by the Antonov Scientific and Production Complex Design Office (Antonov ANTK). The largest single airplane in the world, Antonov An-225 Mriya was designed by Antonov ANTK and made in 1988. The gross production of light and ultra light planes in Ukraine does not exceed 200 units per annum. Production of hang-gliders and paragliders of all designs makes nearly 1,000 units each year. Most of produced devices are exported. The main buyers of Ukrainian-made ultra-light aircraft are the United States, Australia, New Zealand, the United Kingdom, France, etc..
Since 2014, aerospace industry revenues have fallen by 80%.[148] In June 2016, the Antonov Corporation merged with the state-owned military conglomerate Ukroboronprom, forming Ukrainian Aircraft Corporation within its structure. This merger was done to boost Antonov profits and the production rate.[149] Currently, Antonov is working on two cargo planes: the An-178,[150] a cargo version of the An-158, and the An-132D, a redesigned version of the An-32.[151] The An-132 is developed jointly with Saudi's Taqnia Aeronautics Company, featuring western avionics and engines. The roll out and first flight is due at the beginning of January 2017.
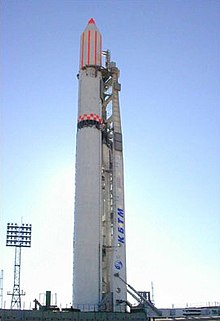
The space rocket industry in Ukraine has been managed by the State Space Agency of Ukraine since 1992. The agency includes 30 enterprises, scientific research institutes, and design offices. Pivdenne Design Bureau is in general responsible for creating the Zenit-3SL carrier rocket. The National Space Agency of Ukraine is involved in cooperation with American Rockwell Int., as well as the Sea Launch project.[152] The first stage core of the U.S. Orbital ATK Antares rocket was designed and is manufactured in Ukraine by Yuzhnoye SDO.[153]
Shipbuilding edit

Ukraine is one of the 10 largest shipbuilding countries in Europe. There are 49 shipbuilding companies registered in Ukraine. They are able to build a wide range of vessel types: powerboats, barges, bulk carriers (dry cargo ship), tankers, liquefied gas carriers, etc.[154][155]
The USSR's collapse put Ukraine's shipbuilding into a long-term decline. This lasted until 1999 and was mostly due to a minimum volume of state shipbuilding orders. Between 1992 and 2003, Ukraine's 11 shipyards produced 237 navigation units for a total value of US$1.5 billion. Production facilities are not working near full capacity, and customers are not always timely in paying for services. The shipbuilding industry grew between 2000 and 2006, in line with the wider Ukrainian economic expansion at the time.[154][155]
State support and the opening of free economic zones, foremost at enterprises based in Mykolaiv were a crucial recent development in Ukraine's shipbuilding industry. Within the Mykolaiv Special Economic Zone, enterprises like Damen Shipyards Okean, Chornomorskyi (Black Sea) Shipbuilding Plant, 61 Communards Shipbuilding Plant, as well as the Veselka (Rainbow) paint and insulation enterprise are implementing investment projects targeted to raise efficiency and quality in primarily export-oriented vessels through production upgrades. The new engineering developments and high potential of Ukrainian designers provide the ability to build high quality vessels with competitive prices.[154][155]
Agriculture edit


Although typically known as the industrial base of the Soviet Union, agriculture is a large part of Ukraine's economy. Ukraine is one of the world's largest agricultural producers and exporters and is known as the breadbasket of Europe.[156]
In 2008, agriculture accounted for 8.29% of Ukraine's GDP and by 2012 had grown to 10.43% of the GDP. Agriculture accounted for $13.98 billion of value added to the economy of Ukraine in 2012. Despite being a top 10 world producer of several crops such as wheat and corn Ukraine still only ranks 24 out of 112 nations measured in terms of overall agricultural production.[157][158]
Ukraine is the world's largest producer of sunflower oil,[159] a major global producer of grain and sugar, and future global player on meat and dairy markets. It is one of the largest producers of nuts. Ukraine produces more natural honey[160] than any other European country and is one of the world's largest honey producers. An estimated 1.5% of its population is involved in honey production, therefore Ukraine has the highest honey per capita production rate in the world.[161] Because Ukraine possesses 30% of the world's richest black soil, its agricultural industry has a huge potential. Farmland remains the only major asset in Ukraine that is not privatised.[162]
The agricultural industry in Ukraine is already highly profitable, with 40–60% profits,[162] but according to analysts its outputs could still rise up to fourfold.[163] Ukraine is the world's 6th largest, 5th if not including the EU as a separate state, producer of corn in the world and the 3rd largest corn exporter in the world. In 2012 Ukraine signed a contract with China, the world's largest importer of corn, to supply China with 3 million tonnes of corn annually at market price. The deal included a $3 billion line of credit extension from China to Ukraine.[164][165]
In 2014, Ukraine's total grain crop was estimated to be a record 64 million metric tons. In 2014, Ukraine lost de facto control over portions of several regions after those regions declared independence from Ukraine, resulting in the war in Donbas and the annexation of Crimea by the Russia,[nb 3] hence the actual available crop yield was closer to 60.5 million metric tons. Due to the decline of the metallurgy industry, Ukraine's prior top export category, as a result of the war in Donbas agricultural products accounted for Ukraine's largest export category.[167]
In March 2020, Ukraine's parliament lifted a ban on the sale of farmland.[168] The land market was fully opened for the first time independence on 1 July 2021.[169][156]

Ukraine also produces some wine, mostly in the South-Western regions.
In 2018:
- It was the 5th largest world producer of maize (35.8 million metric tons (35,200,000 long tons; 39,500,000 short tons)), after the U.S., China, Brazil and Argentina;
- It was the 8th largest world producer of wheat (24.6 million metric tons (24,200,000 long tons; 27,100,000 short tons));
- It was the 3rd largest world producer of potatoes (22.5 million metric tons (22,100,000 long tons; 24,800,000 short tons)), second only to China and India;
- It was the world's largest producer of sunflower seed (14.1 million metric tons (13,900,000 long tons; 15,500,000 short tons));
- It was the 7th largest world producer of sugar beets (13.9 million metric tons (13,700,000 long tons; 15,300,000 short tons)), which is used to produce sugar and ethanol;
- It was the 7th largest world producer of barley (7.3 million metric tons (7,200,000 long tons; 8,000,000 short tons));
- It was the 7th largest world producer of rapeseed (2.7 million metric tons (2,700,000 long tons; 3,000,000 short tons));
- It was the 13th largest world producer of tomatoes (2.3 million metric tons (2,300,000 long tons; 2,500,000 short tons));
- It was the 5th largest world producer of cabbage (1.6 million metric tons (1,600,000 long tons; 1,800,000 short tons)), after China, India, South Korea, and Russia;
- It was the 11th largest world producer of apples (1.4 million metric tons (1,400,000 long tons; 1,500,000 short tons));
- It was the 3rd largest world producer of pumpkins (1.3 million metric tons (1,300,000 long tons; 1,400,000 short tons)), second only to China and India;
- It was the 6th largest world producer of cucumbers (985 thousand metric tons (969,000 long tons; 1,086,000 short tons));
- It was the 5th largest world producer of carrots (841 thousand metric tons (828,000 long tons; 927,000 short tons)), after China, Uzbekistan, the U.S., and Russia;
- It was the 4th largest world producer of dry peas (775 thousand metric tons (763,000 long tons; 854,000 short tons)), second only to Canada, Russia, and China;
- It was the 7th largest world producer of rye (393 thousand metric tons (387,000 long tons; 433,000 short tons));
- It was the 3rd largest world producer of buckwheat (137 thousand metric tons (135,000 long tons; 151,000 short tons)), second only to China and Russia;
- It was the 6th largest world producer of walnuts (127 thousand metric tons (125,000 long tons; 140,000 short tons));
- It produced 4.4 million metric tons (4,300,000 long tons; 4,900,000 short tons) of soy;
- It produced 883 thousand metric tons (869,000 long tons; 973,000 short tons) of onions;
- It produced 467 thousand metric tons (460,000 long tons; 515,000 short tons) of grapes;
- It produced 418 thousand metric tons (411,000 long tons; 461,000 short tons) of oats;
- It produced 396 thousand metric tons (390,000 long tons; 437,000 short tons) of watermelons;
- It produced 300 thousand metric tons (300,000 long tons; 330,000 short tons) of cherries;
In addition to smaller productions of other agricultural products.[170]
Professionalised, scientific breeding of barley began in 1910 and now supplies improved cultivars to the country.[171]: 34
Information technology edit

Ukraine has a long-standing reputation as a major technology region, with a well-developed scientific and educational base. In March 2013 Ukraine ranked 4th in the world in number of certified IT professionals after the United States, India, and Russia.[172] On top of that, experts recognised both the quantitative and qualitative potential of Ukrainian specialists. In 2011, the number of IT specialists working in the industry reached 25,000 people with 20% growth.[173] The volume of the Ukrainian IT market in 2013 was estimated to be up to 3.6 billion U.S. dollars.[172][174]
In 2017, Ukraine emerged as the top outsourcing destination of the year, according to the Global Sourcing Association. By 2017, there were 13 research and development centres of global companies located in Ukraine, including Ericsson Ukraine, in Lviv.[175][176]
As for 2019 the number of IT specialists involved in the IT industry of Ukraine reached 172,000 people.[177] The share of IT industry in Ukraine's GDP is 4%.[176]
According to the IT sector report 2019 Ukraine is the largest exporter of IT services in Europe and ranks among the 25 most attractive countries for software development worldwide.[178]
Infrastructure edit
Maritime edit
About 100,000 Ukrainians regularly work on foreign merchant ships, one of the largest group of Ukrainian labour migrants and the sixth largest number of sailors from any country.[179] They are attracted by the high salaries of more than $1,000 per month.[179]
Every major Ukrainian coastal city has a maritime university.[179]
Communications edit
Ukraine ranks eighth among the world's nations in terms of the Internet speed with the average download speed of 1,190 kbit/s.[180] Five national providers of fixed (DSL, ADSL, XDSL) internet access — Ukrtelecom, Vega Telecom, Datagroup, Ukrnet, Volia, and 5 national operators of mobile internet – MTS, Kyivstar, PEOPLEnet, Utel, and Intertelecom are currently operating in Ukraine. Every regional centre and large district centre has a number of local providers and home networks.
2011 revenues from Internet service providing in Ukraine reached ₴ 4.75 bn[181]
Over 16 million Ukrainians had Internet access in 2012, growing to 22 million in 2015.[182][183] In Kyiv, 90% of the population had internet access.
The mobile-cellular telephone system's expansion has slowed, largely due to saturation of the market which has reached 144 mobile phone subscriptions per 100 people.[184]
Tourism edit

In 2012, Ukraine was the 8th most popular tourism destination in Europe with 23 million visitors.[185] The country's tourism industry is generally considered to be underdeveloped, but it does provide crucial support for Ukraine's economy. In 2012, the contribution of tourism to the GDP amounted to 28.8 billion ₴, or 2.2% of GDP and directly supported 351,500 jobs (1.7% of total employment).[186][187]
Shopping tourism edit
Ukraine's neighbours (Poles, Slovaks, Hungarians, Belarusians and even Russians) are known to come to Ukraine to purchase products and presents, such as food or gasoline, that are cheaper in Ukraine than in their home countries.[188]
Recreational tourism and sightseeing edit
Ukraine has impressive landscapes, ruins of ancient castles, historical parks, vineyards where they produce native wines, unique structures such as Saint Sophia Cathedral or Chersonesos. Officially, there are seven World Heritage Sites in Ukraine. The Carpathian Mountains suitable for skiing, hiking, fishing and hunting. Bukovel — is the largest ski resort in Ukraine situated in the Ivano-Frankivsk Oblast (province) of western Ukraine. The 2010–2011 winter season recorded 1,200,000-day visits with foreigners amounting to 8–10% of all visitors. In 2012 the Bukovel was named the fastest growing ski resort worldwide. The coastline on the Black Sea is a popular summer destination for vacationers, especially Odesa.
Financing, banking, investments edit

Investments edit
A political crisis in the middle of 2006 was feared as a threat to economic and investment stability, however, despite the forecasts, the political situation has not scared investors. The GDP showed a good growth rate of 7% in 2007, compared to the previous year. Industrial output has increased. Car sales have soared, while the banking sector has expanded, thanks to the arrival of European banks.
International financial institutions edit
In 1992, Ukraine became a member of the IMF and the World Bank.[189] It is also a member of the European Bank for Reconstruction and Development.
In 2008, the country joined World Trade Organization. Ukraine applied for WTO membership in 1993, but its accession process was stalled for 15 years.
Foreign direct investment edit
To encourage foreign trade and investment, the Ukrainian Parliament approved a foreign investment law allowing foreigners to purchase businesses and property, to repatriate revenue and profits, and to receive compensation if the property is nationalised by a future government. Complex laws and regulations, poor corporate governance, weak enforcement of contract law by courts, and corruption, continued to prevent direct large-scale foreign investment in Ukraine. There is a functioning stock market, but portfolio investment activities have been restricted by a historic lack of protection of shareholders' rights.[citation needed]
As of April 2011 total foreign direct investment stock in Ukraine stood at $44.7 billion.[190] Statistics from FDi Magazine show that Ukraine suffered a year on year decline in foreign direct investment between 2010 and 2013.[191]
State enterprise InvestUkraine was created[192] under the State Agency for Investment and National Projects (National Projects)[193] to serve as a one-stop stop for investors and to deliver investment consulting services.
Ukraine signed a shale gas exploration deal with Royal Dutch Shell on 25 January 2013.[194] The $10 billion deal was the largest foreign direct investment ever for Ukraine.[194]
Many companies, owned by foreigners, have been successfully operating in Ukraine since its independence. These include companies in agriculture, such as Kyiv-Atlantic Group, founded in 1994 by David Sweere. He sold its business in Minnesota and invested in Ukraine, believing in its huge potential. The company has been operating at a profit since 2002. As a result, he became the fifth richest among the Westerners who made their fortune in Ukraine.[195]
In 2016, foreign direct investment in Ukraine's economy amounted to $3.8 billion in 2016, which was almost twice more than in 2015.[196]
Monetary policy and banking edit
Stock exchange edit
Insurance business and companies edit
Legal environment and economic support edit
Background edit
Since the late 1990s, the Ukrainian government has pledged to reduce the number of government agencies, streamline the regulatory process, create a legal environment to encourage entrepreneurs, and enact a comprehensive tax overhaul.[197] In 2003, the IMF encouraged Ukraine to quicken the pace and scope of reforms, threatening to withdraw financial support.[198]
On 24 June 2010, Ukraine's Foreign Minister Kostyantyn Hryshchenko signed a free trade agreement with the European Free Trade Association (EFTA).[199] According to the Global Competitiveness Report of 2012–2013, "the country's most important challenge is the needed overhaul of its institutional framework, which cannot be relied on because it suffers from red tape, lack of transparency, and favouritism."[200] In reports by the Kyiv Post in 2010 and 2011 respectively, a "double taxation avoidance" treaty with Cyprus signed in 1982 by the Soviet Union has cost Ukraine billions of U.S. dollars of tax revenues.[201][202]
The 2014 campaign of lustration in Ukraine was criticised by Mark Varga, writing in The National Interest as it might have adverse economic effects.[203] On 29 May 2014, Ukraine entered into the European Union–Ukraine Association Agreement,[204] that reached its full application on 1 September 2017.[205]
Foreign workers edit
A number of foreign guest workers come to work in Ukraine, mainly in seasonal farm work and construction industry, especially from neighbouring Moldova and Belarus.[206]
Environmental issues edit
Ukraine is interested in cooperating on regional environmental issues. Conservation of natural resources is a stated high priority, although implementation suffers from a lack of financial resources. Ukraine established its first nature preserve, Askania-Nova, in 1921 and has programs to breed endangered species.[207]
Ukraine has a Ministry of Environment[208] and has introduced a pollution fee system that levies taxes on air and water emissions and solid waste disposal. The resulting revenues are channelled to environmental protection activities, but enforcement of this pollution fee system is lax. Industrial pollution remains a considerable problem in Ukraine.
Significant environmental problems result from the Chernobyl nuclear power plant disaster in 1986. In accordance with its previously announced plans, Ukraine permanently closed the Chernobyl Atomic Energy Station in December 2000.[209] In November 2001, Ukraine withdrew an application it had made to the EBRD for funding to complete two new reactor units to compensate for the energy once produced by Chernobyl. Ukrainian concern over reform conditions attached to the loan – particularly tariff increases needed to ensure loan repayment—led the Ukrainian government to withdraw the application on the day the EBRD Board was to have considered final approval.
The russo-ukrainian war impacts the environmental situation a lot. 36.000 tons of waste, including toxic chemicals copper and zinc, got into the water bodies causing dangers to human organs and the nervous system. 3mio hectares of forests need to be demined and forestfires caused by shelling, occur on 30% of the countries forest area. The war causes the release of round about 67,532,788 tons of hazardous emissions causing respiratory and cardiovascular issues.[210]
Climate crisis edit
11,867,946 tons of atmospheric emissions are the result of the war by the end of February 2024.[211]
Ukrainian companies edit
In 2022, the sector with the highest number of companies registered in Ukraine is Services with 512,393 companies followed by Wholesale Trade and Manufacturing with 288,072 and 93,637 companies respectively.[212]
- 1+1 Media Group – media
- 4AGames – Technology
- Antonov – Industrials
- APEKS-BANK – Financials
- ATB-Market – Consumer Services
- BG Capital – Financials
- Bogdan group – Industrials
- Chumak – Consumer goods
- Ciklum – IT
- DTEK – Oil & Gaz, Basic Materials, Utilities
- EKTA – Technology
- Electron – Industrials
- Epicentre K – Consumer services
- ESTA Holding – Financials
- FED – Aerospace industry
- Ferreexpo – Basic Materials
- FOM-Ukraine – Industrials
- Fozzy Group – Consumer services
- Galnaftogaz – Oil & Gas
- GSC Game World – Technology
- Hromadske.ua – Media
- Industrial Union of Donbas – Industrials
- InvestUkraine – Industrials
- Kryukiv Railway Car Building Works – Industrials
- Kyivstar – Telecommunications
- Kuznia na Rybalskomu – Shipbuilding, arms industry
- Lifecell – Telecommunications
- METRO Cash&Carry – Consumer services
- MHP – Consumer goods
- Motor Sich – Industrials
- Nemiroff – Consumer goods
- Naftogaz – Oil & Gas
- Nibulon – Agriculture & Shipbuilding
- Obolon – Consumer goods
- Oschadbank – banking
- PrivatBank – banking
- Roshen – Consumer goods
- SCM Holdings – Financials
- SoftServe – IT
- Ukraine International Airlines – Consumer services
- Ukrainian Automobile Corporation – Consumer goods
- Ukrainian Railways – Consumer services, Industrials
- Ukrnafta – Oil & Gas
- Ukroboronprom
- Ukrtelecom – Telecommunications
- Vodafone Ukraine – Telecommunications
- WOG – Oil & Gas, Consumer services
- Pivdenmash – Industrials
- Zaporizhstal – Basic materials
- ZAZ – Consumer goods
Facts and figures edit
Household income or consumption by percentage share:
Poverty rate: 4% in 2018 (below US$5.5/day).[214]
Industrial production growth rate: 6% (2007 est.),[213] 6.5 (2008)[215][nb 4]
Electricity:
- production: 192.1 billion kWh (2006)
- consumption: 181.9 billion kWh (2006)
- export: 10.07 billion kWh (2005)
- import: 20 billion kWh (2006)
Electricity – production by source:
- fossil fuel: 48.6%
- hydro: 7.9%
- nuclear: 43.5%
- other: 0% (2001)
Oil:
- production: 90,400 barrels per day (14,370 m3/d) (2006)
- consumption: 284,600 barrels per day (45,250 m3/d) (2006)
- exports: 214,600 barrels per day (34,120 m3/d) (2004)
- imports: 469,600 barrels per day (74,660 m3/d) (2004)
- proved reserves: 395,000,000 barrels (62,800,000 m3) (1 January 2006 est.)
Natural gas:
- production: 20.85 billion cubic m (2006 est.)
- consumption: 73.94 billion cubic m (2006 est.)
- exports: 4 billion cubic m (2006 est.)
- imports: 57.09 billion cubic m (2006 est.)
- proved reserves: 1.075 trillion cubic m (1 January 2006 est.)
Agriculture – exports: grain, sugar beets, sunflower seeds, vegetables, beef, milk, natural Honey.
Agriculture – imports: seafood, pork, beef, grain
Exchange rates: hryvnia per US$1 – 22 (2015), 7.97 (2009), 5.05 (2007), 5.05 (2006), 5.13 (2005), 5.33 (May 2004), 5.30 (October 2002), 5.59 (February 2000), 5.3811 (January 2000), 4.1304 (1999), 2.4495 (1998), 1.8617 (1997), 1.8295 (1996), 1.4731 (1995)
Minimum wage: ₴6,000/ ~$210 per month (from 2021 to 2001–01)
Average salary by region
See also edit
Notes edit
- ^ In April 2014 pro-Russian protest escalated into the war in Donbas between the Ukrainian government and the separatist forces of the self-declared Donetsk People's Republic and Luhansk People's Republic.[39][69]
- ^ Both Russia and Ukraine were part of the Soviet Union since 1922 till Ukraine declared its independence from the Soviet Union on 24 August 1991, and before 1917 they were both part of the Russian Empire.[113]
- ^ Crimea is currently under dispute by Russia and Ukraine.[166]
- ^ The data for the 2009 fiscal year is missing due to the fact that State Statistics Service of Ukraine is transitioning for the international standards of accounting.
References edit
- ^ "World Economic Outlook Database, April 2019". IMF.org. International Monetary Fund. Retrieved 29 September 2019.
- ^ "World Bank Country and Lending Groups". datahelpdesk.worldbank.org. World Bank. Retrieved 29 September 2019.
- ^ a b c d e f g h "World Economic Outlook Database, October 2023". IMF.org. International Monetary Fund. Retrieved 12 February 2023.
- ^ a b c d e f "The World Factbook". CIA.gov. Central Intelligence Agency. Retrieved 23 March 2019.
- ^ "Poverty headcount ratio at national poverty lines (% of population) – Ukraine". data.worldbank.org. World Bank. Retrieved 24 January 2020.
- ^ Europe Central Asia Economic Update, Spring 2020: Fighting COVID-19. Washington, DC: World Bank. 2020. pp. 77–78. ISBN 978-14648-1-564-5.
- ^ "GINI index (World Bank estimate)". data.worldbank.org. World Bank. Retrieved 21 March 2020.
- ^ "Human Development Index (HDI)". hdr.undp.org. HDRO (Human Development Report Office) United Nations Development Programme. Retrieved 11 December 2019.
- ^ "Inequality-adjusted HDI (IHDI)". hdr.undp.org. UNDP. Retrieved 7 September 2020.
- ^ "Labor force, total – Ukraine". data.worldbank.org. World Bank & ILO. Retrieved 7 September 2020.
- ^ "Employment to population ratio, 15+, total (%) (national estimate) – Ukraine". data.worldbank.org. World Bank. Retrieved 16 October 2019.
- ^ "Средняя зарплата в Украине в апреле 2024 составила 21809 грн". index.minfin.com.ua.
- ^ "Середня зарплата в Україні" [Average salary in Ukraine] (in Ukrainian). Work.ua. Retrieved 20 December 2023.
- ^ "Ukraine – Individual – Taxes on personal income".
- ^ a b "Cabinet of Ministers of Ukraine – Ministry of Economy: Exports of Ukrainian goods in 2021 have reached a record USD 68.24 billion". www.kmu.gov.ua.
- ^ "Export partners of Ukraine". The Observatory of Economic Complexity. Retrieved 6 April 2023.
- ^ "State Committee of Commerce and Industry. Foreign economic activity" (PDF).
- ^ a b c Sarna, Arkadiusz (15 July 2013). "Kyiv's gas strategy: closer cooperation with Gazprom or a genuine diversification". Centre for Eastern Studies. Archived from the original on 23 October 2013.
- ^ "Import partners of Ukraine". The Observatory of Economic Complexity. Retrieved 6 April 2023.
- ^ "Регіональні обсяги зовнішньої торгівлі товарами у січні–листопаді 2018 року". www.ukrstat.gov.ua.
- ^ "Регіональні обсяги зовнішньої торгівлі послугами1 за 9 місяців 2018 року". www.ukrstat.gov.ua.
- ^ https://www.bank.gov.ua/control/en/publish/category?cat_id=44466 Archived 18 June 2018 at the Wayback Machine, National Bank of Ukraine Retrieved 18 June 2018.
- ^ "Report for Selected Countries and Subjects". IMF.org. International Monetary Fund. 2017. Retrieved 21 December 2018.
- ^ a b "Budget of Ukraine". Archived from the original on 25 November 2015. Retrieved 17 February 2016.
- ^ "Rating: Ukraine Credit Rating 2023". countryeconomy.com. Retrieved 12 April 2023.
- ^ "S&P cuts Ukraine's foreign currency rating to CCC due to debt restructuring plan". Yahoo! News. 7 April 2023.
- ^ "S&P cuts Ukraine's foreign currency rating to CCC due to debt restructuring plan". The New Voice of Ukraine. 7 April 2023.
- ^ "Moody's downgrades Ukraine's ratings to Ca with a stable outlook". Moody's. 10 February 2023.
- ^ "Fitch Affirms Ukraine at 'CC'". Fitch Ratings. 20 January 2023.
- ^ "Scope affirms Ukraine's foreign-currency issuer ratings at CC and maintains Negative Outlook".
- ^ "Ukraine's International Reserves Increased by USD 0.3 Billion in July". National Bank of Ukraine.
- ^ Ukraine. Macroeconomic indicators Archived 25 August 2010 at the Wayback Machine National Bank of Ukraine
- ^ "Ukraine becomes world's third biggest grain exporter in 2011 – minister" (Press release). Black Sea Grain. 20 January 2012. Archived from the original on 4 March 2014. Retrieved 3 September 2015.
- ^ "World Trade Report 2013". World Trade Organisation. Retrieved 26 January 2014.
- ^ a b c d e f g h i j k l m The Underachiever: Ukraine's Economy Since 1991, Carnegie Endowment for International Peace (9 March 2012)
- ^ Liventseva, Hanna (17 May 2022). "THE MINERAL RESOURCES OF UKRAINE". Tierra y Tecnología (in Spanish). Retrieved 17 March 2023.
- ^ a b c d Big debts and dwindling cash: Ukraine tests creditors' nerves, Reuters (17 October 2013)
- ^ a b Russia sets off trade war to prevent Ukraine from signing agreement with EU, says UDAR. Kyiv Post. 14 August 2013.
"Ukraine Leader Ignores Putin Warning on EU Path". Voice of America. 24 August 2013. Archived from the original on 4 March 2016. Retrieved 1 September 2013.
"Russia hits at Ukraine with chocolate war". EurActiv. 14 August 2013. Retrieved 1 September 2013.
"Trading insults". The Economist. 24 August 2013. Retrieved 1 September 2013.
"Putin warns Ukraine against EU pact". euobserver. 23 August 2013. Archived from the original on 27 August 2013. Retrieved 1 September 2013.
"Ukraine PM tells Russia to accept "reality" of EU trade deal". Reuters. 28 August 2013. Retrieved 1 September 2013.
"Putin 'deserves medal' for pushing Ukraine towards EU". Euractiv. 30 August 2013. Retrieved 1 September 2013.
"О комплексе мер по вовлечению Украины в евразийский интеграционный процесс". Зеркало недели. Украина. 16 August 2013. Archived from the original on 30 August 2013. Retrieved 1 September 2013.
Does Russia Have a Secret Plan for Ukraine?, The Atlantic (21 August 2013)
Caught in a Zeitnot Archived 10 February 2016 at the Wayback Machine, The Ukrainian Week (6 August 2013) - ^ a b c Leonard, Peter (14 April 2014). "Ukraine to deploy troops to quash pro-Russian insurgency in the east". Yahoo News Canada. Associated Press. Archived from the original on 14 April 2014. Retrieved 26 October 2014.
- ^ a b c d Amid staggering destruction, eastern Ukraine looks to rebuild, Al Jazeera (28 September 2014)
- ^ a b "Ukraine economy expected to shrink 8%". Yahoo. 2 October 2014.
Ukraine's Economy Contracted By 6.8 Percent In 2014, RFE/RL (20 March 2015) - ^ a b Ukraine conflict taking heavy toll on economy says IMF, Radio Svoboda (30 October 2015)
- ^ a b Ukraine's Economy is Recovering Modestly Despite Significant Headwinds, World Bank (4 April 2017)
- ^ "GDP per capita (Current US$) | Data".
- ^ Bullough, Oliver (6 February 2015). "Welcome to Ukraine, the most corrupt nation in Europe". The Guardian. Retrieved 3 March 2021.
Since 1991, officials, members of parliament and businessmen have created complex and highly lucrative schemes to plunder the state budget. The theft has crippled Ukraine. The economy was as large as Poland's at independence, now it is a third of the size. Ordinary Ukrainians have seen their living standards stagnate, while a handful of oligarchs have become billionaires.
- ^ "Ukraine: Can meaningful reform come out of conflict?". Bruegel | The Brussels-based economic think tank. Retrieved 17 March 2023.
- ^ Pikulicka-Wilczewska, Agnieszka (19 July 2017). "Why the reforms in Ukraine are so slow?". New Eastern Europe – A bimonthly news magazine dedicated to Central and Eastern European affairs. Retrieved 17 March 2023.
- ^ "The slow-reform trap". Bruegel | The Brussels-based economic think tank. Retrieved 17 March 2023.
- ^ "Ukraine Country Assistance Evaluation" (PDF). 8 November 2000.
- ^
Kaplan, Temma (2014). Democracy: A World History. New Oxford World History. New York: Oxford University Press. ISBN 9780199929962. Retrieved 9 November 2018.
Greece consisted of discrete enclaves on which agriculture was difficult and residents turned to the sea for their livelihood. [...] Athens could not have survived without grain from Ukraine, one reason that Athens feared Persian movements toward the Dardanelles, the Bosporus, and the Black Sea, and maybe the main reason Athens extended so many rights of participatory democracy to lower-class male citizens who served in its navy.
- ^
Havrylyshyn, Oleh (2016). "Nature of the Economy before Independence". The Political Economy of Independent Ukraine: Slow Starts, False Starts, and a Last Chance?. Studies in Economic Transition. London: Springer. p. 18. ISBN 9781137576903. Retrieved 9 November 2018.
From the mid-1500s one saw the second historical period of European orientation as 'increasing demand for grain on the European markets [led to] Ukraine earning its reputation as the breadbasket of Europe'.
- ^
Havrylyshyn, Oleh (2016). "Nature of the Economy before Independence". The Political Economy of Independent Ukraine: Slow Starts, False Starts, and a Last Chance?. Studies in Economic Transition. London: Springer. p. 24. ISBN 9781137576903. Retrieved 9 November 2018.
In the 1860s and 1870s a major shift in economic structure began as czarist policy turned to promote modern industrialization [...]. [...] A huge government-supported program of railroad building began, followed by policies to attract foreign investors to develop metallurgy in the coal- and iron-rich areas of the South-East.
- ^ "Verkhovna Rada of Ukraine Resolution On Declaration of Independence of Ukraine". Verkhovna Rada of Ukraine. 24 August 1991. Archived from the original on 30 September 2007. Retrieved 12 September 2007.
- ^ a b c d e f g h i j k Why is Ukraine's economy in such a mess?, The Economist (5 Mar 2014)
- ^ President's Decree dated 26 August 1996, published on 29 August
- ^ "Economic Analysis and Evaluation – Publications & Reports". web.worldbank.org.
- ^ Human Development Report 2009 [HDR 2009 Statistical Tables]
- ^ Unconventional Gas Reservoirs: Evaluation, Appraisal, and Development by M. Rafiqul Islam, Gulf Publishing Company, Published: 7 November 2014, ISBN 0128003901 (page 34)
- ^ a b Reforming the Ukrainian Economy under Yanukovych: The First Two Years, Carnegie Endowment for International Peace (2 April 2012 )
- ^ "Ukraine and Russia reach gas deal". BBC News. 4 January 2006. Retrieved 17 December 2008.
- ^ a b US Dollar ($) ⇨ Ukrainian Hryvnia (UAH), Google Finance
- ^ Unemployment lower in Ukraine against EU countries Archived 16 July 2011 at the Wayback Machine – UKRINFORM, 12 January 2009
- ^ a b c Ukraine Economy – GDP real growth rate. CIA World Factbook
- ^ Ukraine – Macroeconomic situation – April 2010, UNIAN (19 May 2010)
- ^ N. Korolevskaya: Ukraine Needs a Single Anti-Corruption Project Archived 3 March 2016 at the Wayback Machine, Foundation for Effective Governance
- ^ Azarov: Shadow trade accounts for 40% of domestic market Archived 9 June 2012 at the Wayback Machine, Interfax Ukraine (7 December 2011)
- ^ "Ratings Definitions". moodys.com. Moody's Investors Service. 2011. Retrieved 30 August 2011.
- ^ "Report on the Activities of Credit Rating Agencies" (PDF). The Technical Committee of the International Organization of Securities Commissions. September 2003. Retrieved 1 December 2011.
- ^ Grytsenko, Oksana (12 April 2014). "Armed pro-Russian insurgents in Luhansk say they are ready for police raid". Kyiv Post.
- ^ Ukraine's Government Report: Economy down 10.4% in 2015, Ukraine Today (2 February 2016)
- ^ World Bank keeps its forecast for Ukraine's economy growth at 1 per cent, Ukraine Today (11 January 2016)
- ^ 7 лютого 2014 року Національний банк України вводить в обіг пам'ятну монету 'Визволення Нікополя від фашистських загарбників' [7 February 2014 the National Bank of Ukraine will introduce a commemorative coin 'Liberation of Nikopol from fascist invaders' into circulation] (in Ukrainian). 7 February 2014. Archived from the original on 21 February 2014. Retrieved 5 February 2016.
- ^ Ukraine teeters a few steps from chaos, BBC News (5 February 2016)
- ^ "Ukraine may get USD 1.7 bln from IMF by mid-year – Moody's". Ukraine Today. 13 May 2016. Retrieved 20 May 2016.
- ^ "What Ukraine must do to get another $1.7 billion IMF loan". Kyiv Post. 14 May 2016. Retrieved 20 May 2016.
- ^ a b Alessandra Prentice (18 May 2016). "Ukraine, IMF agree terms to resume financial support – IMF". Reuters. Retrieved 20 May 2016.
- ^ Neil A. Abrams, M. Steven Fish (5 May 2016). "How Western aid enables graft addiction in Ukraine". Washington Post. Retrieved 20 May 2016.
- ^ Vasileva, Nataliya (18 December 2015). "Ukraine won't repay $3 billion Russian debt due this weekend". Moscow. AP News. Archived from the original on 11 March 2016. Retrieved 4 February 2016.
- ^ Ukraine sees 20.7% decline in retail trade in 2015, UNIAN (20 January 2016)
- ^ a b c d e f Ukraine sees 30.9% decline in exports in 11 months of 2015, UNIAN (25 January 2016)
- ^ a b c "Ukraine's public debt at 79% of GDP by end of 2015 – Finance Ministry". www.unian.info.
- ^ How to overcome poverty in Ukraine Archived 9 November 2018 at the Wayback Machine, UNDP (22 September 2015)
- ^ a b Money flow from Ukrainian migrant workers halves to $2.5 bln, UNIAN (4 March 2016)
- ^ These Are the World's Most Innovative Economies Bloomberg Business.
- ^ Most Innovative: Countries Bloomberg Business.
- ^ Andrew Wilson (14 February 2016). "Corruption is Stalling Ukraine's Optimistic Revolution". Newsweek. Retrieved 17 February 2016.
- ^ Alec Luhn (4 February 2016). "Economic minister's resignation plunges Ukraine into new crisis". The Guardian. Retrieved 16 March 2016.
- ^ "Ukraine sets sights on foreign investment". euronews. 11 October 2016. Retrieved 11 October 2016.
- ^ "Real wages in Ukraine grow by 7.2% in June". www.unian.info.
- ^ "Ukraine posts $406 mln surplus in balance of payments in H1". www.unian.info.
- ^ State Statistics Service: Inflation in Ukraine in 2016 slows down to 12.4%, Interfax-Ukraine (6 January 2017)
- ^ "The Ukrainian economy is not terrible everywhere". The Economist.
- ^ Thor, Anatoliy (14 May 2017). "Investing in Ukraine".
- ^ World Bank affirms Ukraine's GDP growth forecast for 2017 at 2%, Interfax-Ukraine (3 October 2017)
World Bank: Ukraine's economy may grow 3.5% in 2018, UNIAN (10 January 2018) - ^ Growth of consumer prices in Ukraine accelerates to almost 14% in 2017, UNIAN (9 January 2018)
- ^ Bershidsky, Leonid (20 February 2019). "Eastern Europe Feeds on a Shrinking Ukraine". Bloomberg. Retrieved 24 June 2019.
- ^ Kiryukhin, Denys (14 May 2019). "Losing Brains and Brawn: Outmigration from Ukraine". Woodrow Wilson International Center for Scholars. Retrieved 24 June 2019.
- ^ a b Istrate, Dominik (1 October 2019). "China becomes Ukraine's largest trading partner". Emerging Europe.
- ^ a b Korniienko, Artur (16 February 2020). "China, Russia, Germany top list of Ukraine's trade partners in 2019". Kyiv Post.
- ^ "Cabinet of Ministers of Ukraine – State Statistics Service: Real GDP growth in Q3 made up 4.2%". www.kmu.gov.ua.
- ^ "Ukraine making largest payment on debt in 2019 at $1.1 bln". www.unian.info.
- ^ "Credit rating (07 September 2019)".
- ^ "Cabinet of Ministers of Ukraine – Ukraine improved 7 positions and is ranked #64 (out of 190 States) in World Bank Doing Business 2020 report". www.kmu.gov.ua.
- ^ "Ukraine's GDP fell by 4.4 pct in 2020: Ukrainian national bank – Xinhua | English.news.cn". www.xinhuanet.com. Retrieved 26 May 2021.
- ^ "Ambassador Maasikas: IMF, EU financial aid, visa-free travel depend on fighting corruption". UNIAN. 13 November 2020. Retrieved 27 November 2020.
- ^ Zinets, Natalia; Polityuk, Pavel (2 November 2020). "Back me or put IMF loans and EU visa-free deal at risk, Ukraine's president warns". Reuters. Retrieved 27 November 2020.
- ^ "NBU says no IMF tranche for Ukraine this year". bne IntelliNews. Berlin. 14 November 2020. Retrieved 27 November 2020.
- ^ "IMF puts Ukraine on pause over corruption concerns". 16 February 2021. Archived from the original on 16 February 2021.
- ^ Zinets, Natalia; Vasovic, Aleksandar (21 July 2022). "Ukraine devalues hryvnia currency by 25% against U.S. dollar". Reuters. Retrieved 1 September 2022.
- ^ Elliott, Larry (14 March 2022). "Ukraine economy could shrink by up to 35% in 2022, says IMF". The Guardian. Retrieved 31 March 2022.
- ^ "CPI 2023 for Eastern Europe & Central Asia: Autocracy & weak justice…". Transparency.org. 30 January 2024. Retrieved 31 January 2024.
- ^ "Report for Selected Countries and Subjects". IMF. Retrieved 26 February 2024.
- ^ A History of Ukraine: The Land and Its Peoples by Paul Robert Magocsi, University of Toronto Press, 2010, ISBN 1442610212 (page 563/564 & 722/723)
- ^ a b "WTO Trade Profile Ukraine". Archived from the original on 21 February 2014. Retrieved 23 January 2014.
- ^ Structure of Ukrainian exports invariable in 2013 Archived 25 December 2013 at the Wayback Machine (24 December 2013)
- ^ "Export destinations of Ukraine (2012)". Archived from the original on 27 December 2014. Retrieved 17 March 2015.
- ^ "Ukraine's Biggest Trading Partners: Countries – Bloomberg Best (and Worst)". Bloomberg News. 17 March 2015. Archived from the original on 17 March 2015.
- ^ "Ukraine – Trade – European Commission". 17 March 2015. Archived from the original on 17 March 2015.
- ^ a b c d e "Year's balance: thorny road to bright economic future". www.unian.info.
- ^ a b Export of Ukrainian goods and services to EU down by 25% in 2015, UNIAN (30 March 2016)
- ^ Zeneli, Valbona; Haluhan, Nataliia (4 October 2019). "Why China is Setting its Sights on Ukraine". The Diplomat.
- ^ "100 найбільших приватних компаній України 2020 — Forbes.ua". forbes.ua (in Ukrainian). 1 October 2020. Retrieved 1 March 2022.
- ^ "An era of digital transformation". deloitte.com. 1 October 2020. Retrieved 8 March 2023.
- ^ Hajda, Lubomyr. "Ukraine". Encyclopædia Britannica. Encyclopædia Britannica, inc. Retrieved 1 March 2018.
- ^ "Industry of Ukraine". Archived from the original on 31 December 2010.
- ^ "Ukraine - Resources, Power, Economy | Britannica". www.britannica.com. Retrieved 12 April 2024.
- ^ "Mining - UkraineInvest". 8 May 2020. Retrieved 12 April 2024.
- ^ "Ukraine Critical Minerals Portfolio" (PDF). Ministry of Ecology and Natural Resources of Ukraine, Ukrainian Geological Survey. Retrieved 13 April 2024.
- ^ kgi-admin (24 March 2023). "Iron ore production in the Ukraine and major projects". Mining Technology. Retrieved 12 April 2024.
- ^ "Ukraine increased gas production by 0.9% - up to 18.7 bcm in 2023 — EXPRO Consulting". expro.com.ua. Retrieved 10 April 2024.
- ^ "USGS Iron Ore Production Statistics" (PDF).
- ^ "USGS Manganese Production Statistics" (PDF).
- ^ "USGS Titanium Production Statistics" (PDF).
- ^ "USGS Graphite Production Statistics" (PDF).
- ^ "World Uranium Mining – World Nuclear Association". www.world-nuclear.org.
- ^ "Low on gas: Ukraine invasion chokes supply of neon needed for chipmaking". Financial Times. 4 March 2022.
- ^ Alexandra Alper; Alexandra Alper (11 February 2022). "Russia could hit U.S. chip industry, White House warns". Reuters. Retrieved 9 March 2022.
- ^ Ukraine's 2016 exports of titanium ore up 57.1% on year, UNIAN (12 January 2017)
- ^ "Chemicals - UkraineInvest". 12 May 2020. Retrieved 12 April 2024.
- ^ "Coke production in Ukraine fell by 59% in 2022 — Infographic — GMK Center". GMK. Retrieved 12 April 2024.
- ^ a b c Ukraine may become world's sixth biggest arms trader [Kyiv Post]
- ^ "Укроборонпром за 9 месяцев изготовил продукции больше, чем за весь прошлый год". Ukrinform. Archived from the original on 10 August 2015. Retrieved 21 October 2014.
- ^ a b c d e International Energy Agency (April 2022). "Ukraine energy profile". IEA. Retrieved 16 May 2022.
- ^ a b c International Energy Agency (19 January 2020). "Ukraine – Countries & Regions". IEA. Retrieved 16 May 2022.
- ^ "INOGATE". www.inogate.org.
- ^ "Bogdan Corporation - Ukrainian National Automobile Manufacturer". 4 August 2021. Retrieved 12 April 2024.
- ^ "Низькопідлоговий трамвай ось-ось завершать. У червні він уже може поїхати Львовом". Archived from the original on 16 October 2015. Retrieved 4 February 2016.
- ^ Nicolai Petro (9 March 2016). "Why Ukraine needs Russia more than ever". The Guardian. Retrieved 7 September 2016.
- ^ Ukrainian Aircraft Corporation set up on the basis of Antonov (Retrieved on 19 October 2016)
- ^ Antonov presented first production An-178 at Ukraine Avia Fest (Retrieved on 19 October 2016)
- ^ Ukraine's manufacturer Antonov presents new cargo aircraft AN-132 (Retrieved on 19 October 2016)
- ^ "Aircraft and airspace industry of Ukraine". Archived from the original on 5 October 2013. Retrieved 2 October 2013.
- ^ Bergin, Chris (25 February 2008). "none". Space News. p. 12.
- ^ a b c "MAYGER Development & Consulting – Shipbuilding in Ukraine: Investments and Government Support". www.mayger.ua. 31 July 2006.
- ^ a b c "Shipbuilding of Ukraine (2007)". Archived from the original on 3 December 2013. Retrieved 28 November 2013.
- ^ a b "Ukraine Allows Farmland Sales For First Time Since Independence". Radio Free Europe/Radio Liberty. 2 July 2021. Retrieved 2 July 2021.
- ^ "Ukraine Agriculture Stats". Nation Master. Archived from the original on 8 November 2018. Retrieved 4 October 2014.
- ^ "Corn Production by Country in 1000 MT". Index Mundi.
- ^ German expert: Sunflower oil grows in price in Ukraine due to its low world reserves Archived 23 July 2011 at the Wayback Machine [UkrAgroConsult – BlackSeaGrain]
- ^ "FAOSTAT". www.fao.org.
- ^ "Ukraine Produces World's Greatest Amount of Honey Per Capita". WNU. August 2013. Archived from the original on 18 January 2018. Retrieved 4 October 2014.
- ^ a b Ukraine: Land market, formation, development trends – Farmland now remains almost the only big asset that is not actually privatized yet Archived 25 February 2011 at the Wayback Machine [Black Sea Grain]
- ^ Kramer, Andrew E. (31 August 2008). "Russia's Collective Farms – Hot Capitalist Property". New York Times. Retrieved 20 December 2023.
- ^ "Ukraine agrees $3bn loan-for-corn deal". Financial Times. 19 September 2012. Archived from the original on 10 December 2022.
- ^ "China Rejecting U.S. Corn as First Shipment From Ukraine Arrives". Bloomberg.com. Bloomberg. 6 January 2014.
- ^ Gutterman, Steve (18 March 2014). "Putin signs Crimea treaty, will not seize other Ukraine regions". Reuters.com. Retrieved 26 March 2014.
- ^ "Ukraine Grain Exports To Rise". Agriculture.com. 21 October 2014. Archived from the original on 25 February 2022. Retrieved 23 October 2014.
- ^ IMF praises Ukraine's decisions on land reform, banking law, Reuters (4 April 2020)
IMF finally confirms new $5 billion program for Ukraine by Anders Åslund, Atlantic Council (10 June 2020) - ^ Ukraine Lawmakers Approve Key Legislation With Eye On IMF Funds, Radio Free Europe (31 March 2020)
- ^ "FAOSTAT". www.fao.org.
- ^ Bothmer, Roland von; van Hintum, Theo; Knüpffer, Helmut; Sato, Katuhiro, eds. (2003). Diversity in Barley (Hordeum vulgare). Amsterdam: Elsevier. pp. XIX+280. ISBN 978-0-444-50585-9. OCLC 162130976.
- ^ a b (in Ukrainian) Україна – четверта в світі за кількістю ІТ-фахівців Ukraine in fourth place in the world in the number of IT professionals, UNIAN (27 March 2013)
- ^ Exploring Ukraine
- ^ (in Ukrainian) Обсяг українського ІТ-ринку може скласти 3,6 мільярда – звіт, Ukrayinska Pravda (27 March 2013)
- ^ "IT INDUSTRY: Why Ukraine is fast becoming a leading global tech powerhouse". bunews.com.ua. Archived from the original on 25 January 2020. Retrieved 2 October 2019.
- ^ a b "SHARE OF IT INDUSTRY OF UKRAINIAN ECONOMY IS 4% OF GDP – ECONOMY MINISTER". Ukraine open for business. 13 February 2019. Retrieved 2 October 2019.
- ^ "Ukraine As a Bright Spot on Central and Eastern Europe Software Development Scene". 8allocate. 14 February 2019. Retrieved 2 October 2019.
- ^ "UNIT.City presented a report on the IT sector of Ukraine: main figures and indicators". AIN.UA. 30 January 2019. Retrieved 2 October 2019.
- ^ a b c High Seas Danger, Kyiv Post (24 February 2012)
- ^ Pando Networks Releases Global Internet Speed Study Archived 16 April 2013 at the Wayback Machine
- ^ (in Ukrainian) Більше половини українців не користуються інтернетом, Ukrayinska Pravda (in Ukrainian) (29 July 2012)
- ^ "DataBank". The World Bank.
- ^ "Половина населення України має доступ в інтернет". racurs.ua.
- ^ "Mobile cellular subscriptions (per 100 people)". The World Bank. Retrieved 19 May 2017.
- ^ Туристичні потоки (in Ukrainian), State Statistics Committee of Ukraine
- ^ "Tourism 2012". Archived from the original on 6 December 2013.
- ^ "Travel & Tourism in Ukraine" (PDF). Archived from the original (PDF) on 30 May 2012.
- ^ Shopping tours gaining pace in Ukraine Archived 20 February 2011 at the Wayback Machine, Radio Ukraine (23 December 2009)
- ^ Ukraine: The Search for a National Identity by Sharon Wolchik, Rowman & Littlefield, 2000, ISBN 0847693465, page 55
- ^ "Прямі інвестиції". www.ukrstat.gov.ua.
- ^ "Ukraine suffers year-on-year FDI decline". fDiIntelligence.com. 13 August 2013.
- ^ "NAU-Online -> Про утворення державного підприємства "Інвест Україна"". Archived from the original on 6 October 2011.
- ^ "Всі документи бази даних "Законодавство України" (станом на 22 травня 2021 р.) / Законодавство України".
- ^ a b Ukraine set to sign landmark $10 billion shale gas deal with Shell, Reuters (24 January 2013)
Shell for shale: Ukraine signs major deal Archived 28 October 2020 at the Wayback Machine, Euronews (25 January 2013)
UPDATE 1-Ukraine signs landmark $10 bln shale gas deal with Shell, Reuters (24 January 2013) - ^ "Most Successful Expats". Kyiv Post. Archived from the original on 27 June 2013. Retrieved 4 August 2013.
- ^ "Foreign investment in Ukraine in 2016 estimated at $3.8 bln Foreign investment in Ukraine in 2016 estimated at $3.8 bln". Ukrainian Society for Non-Destructive Testing. 23 January 2017. Archived from the original on 31 December 2010.
- ^ Elborgh-Woytek, Katrin; Lewis, Mark W. (2002). "Conditionality in Ukraine's funds programs". Privatization in Ukraine: Challenges of Assessment and Coverage in Fund Conditionality. ISBN 978-14519-7-162-0.
Throughout the 1990s, structural conditionality—including on privatization—expanded significantly in Ukraine's programs with the Fund.
- ^ Lissovolik, Bogdan (1 June 2003). Determinants of Inflation in a Transition Economy-. The Case of Ukraine. ISBN 9781451854923.
- ^ Ukraine signs agreement on free trade zone with EFTA, Kyiv Post (24 June 2010)
- ^ The Global Competitiveness Report 2012–2013, World Economic Forum (2012)
- ^ High Price Of Havens, Kyiv Post (29 July 2010)
- ^ The Money Carousel, Kyiv Post (9 December 2011)
- ^ "Exposed: Ukraine's Massive Witch Hunt". 26 February 2015. Retrieved 14 October 2017.
- ^ "Association Agreement between the European Union and its Member States, of the one part, and Ukraine, of the other part" (PDF). European Union. 29 May 2014. p. 2135. Archived from the original (PDF) on 16 December 2016. Retrieved 20 December 2023.
- ^ "EU-Ukraine Association Agreement fully enters into force". Archived from the original on 14 October 2019.
- ^ "Moldova's economic exiles". Le Monde. Archived from the original on 10 October 2010.
- ^ "Home". askania-nova-zapovidnik.gov.ua (in Russian). Retrieved 10 April 2024.
- ^ "Ministry of Environmental Protection and Natural Resources". Reforms Delivery Office. 26 July 2021. Retrieved 10 April 2024.
- ^ "Chernobyl Shuts Down for Good". ABC News. Retrieved 10 April 2024.
- ^ "Two years of ecocide: uncovering Russia's destruction of Ukraine and its global consequences". Rubryka. Retrieved 10 April 2024.
- ^ "Two years of ecocide: uncovering Russia's destruction of Ukraine and its global consequences". Rubryka. Retrieved 10 April 2024.
- ^ "Industry Breakdown of Companies in Ukraine". HitHorizons.
- ^ a b c "Ukraine". CIA World Factbook. 14 May 2008. Retrieved 14 May 2008.
- ^ "WorldBank ECA Economic Update Spring 2019" (PDF). Archived from the original (PDF) on 18 December 2019. Retrieved 18 December 2019.
- ^ "Ukraine". State Statistics Service of Ukraine. 14 February 2009. Archived from the original on 15 September 2002. Retrieved 14 February 2009.
External links edit
- Ukrainian Ministry of Economic Development and Trade website
- Trade Summary for Ukraine from the World Bank (as of 2021[update])