


Summary
The economy of the United Kingdom is a highly developed social market economy.[22][23][24] It is the sixth-largest national economy in the world measured by nominal gross domestic product (GDP), Tenth-largest by purchasing power parity (PPP), and twenty-first by nominal GDP per capita, constituting 3.1% of nominal world GDP.[25] The United Kingdom constitutes 2.3% of world GDP by purchasing power parity (PPP).[26][25]
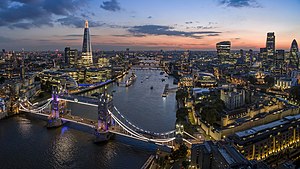 London is the heart of the United Kingdom's economy and the second-largest financial centre in the world
behind New York City. | |
| Currency | Pound sterling (GBP, £) |
|---|---|
| 1 April to 31 March[a] | |
Trade organisations | WTO, G-20, G7 and OECD |
Country group | |
| Statistics | |
| Population | 67,596,281 (2022)[3] |
| GDP | |
| GDP rank | |
GDP growth | |
GDP per capita | |
GDP per capita rank | |
Population below poverty line | |
| (12th) | |
Labour force | 33,174,000 / 75.0% in employment (Oct–Dec 2023)[c][11] |
Labour force by occupation | List
|
| Unemployment | 1,320,000 / 3.8% (Oct–Dec 2023)[e][11] |
Average gross salary | £681.70 per week (2023)[f][11] |
Main industries | List
|
| External | |
| Exports | |
Export goods | List |
Main export partners | List
|
| Imports | |
Import goods | List
|
Main import partners | List
|
FDI stock |
|
| £–78.3 billion (2022)[13] | |
Gross external debt | £7.572 trillion (2023)[14] (2nd) |
| £–244.4 billion (2022)[13] | |
| Public finances | |
| £2.540 trillion / 96% of GDP (2022/23)[15] | |
| £–131 billion / 5.1% of GDP (2022/23)[15] | |
| Revenues | £1.027 trillion (2022/23)[15] |
| Expenses | £1.157 trillion (2022/23)[15] |
| Economic aid | $15.8 billion (2022)[i][16] |
List
| |
The United Kingdom has one of the most globalised economies[27] and comprises England, Scotland, Wales and Northern Ireland.[28] In 2022, the United Kingdom was the fourth-largest exporter[29] in the world and the fourth-largest importer.[30] It also had the fourth-largest outward foreign direct investment,[31] and the thirteenth-largest inward foreign direct investment.[32] In 2022, the United Kingdom's trade with the European Union accounted for 42% of the country's exports and 48% of its imports.[33] Among OECD members, the United Kingdom has a highly efficient and strong social security system, which comprises roughly 24.5% of GDP.[34][35][36]
The service sector dominates, contributing 82% of GDP;[37] the financial services industry is particularly important, and London is the second-largest financial centre in the world.[38] Edinburgh was ranked 17th in the world, and 6th in Europe for its financial services industry in 2021.[39] The United Kingdom's technology sector is valued at US$1 trillion, third behind the United States and China.[40] The aerospace industry in the United Kingdom is the second-largest national aerospace industry.[41] Its pharmaceutical industry, the tenth-largest in the world,[42] plays an important role in the economy. Of the world's 500 largest companies, 18 are headquartered in the UK.[43] The economy is boosted by North Sea oil and gas production; its reserves were estimated at 2.5 billion barrels in 2021,[8] although it has been a net importer of oil since 2005.[44] There are significant regional variations in prosperity, with South East England and North East Scotland being the richest areas per capita. The size of London's economy makes it the wealthiest city by GDP per capita in Europe.[45]
In the 18th century, Britain was the first nation to industrialise.[46][47][48] During the 19th century, through its expansive colonial empire and technological superiority, Britain had a preeminent role in the global economy,[49] accounting for 9.1% of the world's GDP in 1870.[50] The Second Industrial Revolution was also taking place rapidly in the United States and the German Empire; this presented an increasing economic challenge for the UK, leading into the 20th century. The cost of fighting both the First and Second World Wars further weakened the UK's relative position. Despite a relative decline in its global dominance, in the 21st century the UK retains the ability to project significant power and influence around the world.[8][51][52][53]
Government involvement is primarily exercised by His Majesty's Treasury, headed by the Chancellor of the Exchequer, and the Department for Business and Trade. Since 1979, management of the economy has followed a broadly laissez-faire approach.[22][23][54][55][56][57] The Bank of England is the UK's central bank, and since 1997 its Monetary Policy Committee has been responsible for setting interest rates, quantitative easing, and forward guidance.
History edit
1945 to 1979 edit
The WWII net losses in British national wealth amounted to 18.6% (£4.595 billion) of the prewar wealth (£24.68 billion), at 1938 prices.[58] After the Second World War, a new Labour government fully nationalised the Bank of England, civil aviation, telephone networks, railways, gas, electricity, and the coal, iron and steel industries, affecting 2.3 million workers.[59] Post-war, the United Kingdom enjoyed a long period without a major recession; there was a rapid growth in prosperity in the 1950s and 1960s, with unemployment staying low and not exceeding 3.5% until the early 1970s.[60] The annual rate of growth between 1960 and 1973 averaged 2.9%, although this figure was far behind some other European countries such as France, West Germany and Italy.[61]
Deindustrialisation meant the closure of operations in mining, heavy industry, and manufacturing, resulting in the loss of highly paid working-class jobs.[62] The UK's share of manufacturing output had risen from 9.5% in 1830 during the Industrial Revolution to 22.9% in the 1870s. It fell to 13.6% by 1913, 10.7% by 1938, and 4.9% by 1973.[63] Overseas competition, lack of innovation, trade unionism, the welfare state, loss of the British Empire, and cultural attitudes have all been put forward as explanations.[64] It reached crisis point in the 1970s against the backdrop of a worldwide energy crisis, high inflation, and a dramatic influx of low-cost manufactured goods from Asia.[65]
During the 1973 oil crisis (which saw oil prices quadruple),[66] the 1973–74 stock market crash, and the secondary banking crisis of 1973–75, the British economy fell into the 1973–75 recession and the government of Edward Heath was ousted by the Labour Party under Harold Wilson, which had previously governed from 1964 to 1970. Wilson formed a minority government in March 1974 after the general election on 28 February ended in a hung parliament. Wilson secured a three-seat overall majority in a second election in October that year. The UK recorded weaker growth than many other European nations in the 1970s; even after the recession, the economy was blighted by rising unemployment and double-digit inflation, which exceeded 20% more than once and was rarely below 10% after 1973.
In 1976, the UK was forced to apply for a loan of £2.3 billion from the International Monetary Fund. Denis Healey, then Chancellor of the Exchequer, was required to implement public spending cuts and other economic reforms in order to secure the loan, and for a while the British economy improved, with growth of 4.3% in early 1979.[67] Following the discovery of large North Sea oil reserves, the UK became a net exporter of oil by the end of the 1970s, which contributed to a massive appreciation of the pound, making exports in general more expensive and imports cheaper. Oil prices doubled between 1979 and 1980, further reducing manufacturing profitability.[66] After the Winter of Discontent, when the UK was hit by numerous public sector strikes, the government of James Callaghan lost a vote of no confidence in March 1979. This triggered the general election on 3 May 1979 which resulted in Margaret Thatcher's Conservative Party forming a new government.
1979 to 1997 edit
A new period of neo-liberal economics began with this election. During the 1980s, many state-owned industries and utilities were privatised, taxes cut, trade union reforms passed and markets deregulated. GDP fell by 5.9% initially,[68] but growth subsequently returned and rose to an annual rate of 5% at its peak in 1988, one of the highest rates of any country in Europe.[69][70]
Thatcher's modernisation of the economy was far from trouble-free; her battle with inflation, which in 1980 had risen to 21.9%, resulted in a substantial increase in unemployment from 5.3% in 1979 to over 10.4% by the start of 1982, peaking at nearly 11.9% in 1984 – a level not seen in Britain since the Great Depression.[71] The rise in unemployment coincided with the early 1980s global recession, after which UK GDP did not reach its pre-recession rate until 1983. In spite of this, Thatcher was re-elected in June 1983 with a landslide majority. Inflation had fallen to 3.7%, while interest rates were relatively high at 9.56%.[71] The increase in unemployment was largely due to the government's economic policy which resulted in the closure of outdated factories and coal pits. Manufacturing in England and Wales declined from around 38% of jobs in 1961 to around 22% in 1981.[72] This trend continued for most of the 1980s, with newer industries and the service sector enjoying significant growth. Many jobs were also lost as manufacturing became more efficient and fewer people were required to work in the sector. Unemployment had fallen below 3 million by the time of Thatcher's third successive election victory in June 1987; and by the end of 1989 it was down to 1.6 million.[73]
Britain's economy slid into another global recession in late 1990; it shrank by a total of 6% from peak to trough,[74] and unemployment increased from around 6.9% in spring 1990 to nearly 10.7% by the end of 1993. However, inflation dropped from 10.9% in 1990 to 1.3% three years later.[71] The subsequent economic recovery was extremely strong, and unlike after the early 1980s recession, the recovery saw a rapid and substantial fall in unemployment, which was down to 7.2% by 1997,[71] although the popularity of the Conservative government had failed to improve with the economic upturn. The government won a fourth successive election in 1992 under John Major, who had succeeded Thatcher in November 1990, but soon afterwards came Black Wednesday, which damaged the Conservative government's reputation for economic competence, and from that stage onwards, the Labour Party was ascendant in the opinion polls, particularly in the immediate aftermath of Tony Blair's election as party leader in July 1994 after the sudden death of his predecessor John Smith.
Despite two recessions, wages grew consistently by around 2% per year in real terms from 1980 until 1997, and continued to grow until 2008.[75]
1997 to 2009 edit
In May 1997, Labour, led by Tony Blair, won the general election after 18 years of Conservative government.[76] The Labour Government inherited a strong economy with low inflation,[77] falling unemployment,[78] and a current account surplus.[79] Blair ran on a platform of New Labour which was characterised largely by the continuation of neo-liberal economic policies, but also supporting a strong welfare state. In Britain it was largely viewed as a combination of socialist and capitalist policies, being dubbed 'Third Way'.[80] Four days after the election, Gordon Brown, the new Chancellor of the Exchequer, gave the Bank of England the freedom to control monetary policy, which until then had been directed by the government.
During Blair's 10 years in office there were 40 successive quarters of economic growth, lasting until the second quarter of 2008. GDP growth, which had briefly reached 4% per year in the early 1990s, gently declining thereafter, was relatively anaemic compared to prior decades, such as the 6.5% per year peak in the early 1970s, although growth was smoother and more consistent.[70] Annual growth rates averaged 2.68% between 1992 and 2007,[69] with the finance sector accounting for a greater part than previously. The period saw one of the highest GDP growth rates of any developed economy and the strongest of any European nation.[81] At the same time, household debt rose from £420 billion in 1994 to £1 trillion in 2004 and £1.46 trillion in 2008 – more than the entire GDP of the UK.[82]
This extended period of growth ended in Q2 of 2008 when the United Kingdom entered a recession brought about by the global financial crisis. The UK was particularly vulnerable to the crisis because its financial sector was the most highly leveraged of any major economy.[83] Beginning with the collapse of Northern Rock, which was taken into public ownership in February 2008, other banks had to be partly nationalised. The Royal Bank of Scotland Group, at its peak the fifth-largest bank in the world by market capitalisation, was effectively nationalised in October 2008. By mid-2009, HM Treasury had a 70.33% controlling shareholding in RBS, and a 43% shareholding, through the UK Financial Investments Limited, in Lloyds Banking Group. The Great Recession, as it came to be known, saw unemployment rise from just over 1.6 million in January 2008 to nearly 2.5 million by October 2009.[84][85]
In August 2008 the IMF warned that the country's outlook had worsened due to a twin shock: financial turmoil and rising commodity prices.[86] Both developments harmed the UK more than most developed countries, as it obtained revenue from exporting financial services while running deficits in goods and commodities, including food. In 2007, the UK had the world's third largest current account deficit, due mainly to a large deficit in manufactured goods. In May 2008, the IMF advised the UK government to broaden the scope of fiscal policy to promote external balance.[87] The UK's output per hour worked was on a par with the average for the "old" EU-15 countries.[88]
2009 to 2020 edit
In March 2009, the Bank of England (BoE) cut interest rates to a then-historic low of 0.5% and began quantitative easing (QE) to boost lending and shore up the economy.[89] The UK exited the Great Recession in Q4 of 2009 having experienced six consecutive quarters of negative growth, shrinking by 6.03% from peak to trough, making it the longest recession since records began and the deepest since World War II.[74][90] Support for Labour slumped during the recession, and the general election of 2010 resulted in a coalition government being formed by the Conservatives and the Liberal Democrats.
In 2011, household, financial, and business debts stood at 420% of GDP in the UK.[j][91] As the world's most indebted country, spending and investment were held back after the recession, creating economic malaise. However, it was recognised that government borrowing, which rose from 52% to 76% of GDP, had helped to avoid a 1930s-style depression.[92] Within three years of the general election, government cuts aimed at reducing the budget deficit had led to public sector job losses well into six figures, but the private sector enjoyed strong jobs growth.
The 10 years following the Great Recession were characterised by extremes. In 2015, employment was at its highest since records began,[93] and GDP growth had become the fastest in the Group of Seven (G7) and Europe,[94] but workforce productivity was the worst since the 1820s, with any growth attributed to a fall in working hours.[95] Output per hour worked was 18% below the average for the rest of the G7.[96] Real wage growth was the worst since the 1860s, and the Governor of the Bank of England described it as a lost decade.[97] Wages fell by 10% in real terms in the eight years to 2016, whilst they grew across the OECD by an average of 6.7%.[98] For 2015 as a whole,[99] the current account deficit rose to a record high of 5.2% of GDP (£96.2bn),[100] the highest in the developed world.[101] In Q4 2015, it exceeded 7%, a level not witnessed during peacetime since records began in 1772.[102] The UK relied on foreign investors to plug the shortfall in its balance of payments.[103] Homes had become less affordable, a problem exacerbated by QE, without which house prices would have fallen by 22%, according to the BoE's own analysis.[104]
A rise in unsecured household debt added to questions over the sustainability of the economic recovery in 2016.[105][106][107] The BoE insisted there was no cause for alarm,[108] despite having said two years earlier that the recovery was "neither balanced nor sustainable".[109][k] Following the UK's 2016 decision to leave the European Union, the BoE cut interest rates to a new historic low of 0.25% for just over a year. It also increased the amount of QE since the start of the Great Recession to £435bn.[112] By Q4 2018 net borrowing in the UK was the highest in the OECD at 5% of GDP.[l] Households had been in deficit for an unprecedented nine quarters in a row. Since the Great Recession, the country was no longer making a profit on its foreign investments.[113]
2020 to present edit
In March 2020, in response to the COVID-19 pandemic, a temporary ban was imposed on non-essential business and travel in the UK. The BoE cut the interest rate to 0.1%.[114] Economic growth had been weak before the crisis, with zero growth in Q4 2019.[115] By May, 23% of the British workforce was furloughed (temporarily laid off). Government schemes were launched to help affected workers.[116] In the first half of 2020, GDP shrank by 22.6%,[117] the deepest recession in UK history and worse than any other G7 or European country.[118] During 2020 the BoE purchased £450 billion of government bonds, taking the amount of quantitative easing since the start of the Great Recession to £895 billion.[119] Overall, GDP shrank by 9.9% in 2020, making it the worst contraction since the Great Frost paralysed the economy in 1709.[120]
In 2021 consumer price inflation (CPI) began rising sharply due to higher energy and transport costs.[121] With annual inflation approaching 11%, the BoE gradually increased the base rate to 2.25% during the first nine months of 2022.[122] The UK was not alone: global inflation rates were the highest in 40 years owing to the pandemic and Russia's invasion of Ukraine,[123] though as of September 2022[update], the country had the highest domestic electricity prices and amongst the highest gas prices in Europe, contributing to a cost of living crisis.[124] In February 2022 the BoE began quantitative tightening (a reversal of QE) by not renewing mature government bonds and in November started offloading bonds to private investors,[125] signalling the end to an era of easy borrowing.[126][127] In October 2022 year-on-year CPI was at 11.1%, the worst for 41 years, food price inflation was 16.2%, gas prices 130% and electricity 66%.
In August 2023, the ONS revised its analysis of Britain's economic performance and said that Britain's GDP had surpassed its pre-COVID-19 size in the final quarter of 2021, a much earlier recovery from the pandemic than previously estimated and ahead of other big European countries. The British economy was 0.6% larger in the fourth quarter of 2021 than in the final quarter of 2019, compared with an earlier estimate that it was 1.2% smaller.[128]
Economic charts edit
-
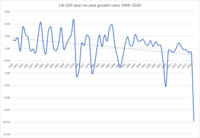 GDP year-on-year growth, 1949–2020
 -
 Workforce distribution in Great Britain 1841–1911, and in England and Wales 1921–2011
 -
 Unemployment rates, 1881–2017
 -
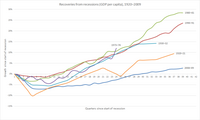 Recovery periods for each recession (measured as GDP per capita), 1920–2009
 -
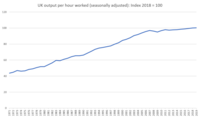 Productivity, 1971–2019
 -
 Interest rates, 1800–2020
 -
 Balance of trade, 1948–2020
 -
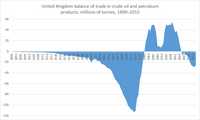 Balance of trade in crude oil and petroleum, 1890–2015
 -
 United Kingdom bonds Inverted yield curve 1988–1991


Government spending and economic management edit

Government involvement in the economy is primarily exercised by HM Treasury, headed by the Chancellor of the Exchequer. In recent years, the UK economy has been managed in accordance with principles of market liberalisation and low taxation and regulation. Since 1997, the Bank of England's Monetary Policy Committee, headed by the Governor of the Bank of England, has been responsible for setting interest rates at the level necessary to achieve the overall inflation target for the economy that is set by the Chancellor each year.[129] The Scottish Government, subject to the approval of the Scottish Parliament, has the power to vary the basic rate of income tax payable in Scotland by plus or minus 3 pence in the pound, though this power has not yet been exercised.
In the 20-year period from 1986/87 to 2006/07 government spending in the UK averaged around 40% of GDP.[130] In July 2007, the UK had government debt at 35.5% of GDP.[131] As a result of the 2007–2010 financial crisis and the late-2000s global recession, government spending increased to a historically high level of 48% of GDP in 2009–10, partly as a result of the cost of a series of bank bailouts.[130][131] In terms of net government debt as a percentage of GDP, at the end of June 2014 public sector net debt excluding financial sector interventions was £1304.6 billion, equivalent to 77.3% of GDP.[132] For the financial year of 2013–2014 public sector net borrowing was £93.7 billion.[132] This was £13.0 billion higher than in the financial year of 2012–2013.
Taxation in the United Kingdom may involve payments to at least two different levels of government: local government and central government (HM Revenue & Customs). Local government is financed by grants from central government funds, business rates, council tax, and, increasingly, fees and charges such as those from on-street parking. Central government revenues are mainly from income tax, national insurance contributions, value added tax, corporation tax and fuel duty.
Sectors edit
Agriculture edit

Agriculture in the UK is intensive, highly mechanised, and efficient by European standards. The country produces around 65% of its food needs. The self-sufficiency level was just under 50% in the 1950s, peaking at 80% in the 1980s, before declining to its present level at the turn of the 21st century.[133]
Agriculture added gross value of £12.18 billion to the economy in 2018, and around 467,000 people were employed in agriculture, hunting, forestry and fishing. It contributes around 0.5% of the UK's national GDP.[134] Around two-thirds of production by value is devoted to livestock, and one-third to arable crops.[135] The agri-food sector as a whole (agriculture and food manufacturing, wholesale, catering, and retail) was worth £120 billion and accounts for 4 million jobs in the UK.[136]
Construction edit
The construction industry of the United Kingdom employed around 2.3 million people and contributed gross value of £123.2 billion to the economy in 2019.[134]
One of the largest construction projects in the UK in recent years was Crossrail, costing an estimated £19 billion. It was the largest construction project in Europe. Opened in 2022,[137] it is a new railway line running east to west through London and into the surrounding area, with a branch to Heathrow Airport.[138] The main feature of the project is construction of 42 km (26 mi) of new tunnels connecting stations in central London.[139] High Speed 2 between London and the West Midlands is one of Europe's largest infrastructure projects.[140] Crossrail 2 is a proposed rail route in the South East of England.
Production industries edit
Electricity, gas and water edit
This sector added gross value of £51.4 billion to the economy in 2018.[134] The United Kingdom is expected to launch the building of new nuclear reactors to replace existing generators and to boost the UK's energy reserves.[141]
Manufacturing edit

In the 1970s, manufacturing accounted for 25 per cent of the economy. Total employment in manufacturing fell from 7.1 million in 1979 to 4.5 million in 1992 and only 2.7 million in 2016, when it accounted for 10% of the economy.[142][143]
Manufacturing has increased in 36 of the last 50 years and was twice in 2007 what it was in 1958.[144]
In 2011 the UK manufacturing sector generated approximately £140.5 billion in gross value added and employed around 2.6 million people.[145][146] Of the approximately £16 billion invested in R&D by UK businesses in 2008, approximately £12 billion was by manufacturing businesses.[146] In 2008, the UK was the sixth-largest manufacturer in the world measured by value of output.[147]
In 2008 around 180,000 people in the UK were directly employed in the UK automotive manufacturing sector.[148] In that year the sector had a turnover of £52.5 billion, generated £26.6 billion of exports[149] and produced around 1.45 million passenger vehicles and 203,000 commercial vehicles.[148] The UK is a major centre for engine manufacturing, and in 2008 around 3.16 million engines were produced in the country.[148]
The aerospace industry of the UK is the second largest aerospace industry in the world (after the United States) and the largest in Europe.[150][151] The industry employs around 113,000 people directly and around 276,000 indirectly and has an annual turnover of around £20 billion.[152][153] British companies with a major presence in the industry include BAE Systems and Rolls-Royce (the world's second-largest aircraft engine maker).[154][155] European aerospace companies active in the UK include Airbus, whose commercial aircraft, space, helicopter and defence divisions employ over 13,500 people across more than 25 UK sites.[156]
The pharmaceutical industry employs around 67,000 people in the UK and in 2007 contributed £8.4 billion to the UK's GDP and invested a total of £3.9 billion in research and development.[157][158] In 2007 exports of pharmaceutical products from the UK totalled £14.6 billion, creating a trade surplus in pharmaceutical products of £4.3 billion.[159] The UK is home to GlaxoSmithKline and AstraZeneca, respectively the world's third- and seventh-largest pharmaceutical companies.[160][161]
Mining, quarrying and hydrocarbons edit
The Blue Book 2013 reports that this sector added gross value of £31.4 billion to the UK economy in 2011.[145] In 2007 the UK had a total energy output of 9.5 quadrillion Btus (10 exajoules), of which the composition was oil (38%), natural gas (36%), coal (13%), nuclear (11%) and other renewables (2%).[162] In 2009, the UK produced 1.5 million barrels per day (bbl/d) of oil and consumed 1.7 million bbl/d.[163] Production is now in decline and the UK has been a net importer of oil since 2005.[163] As of 2010 the UK has around 3.1 billion barrels of proven crude oil reserves, the largest of any EU member state.[163]
In 2009 the UK was the 13th largest producer of natural gas in the world and the largest producer in the EU.[164] Production is now in decline and the UK has been a net importer of natural gas since 2004.[164] In 2009 the UK produced 19.7 million tons of coal and consumed 60.2 million tons.[162] In 2005 it had proven recoverable coal reserves of 171 million tons.[162] It has been estimated that identified onshore areas have the potential to produce between 7 billion tonnes and 16 billion tonnes of coal through underground coal gasification (UCG).[165] Based on current UK coal consumption, these volumes represent reserves that could last the UK between 200 and 400 years.[166]
The UK is home to a number of large energy companies, including two of the six oil and gas "supermajors" – BP and Royal Dutch Shell.[167][168] The UK is also rich in a number of natural resources including coal, tin, limestone, iron ore, salt, clay, chalk, gypsum, lead and silica.
Service industries edit
The service sector is the dominant sector of the UK economy, and it accounted for 82% of GDP in 2023.[37]
Creative industries edit
The creative industries accounted for 7% of gross value added (GVA) in 2005 and grew at an average of 6% per annum between 1997 and 2005.[169] Key areas include London and the North West of England, which are the two largest creative industry clusters in Europe.[170] According to the British Fashion Council, the fashion industry's contribution to the UK economy in 2014 is £26 billion, up from £21 billion in 2009.[171] The UK is home to the world's largest advertising company, WPP.
Education, health and social work edit

According to The Blue Book 2013 the education sector added a gross value of £84.6 billion in 2011 whilst human health and social work activities added £104.0 billion in 2011.[145]
In the UK the majority of the healthcare sector consists of the state funded and operated National Health Service (NHS), which accounts for over 80% of all healthcare spending in the UK and has a workforce of around 1.7 million, making it the largest employer in Europe, and putting it amongst the largest employers in the world.[172][173][174] The NHS operates independently in each of the four constituent countries of the UK. The NHS in England is by far the largest of the four parts and had a turnover of £92.5 billion in 2008.[175]
In 2007/08 higher education institutions in the UK had a total income of £23 billion and employed a total of 169,995 staff.[176] In 2007/08 there were 2,306,000 higher education students in the UK (1,922,180 in England, 210,180 in Scotland, 125,540 in Wales and 48,200 in Northern Ireland).[176]
Financial and business services edit
The UK financial services industry added gross value of £116.4 billion to the UK economy in 2011.[145] The UK's exports of financial and business services make a significant positive contribution towards the country's balance of payments.

London is a major centre for international business and commerce and is one of the three "command centres" of the global economy (alongside New York City and Tokyo).[177]
There are over 500 banks with offices in London, and it is the leading international centre for banking, insurance, Eurobonds, foreign exchange trading and energy futures. London's financial services industry is primarily based in the City of London and Canary Wharf. The City houses the London Stock Exchange, the London Metal Exchange, Lloyd's of London, and the Bank of England. Canary Wharf began development in the 1980s and is now home to major financial institutions such as Barclays Bank, Citigroup and HSBC, as well as the UK Financial Services Authority.[178][179] London is also a major centre for other business and professional services, and four of the six largest law firms in the world are headquartered there.[180]
Several other major UK cities have large financial sectors and related services. Edinburgh has one of the largest financial centres in Europe[181] and is home to the headquarters of Lloyds Banking Group, NatWest Group and Standard Life. Leeds is the UK's largest centre for business and financial services outside London,[182][183][184] and the largest centre for legal services in the UK after London.[185][186][187]
According to a series of research papers and reports published in the mid-2010s, Britain's financial firms provide sophisticated methods to launder billions of pounds annually, including money from the proceeds of corruption around the world as well as the world's drug trade, thus making the city a global hub for illicit finance.[188][189][190][191] According to a Deutsche Bank study published in March 2015, Britain was attracting circa one billion pounds of capital inflows a month not recorded by official statistics, up to 40 per cent probably originating from Russia, which implies misreporting by financial institutions, sophisticated tax avoidance, and the UK's "safe-haven" reputation.[192]
Hotels and restaurants edit
The Blue Book 2013 reports that this industry added gross value of £36.6 billion to the UK economy in 2011.[145] InterContinental Hotels Group (IHG), headquartered in Denham, Buckinghamshire, is currently the world's largest hotelier, owning and operating hotel brands such as InterContinental, Holiday Inn and Crowne Plaza.
Informal edit
A study in 2014 found that sex work and associated services added over £5 billion to the economy each year.[193]
Public administration and defence edit
The Blue Book 2013 reports that this sector added gross value of £70.4 billion to the UK economy in 2011.[145]
Real estate and renting activities edit

Notable real estate companies in the United Kingdom include British Land, Land Securities, and The Peel Group. The UK property market boomed for the seven years up to 2008, and in some areas property trebled in value over that period. The increase in property prices had a number of causes: low interest rates, credit growth, economic growth, rapid growth in buy-to-let property investment, foreign property investment in London and planning restrictions on the supply of new housing.
In England and Wales between 1997 and 2016, average house prices increased by 259%, while earnings increased by 68%. An average home cost 3.6 times annual earnings in 1997 compared to 7.6 in 2016.[195] Rent has nearly doubled as a share of GDP since 1985, and is now larger than the manufacturing sector. In 2014, rent and imputed rent – an estimate of how much home-owners would pay if they rented their home – accounted for 12.3% of GDP.[196]
Tourism edit

With over 40 million visits in 2019, inbound tourism contributed £28.5 billion to the British economy, although just over half of that money was spent in London,[198] which was the third most visited city in the world (21.7 million), behind second-placed Bangkok and first-placed Hong Kong.[199]
The UK's 10 most significant inbound tourism markets in 2019:[200]
| Rank | Market | Spend | Visitors |
|---|---|---|---|
| 1 | European Union | £9.33 billion | 22,580,591 |
| 2 | United States | £4.18 billion | 4,498,753 |
| 3 | China | £1.71 billion | 883,072 |
| 4 | Australia | £1.17 billion | 1,063,404 |
| 5 | India | £752 million | 692,082 |
| 6 | Canada | £734 million | 874,060 |
| 7 | Saudi Arabia | £627 million | 220,780 |
| 8 | Switzerland | £569 million | 925,727 |
| 9 | Norway | £436 million | 647,460 |
| 10 | Japan | £369 million | 388,839 |
Effects of the COVID-19 pandemic edit
The travel restrictions and lockdowns necessitated by the pandemic negatively affected the entire hospitality/tourism section in 2020 with a 76% reduction in "inbound tourism" to the UK that year according to VisitBritain. The January 2021 forecast for the year indicated an estimate that visits from other nations would be up "21% on 2020 but only 29% of the 2019 level". Some increase was expected during 2021, slowly at first; the tourism authority concluded that the number of visits was not expected to come "even close to normal levels".[201]
The same VisitBritain report also discussed the effects of the pandemic on domestic travel within the UK in 2020, citing a significant reduction in spending, for an estimated decline of 62% over the previous year. As of January 2021, the forecast for the year suggested that spending would increase by 79% over the previous year and that "the value of spending will be back to 84% of 2019 levels" by the end of 2021.[202]
Some of the "COVID-19 restrictions" on domestic travel were to be loosened on 12 April 2021 and the UK planned to begin relaxing some restrictions on travel from other nations in mid May.[203] The latter plan became less certain as of 8 April 2021 when sources in the European Union stated on that a "third wave of the pandemic [was sweeping] the continent"; the B117 variant was of particular concern.[204] Two days earlier, PM Boris Johnson had made it clear that "We don't want to see the virus being reimported into this country from abroad".[205] All travel restrictions ended on 18 March 2022.[206]
Transport, storage and communication edit

The transport and storage industry added a gross value of £59.2 billion to the UK economy in 2011 and the telecommunication industry added a gross value of £25.1 billion in the same year.[145]
The UK has a total road network of 246,700 miles (397,025 km) with 31,400 miles (50,533 km) of major roads, including 2,300 miles (3,701 km) of motorway.[207] The railway infrastructure, in Great Britain, is owned by Network Rail which has 19,291 miles (31,046 km) of railway lines, of which 9,866 miles (15,878 km) is open for traffic.[208] There are a further 206.5 miles (332.3 km) of track in Northern Ireland, owned and operated by Northern Ireland Railways.[209]
The government is to spend £56 billion on a new high-speed railway line, HS2, with the first phase from London to Birmingham costing £27 billion.[210] Crossrail (later branded the Elizabeth line), which was completed and officially opened in 2022, is Europe's largest infrastructure project with a £15 billion projected cost.[211]
National Highways is the government-owned company responsible for trunk roads and motorways in England apart from the privately owned and operated M6 Toll.[212] [213]
In the year from February 2017 to January 2018, UK airports handled a total of 284.8 million passengers.[214] In that period the three largest airports were London Heathrow Airport (78.0 million passengers), Gatwick Airport (45.6 million passengers) and Manchester Airport (27.8 million passengers).[214] Heathrow, located 14+1⁄2 miles (23.3 km) west of the capital,[215] has the most international passenger traffic of any airport in the world.[216] It is the hub for the UK flag carrier British Airways and Virgin Atlantic.[217] London's six commercial airports form the world's largest city airport system measured by passenger traffic with 171 million passengers in 2017.[218]
Wholesale and retail trade edit
This sector includes the motor trade, auto repairs, personal and household goods industries. The Blue Book 2013 reports that this sector added gross value of £151.8 billion to the UK economy in 2011.[145]
As of 2016, high-street retail spending accounted for about 33% of consumer spending and 20% of GDP. Because 75% of goods bought in the United Kingdom are made overseas, the sector only accounts for 5.7% of gross value added to the British economy.[219] Online sales account for 22% of retail spending in the UK, third highest in the world after China and South Korea, and double that of the United States.[220]
The UK grocery market is dominated by four companies: Tesco (26.9% market share), Sainsbury's (14.8%), Asda (14.3%) and Morrisons (8.8%) in March 2023, these supermarkets are known as the "Big Four". However discount supermarkets such as Aldi and Lidl have grown in popularity, with Aldi's market share now worth 9.9%.[221][222]
London is a major retail centre and in 2010 had the highest non-food retail sales of any city in the world, with a total spend of around £64.2 billion. Outside of London, Manchester and Birmingham are also major retail destinations, the UK is also home to many large out of town shopping centres like Meadowhall, away from the main high streets in town and city centres. Whilst the big international names dominate most towns and cities have streets or areas with many often quirky independent businesses.[223] The UK-based Tesco is the fourth-largest retailer in Europe measured by turnover (after Swartz, Aldi, and Carrefour in 2019).[224]
Currency edit
London is the world capital for foreign exchange trading, with a global market share of 43.1% in 2019 of the daily $6.6 trillion global turnover. The highest daily volume, counted in trillions of US dollars, is reached when New York enters the trade.
Sterling is the currency of the UK, with its main unit, the pound, represented by the symbol "£'. The Bank of England is the central bank, responsible for issuing currency. Banks in Scotland and Northern Ireland retain the right to issue their own notes, subject to retaining enough Bank of England notes in reserve to cover the issue. Sterling is also used as a reserve currency by other governments and institutions, and is the third-largest after the US dollar and the euro.[225]
The UK chose not to join the euro at the currency's launch. The government of former Prime Minister Tony Blair had pledged to hold a referendum to decide on membership should "five economic tests" be met. Until relatively recently there had been debate over whether or not the UK should abolish its currency and adopt the euro. In 2007 the Prime Minister, Gordon Brown, pledged to hold a public referendum based on certain tests he set as Chancellor of the Exchequer. When assessing the tests, Brown concluded that while the decision was close, the United Kingdom should not yet join the euro. He ruled out membership for the foreseeable future, saying that the decision not to join had been right for the UK and for Europe.[226] In particular, he cited fluctuations in house prices as a barrier to immediate entry. Public opinion polls have shown that a majority of Britons have been opposed to joining the single currency for some considerable time, and this position has hardened further in the last few years.[227] In 2005, more than half (55%) of the UK were against adopting the currency, while 30% were in favour.[228] The possibility of joining the euro has become a non-issue since the referendum decision to withdraw from the European Union in 2016 and subsequent withdrawal in 2020.
Exchange rates edit
Average for each year, in US dollars and euros per pound; and inversely: £ per US$ and €. (Synthetic Euro XEU before 1999). These averages conceal wide intra-year spreads. The coefficient of variation gives an indication of this. It also shows the extent to which the pound tracks the euro or the dollar. Note the effect of Black Wednesday in late 1992 by comparing the averages for 1992 and for 1993.
|
|
- For consistency and comparison purposes, coefficient of variation is measured on both the "per £" ratios, although it is conventional to show the forex rates as dollars per £ and £ per euro.
Economy by country edit
The strength of the UK economy varies from country to country. Excluding the effects of North Sea oil and gas (which is classified in official statistics as extra-regio), England has the highest gross value added (GVA) and Wales the lowest of the UK's countries.
| Rank | Country | GVA per head, 2020[232] |
|---|---|---|
| 1 | England | £32,866 ($42136) |
| 2 | Scotland | £29,629 ($37986) |
| 3 | Northern Ireland | £25,575 ($32788) |
| 4 | Wales | £23,882 ($30618) |
Economy by English region edit
Within England, GVA per capita is highest in London. The following table shows the GVA per capita of the nine statistical regions of England.
| Rank | Region | GVA per head, 2020[232] |
|---|---|---|
| 1 | London | £55,974 ($71762) |
| 2 | South East England | £34,516 ($44251) |
| 3 | East of England | £29,176 ($37405) |
| 4 | North West England | £28,257 ($36227) |
| 5 | South West England | £28,012 ($35913) |
| 6 | West Midlands | £26,281 ($33694) |
| 7 | East Midlands | £25,956 ($33277) |
| 8 | Yorkshire and the Humber | £25,696 ($32944) |
| 9 | North East England | £23,109 ($29627) |
Trade edit

The trade deficit (goods and services) narrowed £0.2 billion to £7.9 billion in the three months to November 2018 as both goods and services exports each increased £0.1 billion more than their respective imports.[233]
Excluding erratic commodities (mainly aircraft) the total trade deficit widened £1.2 billion to £9.5 billion in the three months to November 2018.
Large increases in export prices of oil and aircraft drove the narrowing of the total trade deficit; removing the effect of inflation, the total trade deficit widened £0.3 billion to £6.5 billion in the three months to November 2018.
The trade in goods deficit widened £0.8 billion with EU countries and narrowed £0.9 billion with non-EU countries in the three months to November 2018, due mainly to increases in imports from EU countries and exports to non-EU countries.
The total trade deficit widened £4.1 billion in the 12 months to November 2018 due mainly to a £4.4 billion narrowing in the trade in services surplus.
After the withdrawal of the United Kingdom from the European Union, the negotiation of a trade deal between the UK and the European Union including her 27 member states might have the same status than third countries for statistics related to imports and exports with the UK:
- According to OEC World 2017 data, the EU-27-2020 could become/stay one of the notable partners of the UK, with exports from the UK reaching near $200B, close from the United States ($45B, and China $21B).[234]
- According to OEC World 2017 data, the EU-27-2020 could become/stay one of the notable partners of the UK, with imports to the UK reaching near $330B, close from the United States ($46B, and China $58B).[235]
UK economy received £1 billion to boost through innovative trade digitalisation act in July 2023.[236]
Trade deals being negotiated
- Canada–United Kingdom Free Trade Agreement
- India–United Kingdom Free Trade Agreement
- Gulf Cooperation Council–United Kingdom Free Trade Agreement
- United Kingdom–United States Free Trade Agreement
- Comprehensive and Progressive Agreement for Trans-Pacific Partnership
- * Accession of the United Kingdom to CPTPP
Other Trade Deals
Investment edit
In 2013 the UK was the leading country in Europe for inward foreign direct investment (FDI) with $26.51bn. This gave it a 19.31% market share in Europe. In contrast, the UK was second in Europe for outward FDI, with $42.59bn, giving a 17.24% share of the European market.[237]
In October 2017, the ONS revised the UK's balance of payments, changing the net international investment position from a surplus of £469bn to a deficit of £22bn. Deeper analysis of outward investment revealed that much of what was thought to be foreign debt securities owned by British companies were actually loans to British citizens. Inward investment also dropped, from a surplus of £120bn in the first half of 2016 to a deficit of £25bn in the same period of 2017. The UK had been relying on a surplus of inward investment to make up for its long-term current account deficit.[238]
According to the Office for National Statistics, the UK is the biggest investor in America,[239] and the second biggest in China.[239]
Mergers and acquisitions edit
Since 1985 103,430 deals with UK participation have been announced. There have been three major waves of increased M&A activity (2000, 2007 and 2017; see graph "M&A in the UK"). 1999 however, was the year with the highest cumulated value of deals (£490 bil, which is about 50% more than the current peak of 2017). The Finance industry and Energy & Power made up most of the value from 2000 until 2018 (both about 15%).
Here is a list of the top 10 deals including UK companies.[240] The Vodafone - Mannesmann deal is still the biggest deal in global history.
| Rank | Date | Acquirer | Acquirer nation | Target | Target nation | Value (£ billions) |
|---|---|---|---|---|---|---|
| 1 | 14 November 1999 | Vodafone AirTouch PLC | United Kingdom | Mannesmann AG | Germany | 126.95 |
| 2 | 16 September 2015 | Anheuser-Busch Inbev SA/NV | Belgium | SABMiller PLC | United Kingdom | 77.24 |
| 3 | 4 August 2015 | Royal Dutch Shell PLC | Netherlands | BG Group PLC | United Kingdom | 46.70 |
| 4 | 17 January 2000 | Glaxo Wellcome PLC | United Kingdom | SmithKline Beecham PLC | United Kingdom | 46.48 |
| 5 | 28 October 2004 | Royal Dutch Petroleum Co | Netherlands | Shell Transport & Trading Co | United Kingdom | 40.75 |
| 6 | 21 October 2016 | British American Tobacco PLC | United Kingdom | Reynolds American Inc | United States | 40.10 |
| 7 | 15 January 1999 | Vodafone Group PLC | United Kingdom | AirTouch Communications Inc | United States | 36.35 |
| 8 | 30 May 2000 | France Telecom SA | France | Orange PLC | United Kingdom | 31.14 |
| 9 | 8 November 1998 | British Petroleum Co PLC | United Kingdom | Amoco Corp | United States | 29.51 |
| 10 | 31 October 2016 | GE Oil & Gas | United Kingdom | Baker Hughes Inc | United States | 26.63 |
| 11 | 26 February 2009 | HM Treasury | United Kingdom | Royal Bank of Scotland Group | United Kingdom | 25.50 |
- In most cases both the acquiring and target companies have/had shareholders spread throughout the world, not only in the stated countries.
European Union membership edit
The proportion of the country's exports going to the EU has fallen from 54 per cent to 47 per cent over the past decade. The total value of exports however, has increased in the same period from £130 billion (€160 billion) to £240 billion (€275 billion).[241][242]
In June 2016 the UK voted to leave the EU in a national referendum on its membership of the EU. After the activation of Article 50 of the Lisbon Treaty, the UK had been set to leave on Friday 29 March 2019. However the leave date was extended to Friday 12 April 2019 and then extended again to Thursday 31 October 2019,[243] and then extended again until Friday 31 January 2020 with the ability to exit earlier.[244] The future relationship between the UK and EU was under negotiation until the end of October 2019. UK economic growth slowed during 2019, with uncertainty over Brexit and a world economic slowdown blamed.[245]
The UK left the EU in January 2020. On 16 July 2020, the government of UK affirmed that businesses across the United Kingdom, after the transition period ends, will continue to enjoy internal trade and jobs would remain protected against uncertain environment . From 1 January 2021, the powers which were previously exercised at an EU level in at least 70 policy areas were to directly transfer to the devolved administrations in Edinburgh, Cardiff and Belfast for the first time.[246]
Poverty edit
The United Kingdom is a developed country with social welfare infrastructure, thus discussions surrounding poverty tend to use a relatively high minimum income compared to developing countries. According to the OECD, the UK is in the lower half of developed country rankings for poverty rates, doing better than France, Italy, Spain, and the US but less well than Austria, Hungary, Slovakia and the Nordic countries.[247] Eurostat figures show that the numbers of Britons at risk of poverty has fallen to 15.9% in 2014, down from 17.1% in 2010 and 19% in 2005 (after social transfers were taken into account).[248] Poverty is countered in United Kingdom with the welfare state.
The poverty line in the UK is commonly defined as being 60% of the median household income. In 2007–2008, this was calculated to be £115 per week for single adults with no dependent children; £199 per week for couples with no dependent children; £195 per week for single adults with two dependent children under 14; and £279 per week for couples with two dependent children under 14. In 2007–2008, 13.5 million people, or 22% of the population, lived below this line. This is a higher level of relative poverty than all but four EU members.[249] In the same year, 4.0 million children, 31% of the total, lived in households below the poverty line, after housing costs were taken into account. This is a decrease of 400,000 children since 1998–1999.[250]
Economic impacts of climate change edit
According to the Government, the number of households in flood risk will be up to 970,000 homes in the 2020s, up from around 370,000 in January 2012.[251] The effects of flooding and managing flood risk cost the country about £2.2bn a year, compared with the less than £1bn spent on flood protection and management.[252] UK agriculture is also being impacted by drought and weather changes.[253]
In 2020 PricewaterhouseCoopers estimate that Storm Dennis damage to homes, businesses and cars could be between £175m and £225m and Storm Ciara cost up to £200m.[254][255] Friends of the Earth criticised British government of the intended cuts to flood defence spending. The protection against increasing flood risk as a result of climate change requires rising investment. In 2009, the Environment Agency calculated that the UK needs to be spending £20m more compared to 2010 to 2011 as the baseline, each and every year out to 2035, just to keep pace with climate change.[256]
The British government and the economist Nicholas Stern published the Stern Review on the Economics of Climate Change in 2006. The report states that climate change is the greatest and widest-ranging market failure ever seen, presenting a unique challenge for economics. The Review provides prescriptions including environmental taxes to minimise economic and social disruptions. The Stern Review's main conclusion is that the benefits of strong, early action on climate change far outweigh the costs of not acting.[257] The Review points to the potential impact of climate change on water resources, food production, health, and the environment. According to the Review, without action, the overall costs of climate change will be equivalent to losing at least 5% of global gross domestic product (GDP) each year, now and forever. Including a wider range of risks and impacts could increase this to 20% of GDP or more. The review leads to a simple conclusion: the benefits of strong, early action considerably outweigh the costs.[258]Data edit
The following table shows the main economic indicators in 1980–2021 (with IMF staff estimates in 2022–2027). Inflation below 5% is in green.[259]
| Year | GDP
(in Bil. US$PPP) |
GDP per capita
(in US$ PPP) |
GDP
(in Bil. US$ nominal) |
GDP per capita
(in US$ nominal) |
GDP growth
(real) |
Inflation rate
(in %) |
Unemployment
(in %) |
Government debt
(in % of GDP) |
|---|---|---|---|---|---|---|---|---|
| 1980 | 511.8 | 9,085.1 | 603.6 | 10,715.4 | 7.1% | 42.6% | ||
| 1981 | ||||||||
| 1982 | ||||||||
| 1983 | ||||||||
| 1984 | ||||||||
| 1985 | ||||||||
| 1986 | ||||||||
| 1987 | ||||||||
| 1988 | ||||||||
| 1989 | ||||||||
| 1990 | ||||||||
| 1991 | ||||||||
| 1992 | ||||||||
| 1993 | ||||||||
| 1994 | ||||||||
| 1995 | ||||||||
| 1996 | ||||||||
| 1997 | ||||||||
| 1998 | ||||||||
| 1999 | ||||||||
| 2000 | ||||||||
| 2001 | ||||||||
| 2002 | ||||||||
| 2003 | ||||||||
| 2004 | ||||||||
| 2005 | ||||||||
| 2006 | ||||||||
| 2007 | ||||||||
| 2008 | ||||||||
| 2009 | ||||||||
| 2010 | ||||||||
| 2011 | ||||||||
| 2012 | ||||||||
| 2013 | ||||||||
| 2014 | ||||||||
| 2015 | ||||||||
| 2016 | ||||||||
| 2017 | ||||||||
| 2018 | ||||||||
| 2019 | ||||||||
| 2020 | ||||||||
| 2021 | ||||||||
| 2022 | ||||||||
| 2023 | ||||||||
| 2024 | ||||||||
| 2025 | ||||||||
| 2026 | ||||||||
| 2027 |
See also edit
Notes edit
- ^ 6 April – 5 April for personal tax
- ^ a b Forecast
- ^ In employment and aged 16 or over (quantity) or aged 16–64 (percent)
- ^ Percent is a proportion of all persons in employment aged 16 and over
- ^ Unemployed aged 16 and over. Percent is a proportion of economically active.
- ^ Median gross weekly pay for full time employees resident in the UK
- ^ a b c d Goods and services
- ^ a b Excluding services
- ^ Official development assistance, donor
- ^ Compared to 279% in Japan, 253% in France, 209% in the United States, 206% in Canada, and 198% in Germany.
- ^ It was still very unbalanced,[110] with consumption accounting for 100% of growth in that year.[111]
- ^ For comparison, Germany saved 9% of GDP and Russia saved 5%, while Japan, Greece, Spain, Italy and China saved between 1% and 3%.
References edit
- ^ "Groups and Aggregates Information". International Monetary Fund. Retrieved 13 February 2024.
- ^ "World Bank Country and Lending Groups". World Bank. Retrieved 13 February 2024.
- ^ "Estimates of the population for the UK, England, Wales, Scotland, and Northern Ireland". Office for National Statistics. 26 March 2024. Retrieved 12 April 2024.
- ^ a b c d "World Economic Outlook Database". International Monetary Fund. 16 April 2024. Retrieved 16 April 2024.
- ^ a b c d "Real GDP Growth". International Monetary Fund. Retrieved 13 February 2024.
- ^ "Consumer price inflation, UK: March 2024". Office for National Statistics. 17 April 2024. Retrieved 17 April 2024.
- ^ "Interest rates and Bank Rate". Bank of England. 14 December 2023. Retrieved 14 February 2024.
- ^ a b c d "United Kingdom". The World Factbook. Central Intelligence Agency. Retrieved 13 February 2024.
- ^ "Income inequality". OECD Data. OECD. Retrieved 12 February 2024.
- ^ a b "Human Development Report 2023/2024" (PDF). United Nations Development Programme. 13 March 2024. Archived (PDF) from the original on 13 March 2024. Retrieved 21 April 2024.
- ^ a b c d "Labour Market Profile". Nomis. Office for National Statistics. Retrieved 13 February 2024.
- ^ a b c d e f g "UK trade in numbers (web version)". gov.uk. 19 January 2024. Retrieved 13 February 2024.
- ^ a b McCrae, Richard (31 October 2023). "UK Balance of Payments, The Pink Book: 2023". Office for National Statistics. Retrieved 13 February 2024.
- ^ "IMF BoP IIP UK gross external debt NSA £m". Office for National Statistics. 28 March 2024. Retrieved 12 April 2024.
- ^ a b c d Keep, Matthew (15 January 2024). "The budget deficit: a short guide". House of Commons Library. Retrieved 13 February 2024.
- ^ "Official development assistance (ODA)". OECD. Retrieved 13 February 2024.
- ^ "United Kingdom 'AA/A-1+' Ratings Affirmed; Outlook Stable". S&P Global Ratings. 20 October 2023. Retrieved 13 February 2024.
- ^ "Moody's boosts view of UK after mini-Budget chaos". BBC News. 20 October 2023. Retrieved 13 February 2024.
- ^ "United Kingdom". Fitch Ratings. Retrieved 13 February 2024.
- ^ "Scope affirms United Kingdom's credit ratings at AA with a Stable Outlook". Scope Ratings. 3 November 2023. Retrieved 13 February 2024.
- ^ a b "HMT statistical release: UK official holdings of international reserves". gov.uk. 5 February 2024. Retrieved 13 February 2024.
- ^ a b Hawkins, Nigel (13 October 2010). "Privatization Revisited" (PDF). Retrieved 25 September 2014.
- ^ a b Griffiths, Alan; Wall, Stuart (16 July 2011). "Applied Economics" (PDF). Archived from the original (PDF) on 20 June 2013. Retrieved 25 September 2014.
- ^ Thane, Pat (2019). "The Origins of the British Welfare State". The Journal of Interdisciplinary History. 50 (3): 427–433. doi:10.1162/jinh_a_01448. S2CID 208223636.
- ^ a b "Global Economy Watch - Projections > Real GDP / Inflation > Share of 2016 world GDP". PWC. Retrieved 23 June 2017.
- ^ Thane, P. (1989). "The British Welfare State: Its Origins and Character". New Directions in Economic and Social History. pp. 143–154. doi:10.1007/978-1-349-20315-4_12. ISBN 978-0-333-49569-8.
- ^ "KOF Globalization Index". Globalization.kof.ethz.ch. Retrieved 5 September 2012.
- ^ "A Beginners Guide to UK Geography (2023)". Open Geography Portal. Office for National Statistics. 24 August 2023. Retrieved 9 December 2023.
- ^ "Exports of goods and services (BoP, current US$)". World Bank. Retrieved 14 February 2024.
- ^ "Imports of goods and services (BoP, current US$)". World Bank. Retrieved 14 February 2024.
- ^ "Foreign direct investment, net outflows (BoP, current US$)". World Bank. Retrieved 14 February 2024.
- ^ "Foreign direct investment, net inflows (BoP, current US$)". World Bank. Retrieved 14 February 2024.
- ^ Ward, Matthew (11 May 2023). "Statistics on UK-EU trade". House of Commons Library. Retrieved 13 February 2024.
- ^ Kenworthy, Lane (1999). "Do Social-Welfare Policies Reduce Poverty? A Cross-National Assessment" (PDF). Social Forces. 77 (3): 1119–1139. doi:10.2307/3005973. JSTOR 3005973. Archived (PDF) from the original on 10 August 2013.
- ^ Moller, Stephanie; Huber, Evelyne; Stephens, John D.; Bradley, David; Nielsen, François (2003). "Determinants of Relative Poverty in Advanced Capitalist Democracies". American Sociological Review. 68 (1): 22–51. doi:10.2307/3088901. JSTOR 3088901.
- ^ "Social Expenditure – Aggregated data".
- ^ a b Harari, Danie (13 April 2023). "A3: Components of GDP" (PDF). House of Commons Library. Retrieved 24 April 2023.
- ^ Reid, David (19 September 2019). "New York stretches lead over London as the world's top financial center, survey shows". CNBC.
- ^ "GFCI 27 Rank - Long Finance". www.longfinance.net. Retrieved 29 August 2020.
- ^ Johansson, Eric (29 March 2022). "'Brexit delayed UK tech scene's $1tn valuation,' industry leaders say". Verdict.
- ^ Wipfer, Laura (12 June 2017). "Facts and Figures 2017". ADS Group. Retrieved 25 June 2017.
- ^ Monaghan, Angela (22 April 2014). "Pharmaceutical industry drives British research and innovation". The Guardian. Retrieved 25 June 2017.
- ^ "Global 500". Fortune. Retrieved 28 August 2022.
- ^ "Crude oil and petroleum: production, imports and exports 1890 to 2015". Department for Business, Energy & Industrial Strategy. 25 August 2016. Retrieved 18 October 2016.
- ^ "London - Internal Market, Industry, Entrepreneurship and SMEs". European Commission. 23 July 2010.
- ^ Perry, Marvin; Jacob, Margaret C.; Chase, Myrna; Jacob, James R. (2009). Western Civilization: Ideas, Politics, and Society (9th ed.). Boston: Houghton Mifflin Harcourt. p. 503. ISBN 978-0-547-14701-7.
- ^ "Productivity Growth In The Industrial Revolution" (PDF). Archived from the original (PDF) on 25 October 2005. Retrieved 8 February 2014.
- ^ "Accounting for the Industrial Revolution" (PDF). Archived from the original (PDF) on 14 May 2013. Retrieved 26 December 2012.
- ^ Ferguson, Niall (2004). Empire, The rise and demise of the British world order and the lessons for global power. Basic Books. ISBN 0-465-02328-2.
- ^ Maddison, Angus (2006). The World Economy. Development Centre of the Organisation for Economic Co-operation and Development. p. 263. ISBN 978-92-64-02261-4.
- ^ Levy, Charles; Sissons, Andrew; Holloway, Charlotte (28 June 2011). "A plan for growth in the knowledge economy" (PDF). The Work Foundation. Archived from the original (PDF) on 2 June 2013. Retrieved 25 September 2014.
- ^ "A Regional Perspective on the Knowledge Economy in Great Britain" (PDF). Archived from the original (PDF) on 21 September 2013. Retrieved 8 February 2014.
- ^ Bolshaw, Liz (29 February 2012). "The future of work is the knowledge economy". FT.com. Archived from the original on 10 December 2022. Retrieved 1 February 2013.
- ^ "A survey of the liberalisation of public enterprises in the UK since 1979" (PDF). Retrieved 8 February 2014.
- ^ "Acknowledgements" (PDF). Retrieved 8 February 2014.
- ^ Hawkins, Nigel (4 April 2008). "Privatization – Reviving the Momentum" (PDF). Adam Smith Institute, London. Archived from the original (PDF) on 1 June 2013. Retrieved 25 September 2014.
- ^ Hodge, Graeme (28 October 2011). "Revisiting State and Market through Regulatory Governance: Observations of Privatisation, Partnerships, Politics and Performance" (PDF). Archived from the original (PDF) on 21 September 2013. Retrieved 25 September 2014.
- ^ Broadberry, Stephen; Howlett, Peter (1998). "The United Kingdom: 'Victory at all costs'". In Harrison, Michael (ed.). The economics of World War II: Six great powers in international comparison (PDF). Cambridge University Press. p. 69.
- ^ Parker, David (2009). The Official History of Privatisation: The Formative Years 1970–1987. Vol. 1. Routledge. p. 7. ISBN 978-1-134-03140-5.
- ^ Denman, James; McDonald, Paul (1996). "Unemployment statistics from 1881 to the present day". Labour Market Trends. 104 (15–18). The Government Statistical Office.
- ^ J. Christopher R. Dow; Dow, Christopher (2000). Major Recessions: Britain and the World, 1920-1995. Oxford University Press. ISBN 978-0-19-924123-1.
- ^ High, Steven (November 2013). ""The wounds of class": a historiographical reflection on the study of deindustrialization, 1973–2013". History Compass. 11 (11). Wiley: 994–1007. doi:10.1111/hic3.12099.
- ^ Gat, Azar (2008). War in Human Civilization. Oxford University Press. p. 519. ISBN 978-0-19-923663-3.
- ^ Laybourn, Keith (1999). Modern Britain Since 1906: A Reader. I.B.Tauris. p. 230. ISBN 978-1-86064-237-1.
- ^ "Historical coal data: coal production, availability and consumption 1853 to 2015". Department for Business, Energy & Industrial Strategy. 2016.
- ^ a b Broadberry, Stephen (2003). Floud, Roderick; Johnson, Paul (eds.). The Cambridge Economic History of Modern Britain. Vol. 3. Cambridge University Press. p. 66. ISBN 978-0-521-52738-5.
- ^ Matthews, Kent; Minford, Patrick; Nickell, Stephen; Helpman, Elhanan (1987). "Mrs Thatcher's Economic Policies 1979-1987". Economic Policy. 2 (5): 59–101. doi:10.2307/1344621. ISSN 0266-4658. JSTOR 1344621.
- ^ Phillip Inman, "Reports of recovery much exaggerated, says CBI", The Guardian (UK), 15 June 2009, p. 21.
- ^ a b "Edit/Review Countries". Imf.org. 29 April 2003. Archived from the original on 11 June 2010. Retrieved 5 September 2012.
- ^ a b The ONS figures, reproduced by the Local Government Association, "From Recession to recovery", November 2008. Retrieved 13-05-09, p. 7, are slightly lower, giving 4.5% in 1988. Archived 2 November 2011 at the Wayback Machine
- ^ a b c d "How Britain changed under Margaret Thatcher". The Guardian. 8 April 2013. Retrieved 7 April 2016.
- ^ ONS (5 June 2013). "170 Years of Industrial Change across England and Wales". The National Archives. Archived from the original on 5 January 2016. Retrieved 6 December 2016.
- ^ "UK Politics | The Basics | past_elections | 1983: Thatcher triumphs again". BBC News. 5 April 2005. Retrieved 5 September 2012.
- ^ a b Elliott, Larry (22 December 2009). "UK recession longest and deepest since war, says ONS". The Guardian. Retrieved 9 July 2009.
- ^ Machin, Stephen (6 April 2015). "Real wages and living standards: the latest UK evidence". London School of Economics. Retrieved 31 October 2016.
- ^ Wheeler, Brian (21 July 2009). "UK | UK Politics | Election countdown – 1990s style". BBC News. Retrieved 5 September 2012.
- ^ Rogers, Simon; Sedghi, Ami (12 November 2013). "UK inflation since 1948". The Guardian. Retrieved 2 June 2017.
- ^ ONS unemployment rate bulletin
- ^ OECD (16 July 1998). OECD Economic Surveys: United Kingdom 1998. OECD Publishing. p. 20. ISBN 978-92-64-15145-1.
- ^ "A brief history of the third way". TheGuardian.com. 10 February 2003.
- ^ Davis, Evan (10 May 2007). "Blair's surprising economic legacy". BBC News. Retrieved 5 September 2012.
- ^ Horsley, Mark (28 March 2015). The Dark Side of Prosperity: Late Capitalism's Culture of Indebtedness. Ashgate Publishing. p. 31. ISBN 978-1-4724-3657-3.
- ^ Giudice, Gabriele; Kuenzel, Robert; Springbett, Tom (2012). UK Economy: The Crisis in Perspective. Routledge. p. 205. ISBN 978-1-136-31210-6.
- ^ "UK unemployment falls by 32,000". BBC News. 19 March 2008. Retrieved 5 September 2012.
- ^ "Unemployment rise continues to slow". BBC News. 16 December 2009. Retrieved 5 September 2012.
- ^ "Twin Global Shocks Dent United Kingdom Outlook". Imf.org. 11 August 2008. Retrieved 5 September 2012.
- ^ "United Kingdom – 2008 Article IV Consultation Concluding Statement of the Mission, 23 May 2008". Imf.org. 23 May 2008. Retrieved 5 September 2012.
- ^ "Labour productivity per hour worked". epp.eurostat.ec.europa.eu. Archived from the original on 20 May 2012. Retrieved 25 September 2014.
- ^ "UK interest rates lowered to 0.5%". BBC News. 5 March 2009. Retrieved 2 October 2016.
- ^ "UK economy shrinks less than thought". BBC News. 25 November 2009.
- ^ Meyer, Annette (2012). Value Added / 14 National Labor Forces. Dorrance Publishing. p. 170. ISBN 978-1-4349-7375-7.
- ^ Peston, Robert (21 November 2011). "UK's debts 'biggest in the world'". BBC News. Retrieved 2 June 2017.
- ^ Stewart, Heather; Wintour, Patrick (18 February 2015). "UK employment rate hits highest level since records began". The Guardian. Retrieved 8 June 2015.
- ^ Wholehouse, Matthew (24 July 2014). "UK has fastest-growing economy, International Monetary Fund says". The Telegraph. London. Archived from the original on 11 January 2022. Retrieved 8 June 2015.
- ^ Jackson, Gavin (5 January 2018). "UK productivity grows at quickest pace in six years". Financial Times. Archived from the original on 10 December 2022. Retrieved 6 January 2018.
- ^ "UK productivity gap widens to worst level since records began". The Guardian. 18 February 2016. Retrieved 7 April 2016.
- ^ Giles, Chris (6 December 2016). "UK suffering 'first lost decade since 1860s', Carney says". Financial Times. Archived from the original on 10 December 2022. Retrieved 6 December 2016.(subscription required)
- ^ Allen, Katie; Elliott, Larry (27 July 2016). "UK joins Greece at bottom of wage growth league". The Guardian. Retrieved 31 October 2016.
- ^ "UK's current account deficit jumps to 'eye watering' record high". The Telegraph. 31 March 2016. Archived from the original on 11 January 2022. Retrieved 7 April 2016.
- ^ "UK current account deficit at new high". BBC News. 31 March 2016. Retrieved 7 July 2016.
- ^ Conway, Ed (5 July 2016). "The £22bn current account deficit mystery". Sky News. Retrieved 10 July 2016.
- ^ Evans-Pritchard, Ambrose (31 March 2016). "Britain courts fate on Brexit with worst external deficit in history". The Telegraph. Archived from the original on 11 January 2022. Retrieved 23 October 2016.
- ^ Allen, Katie (21 March 2016). "Current account deficit hits record high as GDP revised higher". The Guardian. Retrieved 23 October 2016.
- ^ Lanchester, John (9 September 2018). "After the Fall". The Sunday Times Magazine. p. 29.
- ^ Read, Simon (13 January 2016). "Is the UK facing a debt disaster?". Independent. Retrieved 8 July 2016.
- ^ Stewart, Heather (9 December 2015). "Recovery 'too reliant on consumer debt' as BCC downgrades forecast". The Guardian. Retrieved 8 July 2016.
- ^ Cadman, Emily; Giles, Chris (3 January 2016). "Economists' forecasts: Fears over balance of recovery". Financial Times. Retrieved 8 July 2016.(subscription required)
- ^ Khan, Mehreen (12 January 2016). "Britain's recovery is not driven by debt, says Mark Carney". The Telegraph. Archived from the original on 11 January 2022. Retrieved 8 July 2016.
- ^ Elliott, Larry; Monaghan, Angela (12 February 2014). "Interest rates on hold as Bank says recovery 'unsustainable'". The Guardian. Retrieved 8 July 2016.
- ^ Allen, Katie (1 January 2017). "Why the UK economy could fare better in 2017 than forecasters predict". The Guardian. Retrieved 13 June 2017.
- ^ Eaton, George (28 April 2017). "The economic slowdown is another reason Theresa May called an early election". New Statesman. Retrieved 8 June 2017.
- ^ "UK interest rates cut to 0.25%". BBC News. 4 August 2016. Retrieved 2 October 2016.
- ^ Giles, Chris (22 April 2019). "UK's low national savings rate raises fear of trouble ahead". Financial Times. Archived from the original on 10 December 2022.
- ^ "Coronavirus: UK interest rates cut to lowest level ever". BBC News. 19 March 2020.
- ^ "Gross Domestic Product: Quarter on Quarter growth: CVM SA %". Office for National Statistics. 31 March 2020. Retrieved 10 May 2020.
- ^ Elliott, Larry (4 May 2020). "Nearly a quarter of British employees furloughed in last fortnight". The Guardian. Retrieved 11 May 2020.
- ^ Partington, Richard (12 August 2020). "Covid-19: UK economy plunges into deepest recession since records began". The Guardian.
- ^ Strauss, Delphine (12 August 2020). "UK economy suffers worst slump in Europe in second quarter". Financial Times. Archived from the original on 10 December 2022.
- ^ "Quantitative Easing". Bank of England. Retrieved 16 April 2020.
- ^ Romei, Valentina; Giles, Chris (12 February 2021). "UK suffers biggest drop in economic output in 300 years". Archived from the original on 10 December 2022.
- ^ Keep, Matt (25 January 2022). "Economic update: Economy was back to pre-pandemic level before Omicron". House of Commons Library.
- ^ Partington, Richard (22 September 2022). "UK in recession, says Bank of England as it raises interest rates to 2.25%". The Guardian.
- ^ The Editorial Board (16 October 2022). "Global economic warning lights are flashing red". Financial Times. Archived from the original on 10 December 2022.
- ^ Smith, Alan; Sheppard, David (7 September 2022). "How do household energy bills compare across Europe?". Financial Times. Retrieved 22 December 2022.
- ^ Stubbington, Tommy (1 November 2022). "Bank of England begins selling bonds as it unwinds QE programme". Financial Times. Archived from the original on 10 December 2022.
- ^ King, Ben (1 November 2022). "Bank makes history as it reverses quantitative easing". BBC News.
- ^ "Bank of England begins selling government bonds". The Guardian. 1 November 2022.
- ^ Milliken, David (1 September 2023). "UK economy surpassed pre-COVID size in late 2021, new data shows". Reuters. Retrieved 2 September 2023.
- ^ "More About the Bank". Archived from the original on 12 March 2008. Retrieved 8 August 2008. Bank of England – Retrieved 8 August 2008
- ^ a b "Comprehensive Spending Review 2010" (PDF). HM Treasury. Retrieved 23 August 2015.
- ^ a b "Britain's public debt since 1974" The Guardian, 1 March 2009
- ^ a b "Statistical Bulletin Office for National Statistics: Public Sector Finances, June 2014" (PDF). 25 September 2014. Retrieved 25 September 2014.
- ^ DEFRA, p. 148.
- ^ a b c Department for Environment, Food and Rural Affairs (21 October 2022). "National Statistics, Chapter 4: Accounts". Defra. Retrieved 24 April 2023.
- ^ DEFRA, pp. 41–42.
- ^ DEFRA, p. 141.
- ^ Lydall, Ross (23 April 2021). "Transport for London chief Andy Byford targets Christmas opening of delayed Crossrail project". Evening Standard.
- ^ "Crossrail Regional Map". Crossrail Ltd. Archived from the original on 24 October 2010. Retrieved 8 September 2013.
- ^ "Crossrail's giant tunnelling machines unveiled". BBC News. 2 January 2012.
- ^ "HS2 Overview". House of Commons Library.
- ^ Britain moves a step closer to building new nuclear reactors, Financial Times, 9 January 2008
- ^ Chris Cook and John Stevenson, Longman companion to Britain since 1945 (1996). pp 167-68.
- ^ "UK manufacturers provide a strong foundation for growth in the UK" EEF (2017)
- ^ Hennik Research. Annual Manufacturing Report: 2017 (Dec. 2016) Archived 31 January 2017 at the Wayback Machine
- ^ a b c d e f g h "Release: United Kingdom National Accounts, The Blue Book, 2013 Edition". Office for National Statistics. 31 July 2013. Retrieved 13 August 2013.
- ^ a b "Manufacturing in the UK: An economic analysis of the sector" (PDF). Department for Business, Innovation & Skills. Retrieved 25 April 2011.
- ^ "The future of UK manufacturing: Reports of its death are greatly exaggerated" (PDF). PricewaterhouseCoopers. Archived from the original (PDF) on 19 July 2011. Retrieved 25 April 2011.
- ^ a b c "Motor Industry Facts 2010" (PDF). SMMT. Archived from the original (PDF) on 27 November 2010. Retrieved 28 February 2011.
- ^ "United Kingdom Business Directory | List of Companies". bizpages.org.
- ^ "Facts & Figures – 2009" (PDF). Aerospace & Defence Association of Europe. Archived from the original (PDF) on 24 December 2010. Retrieved 13 May 2011.
- ^ "UK Aerospace Industry Survey – 2010". ADS Group. Archived from the original on 8 January 2014. Retrieved 13 May 2011.
- ^ "Aerospace". UK Trade & Investment. Archived from the original on 24 October 2010. Retrieved 20 October 2010.
- ^ Robertson, David (9 January 2009). "The Aerospace industry has thousands of jobs in peril". The Times. London. Retrieved 20 October 2010.
- ^ "Rolls-Royce Wins $2 Billion Air China, Ethiopian Airlines Deals". Bloomberg L.P. 14 November 2009. Retrieved 8 September 2010.
- ^ "Industry Breakdown of Companies in United Kingdom", HitHorizons
- ^ "Airbus in the United Kingdom". Airbus. Retrieved 17 December 2019.
- ^ Bawden, Tom; Rose, David (27 January 2009). "Gordon Brown plans tonic for pharmaceutical industry". The Times. London. Retrieved 27 October 2010.
- ^ "The pharmaceutical industry and market in the UK". The Association of the British Pharmaceutical Industry. Archived from the original on 14 December 2014. Retrieved 14 December 2014.
- ^ "Facts & Statistics from the pharmaceutical industry". The Association of the British Pharmaceutical Industry. Archived from the original on 18 September 2010. Retrieved 27 October 2010.
- ^ "British regulator calls for drug pricing overhaul". The New York Times. 27 January 2009. Retrieved 27 October 2010.
- ^ "Global 500 – Pharmaceuticals". Fortune. 20 July 2009. Retrieved 27 October 2010.
- ^ a b c "United Kingdom – Quick Facts Energy Overview". US Energy Information Administration. Archived from the original on 18 September 2010. Retrieved 4 November 2010.
- ^ a b c "United Kingdom – Oil". US Energy Information Administration. Archived from the original on 18 September 2010. Retrieved 4 November 2010.
- ^ a b "United Kingdom – Natural Gas". US Energy Information Administration. Archived from the original on 18 September 2010. Retrieved 4 November 2010.
- ^ The Coal Authority (2007). "Coal Reserves in the United Kingdom" (PDF). Response to Energy Review. The Coal Authority. Archived from the original (PDF) on 10 September 2008. Retrieved 23 September 2008.
- ^ "England Expert predicts 'coal revolution'". BBC News. 16 October 2007. Retrieved 23 September 2008.
- ^ Mason, Rowena (24 October 2009). "Let the battle begin over black gold". The Daily Telegraph. London. Archived from the original on 11 January 2022. Retrieved 26 November 2010.
- ^ Heath, Michael (26 November 2010). "RBA Says Currency Containing Prices, Rate Level 'Appropriate' in Near Term". Bloomberg L.P. Retrieved 26 November 2010.
- ^ "From the Margins to the Mainstream – Government unveils new action plan for the creative industries". DCMS. 9 March 2007. Archived from the original on 4 December 2008. Retrieved 9 March 2007.
- ^ "MediaCityUK – Talent Pool". MediaCityUK. Archived from the original on 25 September 2011. Retrieved 11 October 2011.
- ^ "LFW: Fashion industry worth 26 billion pound to UK economy". FashionUnited Group. 17 February 2014. Retrieved 17 February 2014.
- ^ "Which is the world's biggest employer?". BBC News. 20 March 2012.
- ^ "Labour gets into bed with private medicine". The Guardian. London. 19 November 2000. Retrieved 11 November 2010.
- ^ "At 60, the NHS needs reality check". Reuters. 3 July 2008. Retrieved 11 November 2010.
- ^ HM Treasury (24 March 2008). "Budget 2008, Corrections to Table C11" (PDF). p. 1. Archived from the original (PDF) on 25 February 2009. Retrieved 27 December 2008.
- ^ a b "Higher education in facts and figures – Summer 2009" (PDF). Universities UK. Archived from the original (PDF) on 15 February 2010. Retrieved 29 January 2011.
- ^ Sassen, Saskia (2001). The Global City: New York, London, Tokyo (2nd ed.). Princeton University Press.
- ^ "Special Report – The Global 2000" Forbes, 2 April 2008
- ^ "HSBC tops Forbes 2000 list of world's largest companies," HSBC website, 4 April 2008 Archived 13 January 2013 at the Wayback Machine
- ^ "UK law firms reap rich rewards while Americans strengthen London teams". Financial News. 23 July 2007. Retrieved 11 August 2010.
- ^ Lazarowicz (Labour MP), Mark (30 April 2003). "Financial Services Industry". United Kingdom Parliament. Retrieved 17 October 2008.
- ^ "Leeds leading the way". Yorkshire Evening Post. Archived from the original on 1 May 2009. Retrieved 25 January 2009.
- ^ "Leeds Financial Facts and Figures". leedsfinancialservices.org.uk. Archived from the original on 30 January 2009. Retrieved 25 January 2009.
- ^ "Northern Star". FDI Magazine. Archived from the original on 1 January 2009. Retrieved 25 January 2009.
- ^ "Leeds Services". Financial Times. Archived from the original on 10 December 2022. Retrieved 25 January 2009.
- ^ "Leeds Legal Review". Law Gazette. Archived from the original on 30 April 2009. Retrieved 25 January 2009.
- ^ "Live the Leeds Lifestyle". Legal Week Magazine. Archived from the original on 29 April 2009. Retrieved 25 January 2009.
- ^ Dark money: London's dirty secret The Financial Times, 11 May 2016.
- ^ London is now the global money-laundering centre for the drug trade, says crime expert The Independent, 4 July 2015.
- ^ Cameron's corrupt countries slip puts spotlight on UK Anadolu Agency, 13 May 2016.
- ^ "Russian money infects London". 31 March 2015.
- ^ "UK draws billions in unrecorded inflows, much from Russia - study". Reuters. 10 March 2015.
- ^ Davenport, Justin (9 October 2015). "'Chip and sin' cash boom for crooks". London Evening Standard. p. 1.
- ^ Ruddick, Graham (27 January 2011). "Capital Shopping Centres seals £1.6bn Trafford Centre deal despite Simon Property Group's concerns". The Telegraph. London. Archived from the original on 11 January 2022. Retrieved 15 September 2011.
Capital Shopping Centres has sealed the UK's largest ever property transaction after 80pc of shareholders backed its £1.6bn acquisition of the Trafford Centre.
- ^ Henretty, Nigel (17 March 2017). "Housing affordability in England and Wales: 1997 to 2016". ONS. Retrieved 14 June 2017.
- ^ "GDP boosted by £158bn of 'phantom rent'". New Economics Foundation. Archived from the original on 20 April 2016. Retrieved 7 April 2016.
- ^ "Annual Survey of Visits to Visitor Attractions: Latest results". Visit Britain. 22 November 2016. Retrieved 22 April 2021.
- ^ "Inbound tourism performance - 2019 snapshot". VisitBritain. 28 April 2015. Archived from the original on 21 April 2021. Retrieved 22 April 2021.
- ^ "Top 100 City Destinations: 2019 Edition". Euromonitor International. Retrieved 22 April 2021.
- ^ "Markets & Segments". Visit Britain. Retrieved 22 April 2021.
- ^ "2021 tourism forecast". 20 April 2015. Retrieved 8 April 2021.
From mid-March to mid-July, COVID-19 triggered a near-total shutdown in international tourism ... there was an increase in visitor numbers from this low point, although they remained very low, and dipped again towards the end of the year.
- ^ "2021 tourism forecast". 20 April 2015. Retrieved 8 April 2021.
forecast assumes a slow recovery in early 2021 before a step change in the spring ... followed by a gradual recovery throughout the rest of the year and beyond.
- ^ "COVID-19 (new coronavirus) - latest information and advice for businesses". 4 November 2020. Retrieved 8 April 2021.
whether non-essential international travel can resume on 17 May, or whether we will need to wait longer before lifting the outbound travel restriction.
- ^ "European travel restrictions: Nonessential travel curbed". Deutsche Welle. Retrieved 8 April 2021.
Amid the coronavirus pandemic, many countries worldwide continue to restrict entry and most travel remains discouraged.
- ^ Whalan, Roscoe (5 April 2021). "Boris Johnson refuses to set hard date for Britain to reopen for international travel". ABC News. Retrieved 8 April 2021.
Amid the coronavirus pandemic, many countries worldwide continue to restrict entry and most travel remains discouraged.
- ^ "Covid travel restrictions have ended in the UK". BBC News. 18 March 2022. Retrieved 9 December 2023.
- ^ "Road Lengths in Great Britain 2017" (PDF). Department of Transport. 5 July 2018.
- ^ "Rail infrastructure, assets and environmental 2017-18 Annual Statistical Release" (PDF). gov.uk. Office of Rail and Road. 18 October 2018.
- ^ "Northern Ireland Railways Network Statement 2019" (PDF). www.translink.co.uk. Northern Ireland Railways. 30 March 2018. Archived from the original (PDF) on 20 August 2017. Retrieved 12 January 2019.
- ^ "HS2: MPs had 'enormously wrong' cost estimate, says whistleblower". BBC News. 17 December 2018.
- ^ "Crossrail: London 'to bear cost' of delayed line opening". BBC News. 24 October 2018.
- ^ "M6Toll Frequently asked questions". M6toll.co.uk. Archived from the original on 13 January 2013. Retrieved 5 September 2012.
- ^ "Tackling congestion on our roads". Department for Transport. Archived from the original on 13 May 2010.
- ^ a b "Size of Reporting Airports February 2017 - January 2018" (PDF). civil Aviation Authority. Retrieved 12 January 2019.
- ^ Google. "London Heathrow Airport" (Map). Google Maps. Google.
- ^ "The 10 busiest airports in the world". The Independent. 5 February 2018. Retrieved 12 January 2019.
- ^ "BMI being taken over by Lufthansa". BBC News. 29 October 2008. Retrieved 29 June 2011.
- ^ "London's airports handle 44 million more passengers than in 2010; four of the top five airlines don't serve Heathrow". Airline Network News & Analysis. 23 August 2018.
- ^ Heath, Allister (16 June 2016). "Why Britain's shopping spree will come at a cost". The Telegraph. Archived from the original on 11 January 2022. Retrieved 18 June 2016.
- ^ Evans, Judith (22 June 2019). "Death of the high street weighs on landlords round the world". Financial Times. Archived from the original on 10 December 2022. Retrieved 22 June 2019.
- ^ "Great Britain: Grocery Market Share (12 weeks ending)". Kantar Worldpanel. Retrieved 28 March 2023.
- ^ "'Big four no more': where now for UK grocers as Aldi overtakes Morrisons?". The Guardian. 17 September 2022.
- ^ Potter, Mark (17 February 2011). "London tops world cities spending league". Reuters. Retrieved 14 May 2011.
- ^ "Europe: turnover of the top 15 retailers 2019". Statista. Retrieved 4 December 2020.
- ^ Chavez-Dreyfuss, Gertrude (1 April 2008). "Global reserves, dollar share up at end of 2007-IMF". Reuters. Archived from the original on 9 January 2009. Retrieved 21 December 2009.
- ^ Treneman, Ann (24 July 2007). "Puritanism comes too naturally for 'Huck' Brown". Times Online. London. Retrieved 24 July 2007.
- ^ "Joining the Euro, all companies' polls". Mori.com. Archived from the original on 24 July 2008. Retrieved 5 September 2012.
- ^ "EMU Entry and EU Constitution". MORI. 28 February 2005. Retrieved 17 May 2006.
- ^ a b c d e f g "Yearly Average Currency Exchange Rates". IRS.
- ^ a b c d "Exchange Rate History". EXRATES.
- ^ a b "Regional economic activity by gross domestic product, UK: 1998 to 2020". www.ons.gov.uk. 30 May 2022.
- ^ "November 2018 release". www.ons.gov.uk. UK trade - Office for National Statistics. Retrieved 11 January 2019.
- ^ "Where does export to? (2017) | OEC".
- ^ "Where does import from? (2017) | OEC".
- ^ "UK economy to receive £1 billion boost through innovative trade digitalisation act". 20 July 2023.
- ^ "The fDi Report 2014 – Europe". FDi Magazine. June 2014. Retrieved 17 July 2014.
- ^ Evans-Pritchard, Ambrose (15 October 2017). "Britain's missing billions: Revised figures reveal UK is £490bn poorer than previously thought". The Telegraph. Archived from the original on 11 January 2022. Retrieved 15 October 2017.
- ^ a b "Exploring foreign investment: where does the UK invest, and who invests in the UK? - Office for National Statistics". www.ons.gov.uk. Retrieved 21 August 2023.
- ^ "M&A UK - Mergers and Acquisitions United Kingdom, England". IMAA-Institute. Retrieved 22 February 2018.
- ^ "New UK reports back EU powers, enrage eurosceptics". EUobserver. 13 February 2014. Retrieved 16 February 2014.
- ^ "Balance of EU competences review: research and development". UK Government. 13 February 2014. Retrieved 16 February 2014.
- ^ "Brexit: All you need to know about the UK leaving the EU". BBC News. British Broadcasting Corporation. 21 May 2015. Retrieved 6 May 2019.
- ^ "PM agrees to Brexit extension - but urges election". 28 October 2019. Retrieved 28 October 2019.
- ^ UK avoids recession but Brexit uncertainty damages growth The Guardian
- ^ "Government acts to protect jobs in every part of the UK". Government of UK. Retrieved 15 July 2020.
- ^ "Growing unequal?". OECD website. 2008. Retrieved 20 September 2010.
- ^ "People at risk of poverty after social transfers". Eurostat.
- ^ "United Kingdom: Numbers in low income". The Poverty Site. Archived from the original on 13 July 2010. Retrieved 25 September 2009.
- ^ "United Kingdom: Children in low income households". The Poverty Site. Archived from the original on 22 June 2009. Retrieved 25 September 2009.
- ^ Government gambles by excluding climate change from flood insurance deal Archived 19 October 2016 at the Wayback Machine FOE 6 December 2013
- ^ [1] Archived 14 March 2021 at the Wayback Machine WWF-UKMay 2017
- ^ Taylor, Chloe. "Britain's economy is already seeing a rapid shift due to climate change". CNBC. Archived from the original on 23 August 2022. Retrieved 23 August 2022.
- ^ Storm Dennis damage could cost insurance companies £225m Archived 20 April 2021 at the Wayback Machine Guardian 20 February 2020
- ^ Storm Ciara expected to cost up to £200m in insurance claims Archived 6 August 2020 at the Wayback Machine Guardian 14 February 2020
- ^ Cameron's claims on flood defences don't stack up Archived 23 October 2017 at the Wayback Machine FOE 6 January 2014
- ^ Stern, N. (2006). "Summary of Conclusions". Executive summary (short) (PDF). Stern Review Report on the Economics of Climate Change (pre-publication edition). HM Treasury. Archived (PDF) from the original on 1 July 2019. Retrieved 28 April 2011.
- ^ "HM Treasury" (PDF). GOV.UK. 22 November 2023. Archived from the original on 20 September 2008.
- ^ "Report for Selected Countries and Subjects".
Bibliography edit
- DEFRA (2020). Agriculture in the United Kingdom 2019. HM Government. ISBN 978-1-8397-2093-2.
Further reading edit
- Gregg, Pauline. A Social and Economic History of Britain: 1760–1950 (1950) online
External links edit
- Economy at the Office for National Statistics
- UK profile at the CIA World Factbook
- UK profile at The World Bank