


Summary
Education graphics, or edugraphics, are graphic visual representations of educational information intended to simplify social-cultural content, communication-related content, linguistic content, etc. The use of rich visual content improves cognition, as the students comprehension is enhanced when both visual and text-based cues are combined.
Edugraphics have existed since learning manuals began to be used in elementary schools, high schools and universities.[1][2] These edugraphics, known by the term infographics or "information graphics", are used to explain different subjects (geography, history, science, biology...).[3] They were used to illustrate some aspect of the lesson (map of invasions, timelines, internal organs, etc.), and they were drawn or made by computer graphics.
Origin edit
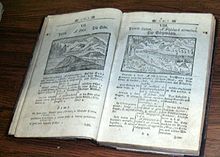
The term "edugraphic" is born from its cousin "infographic" which is relatively recent and the result of considerable debate in the design community. The Society for Technical Communication group describes infographics as "the translation of complex, unorganized or unstructured data into valuable, meaningful information".[4] Comenius used a visual education with the publication of Orbis Pictus in 1658.[5]
Infographics made significant developments thanks to the journalistic use old newspapers[6] nowadays infographics are now being used in several media and they serve to condense large amounts of information gathered from data banks that are nowadays easily found on the internet.
The First International Conference on Graphics Education was held in Alvor, Algarve, Portugal 1993 with the name Edugraphics.[7]
References edit
- ^ Histoire Géographie Education civique 2de Bac Pro - Livre élève consommable - Ed. 2013; De Michel Casta, Michel Corlin, Thierry Falconnet, Gilles Labadou, Alain Prost
- ^ Ariesta, I.; Adi, D. (March 2019). "Designing edugraphic using thinking map applied in the case of knowledge about Indonesian hero for elementary school as an effective media". Journal of Physics: Conference Series. 1175 (1): 012259. Bibcode:2019JPhCS1175a2259A. doi:10.1088/1742-6596/1175/1/012259. ISSN 1742-6596.
- ^ Durandeau Hachette, 13 Mai 1998
- ^ Kim Baer (2008), Information Design Workbook, Graphic Approaches, solutions and inspiration + 30 case studies. Rokport, p,12.
- ^ Epstein, Connie C. (1991). The Art of Writing for Children. Archon Books. p. 2. ISBN 0-208-02297-X.
- ^ Colmes N. (1984) Designer's Guide to Creating Charts and Diagrams, New York: Watson-Guptill
- ^ Santo, Harold P. (1993). Edugraphics '93 : First International Conference on Graphics Education. Lisbon: Association for Computing Machinery. OCLC 496721591.