


Summary
Nedlands is a Legislative Assembly electorate in the state of Western Australia. Nedlands is named for the inner western Perth suburb of Nedlands, which falls within its borders.
| Nedlands Western Australia—Legislative Assembly | |
|---|---|
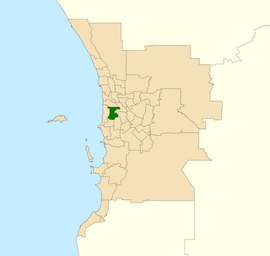 Location of Nedlands (dark green) in the Perth metropolitan area | |
| State | Western Australia |
| Dates current | 1930–present |
| MP | Katrina Stratton |
| Party | Labor |
| Namesake | Nedlands |
| Electors | 30,290 (2021) |
| Area | 31 km2 (12.0 sq mi) |
| Demographic | Metropolitan |
History edit
Nedlands was created at the 1929 redistribution, at which five new metropolitan electorates were created to replace former Goldfields seats in Parliament.[1] Its first member was elected at the 1930 election, and for most of its first eight decades it was a safe seat for the Liberal Party and its predecessors.[2] As such, it was held by a succession of senior non-Labor figures.
From 1953 to 2001, the seat was held by the Court family. Hon. Sir Charles Court won the seat in 1953, handing it to his son, Hon. Richard Court, in 1983. Charles served as Premier from 1974–1982, and Richard became Premier from and 1993–2001. They are one of only three father-son combinations in Australia to have served as state premiers (including the Butlers in South Australia and the Cains in Victoria).[3]
Its first member, Hon. Sir Norbert Keenan, was an Attorney-General, and all but one non-Labor member has been promoted to cabinet or the opposition front bench.
Recent history edit
At the 2001 state election, Labor won government on the second-largest swing against a sitting government in the state's history at the time. However, Labor was pushed into third place in Nedlands, though Court's own margin was cut to 4.93% by Independent candidate Liz Davenport, a prominent fashion designer and member of the Liberals for Forests party.[4] In the days after the election, Court was attempting to organise a succession whereby he and his deputy leader, Colin Barnett, the MLA for neighbouring Cottesloe, would both resign their seats. Federal Curtin MP Julie Bishop would resign her seat and hand it to Barnett, then run in the ensuing by-election to replace Court in Nedlands or Barnett in Cottesloe. Court would then hand the Liberal leadership to Bishop as soon as she was safely in the legislature. The aim was to prevent Barnett from succeeding Court.[5] However, the plan ended up on the front page of The West Australian, Bishop decided against a switch to State politics, and Court retired from politics shortly afterward.[6] At the resulting by-election in 2001, Sue Walker, a DPP lawyer, won the seat for the Liberals against the unrelated Steve Walker, a Greens candidate, who overtook the ALP on preferences.
Walker served in the Shadow Ministry in a variety of roles, most prominently as Shadow Attorney-General. When Matt Birney attempted to remove her from the Ministry in March 2006, he lost his own leadership in a party-room ballot to Paul Omodei, who immediately reinstated her.[7][8] Walker resigned from the Liberal party on 8 February 2008 after Troy Buswell attained the leadership, sitting as an independent thereafter. She contested the 2008 state election, claiming significant local support in doing so.[9][10] However, at the 2008 Western Australian election, Bill Marmion won the seat for the Liberal Party, defeating Walker by 10,266 to 9,280 on the two-candidate-preferred vote.
At the 2017 state election, Marmion suffered a two-party-preferred swing of almost 11 percent, dropping the Liberals' margin over Labor to 8.3 percent, the lowest since 1933.
The Labor Party won Nedlands for the first time at the landslide 2021 state election, with Katrina Stratton defeating Marmion on a swing almost as large as the one the Liberals suffered in 2017. Marmion lost over 16 percent of his primary vote from 2017, and Stratton defeated him after Green preferences flowed overwhelmingly to her.
Geography edit
Nedlands is bounded by the Swan River to the south and southeast, Thomas Street and Kings Park to the east, Loch Street and Brockway Road to the west, and Cambridge Street to the north. Its boundaries include the suburbs of Crawley, Daglish, Dalkeith, Jolimont, Nedlands, Shenton Park, Subiaco, West Leederville, along with parts of Floreat and Wembley.[11] Major features within the electorate include Subiaco Oval, Karrakatta Cemetery, Sir Charles Gairdner Hospital, University of Western Australia and Parliament House.
The 2007 redistribution, which took effect at the 2008 election, resulted in the seat losing most of Wembley and all of West Leederville while gaining part of Floreat and a non-residential section of Shenton Park north of the railway.[12]
Demographics edit
Nedlands and the neighbouring electorates of Churchlands to the north and Cottesloe to the west comprise the affluent western suburbs of Perth—the Australian Bureau of Statistics's SEIFA index (2001) ranked them as the highest three electorates by socio-economic status in Western Australia, with high scores on educational and employment opportunity. At the 2006 census, the median individual income in the Nedlands electorate, based on its 2005 boundaries, was $666 per week compared to $513 in the Perth metropolitan area, and the median weekly household income was $1,392 compared to $1,086 across Perth. 58.7% of the population were professionals or managers.[13]
All three seats are traditionally safe Liberal seats, and are located almost entirely within the blue-ribbon federal Liberal seat of Curtin.
Members for Nedlands edit
| Member | Party | Term | |
|---|---|---|---|
| Sir Norbert Keenan | Nationalist | 1930–1945 | |
| Liberal | 1945–1949 | ||
| Liberal Country League | 1949–1950 | ||
| David Grayden | Independent Liberal | 1950–1953 | |
| Sir Charles Court | Liberal Country League | 1953–1968 | |
| Liberal | 1968–1982 | ||
| Richard Court | Liberal | 1982–2001 | |
| Sue Walker | Liberal | 2001–2008 | |
| Independent | 2008 | ||
| Bill Marmion | Liberal | 2008–2021 | |
| Katrina Stratton | Labor | 2021–present | |
Results edit
| Party | Candidate | Votes | % | ±% | |
|---|---|---|---|---|---|
| Labor | Katrina Stratton | 9,327 | 35.7 | +9.1 | |
| Liberal | Bill Marmion | 9,160 | 35.0 | −16.6 | |
| Greens | Tamara Alderdice | 3,549 | 13.6 | −1.9 | |
| Independent | Fiona Argyle | 2,883 | 11.0 | +11.0 | |
| Independent | Andrew Mangano | 632 | 2.4 | +2.4 | |
| No Mandatory Vaccination | Vivien Forrest | 412 | 1.6 | +1.6 | |
| WAxit | Dennis Jennings | 179 | 0.7 | −0.7 | |
| Total formal votes | 26,142 | 97.6 | +0.8 | ||
| Informal votes | 648 | 2.4 | −0.8 | ||
| Turnout | 26,790 | 88.4 | +1.2 | ||
| Two-party-preferred result | |||||
| Labor | Katrina Stratton | 13,805 | 52.8 | +10.8 | |
| Liberal | Bill Marmion | 12,330 | 47.2 | −10.8 | |
| Labor gain from Liberal | Swing | +10.8 | |||
References edit
- ^ Government of Western Australia (1930). "Redistribution of Seats Act (No 1 of 1929)". Statutes of Western Australia, 1929–1930. pp. 1–56. Given assent on 15 April 1929.
- ^ Black, David; Prescott, Valerie (1997). Election statistics, Legislative Assembly of Western Australia, 1890–1996. Perth: Parliamentary History Project and Western Australian Electoral Commission. pp. 242–246. ISBN 0-7309-8409-5.
- ^ Green, Antony (5 April 2005). "Western Australia Election 2005: Nedlands". Australian Broadcasting Corporation (ABC). Retrieved 5 August 2008.
- ^ "2001 State General Election – District of Nedlands Results". Western Australian Electoral Commission. 12 March 2001. Archived from the original on 3 September 2008. Retrieved 10 February 2008.
- ^ Peter Kennedy (21 February 2001). "Schism forms after secret leadership deal". Lateline. Retrieved 10 February 2008.
- ^ David Weber (23 February 2001). "Court resigns as WA Liberal leader". PM. Retrieved 10 February 2008.
- ^ "Matt Birney's fight for the leadership". Stateline (ABC). 17 March 2006. Retrieved 5 August 2008.
- ^ "New leader Paul Omodei's vision for the Liberal Party". Stateline (ABC). 24 March 2006. Retrieved 5 August 2008.
- ^ "Walker announces she's quitting, via local paper". ABC News. 8 February 2008. Retrieved 8 February 2008.
- ^ Bret Christian (9 February 2008). "Walker walks". Post Newspapers. Archived from the original on 7 October 2009. Retrieved 10 February 2008.
- ^ Western Australian Electoral Commission (29 October 2007). "2007 Electoral Distribution – Final Boundaries – North Metropolitan – Nedlands". Retrieved 5 August 2008.
- ^ Western Australian Electoral Commission (4 August 2003). "2003 Electoral Distribution – Final Boundaries – North Metropolitan – Nedlands". Retrieved 5 August 2008.
- ^ Australian Bureau of Statistics (25 October 2007). "Community Profile Series: Nedlands (North Metropolitan) (State Electoral Division)". 2006 Census of Population and Housing. Retrieved 5 August 2008.
* Australian Bureau of Statistics (25 October 2007). "Community Profile Series: Perth (Statistical Division)". 2006 Census of Population and Housing. Retrieved 5 August 2008. - ^ 2021 State General Election – Nedlands District Results, WAEC
External links edit
- Green, Antony. "Electorate Profile". Australian Broadcasting Corporation.