


Summary
Electroretinography measures the electrical responses of various cell types in the retina, including the photoreceptors (rods and cones), inner retinal cells (bipolar and amacrine cells), and the ganglion cells. Electrodes are placed on the surface of the cornea (DTL silver/nylon fiber string or ERG jet) or on the skin beneath the eye (sensor strips) to measure retinal responses. Retinal pigment epithelium (RPE) responses are measured with an EOG test with skin-contact electrodes placed near the canthi. During a recording, the patient's eyes are exposed to standardized stimuli and the resulting signal is displayed showing the time course of the signal's amplitude (voltage). Signals are very small, and typically are measured in microvolts or nanovolts. The ERG is composed of electrical potentials contributed by different cell types within the retina, and the stimulus conditions (flash or pattern stimulus, whether a background light is present, and the colors of the stimulus and background) can elicit stronger response from certain components.[citation needed]
| Electroretinography | |
|---|---|
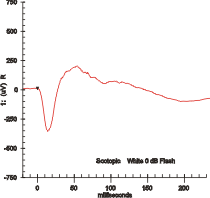 Maximal response ERG waveform from a dark adapted eye. | |
| ICD-9-CM | 95.21 |
| MeSH | D004596 |

If a dim flash ERG is performed on a dark-adapted eye, the response is primarily from the rod system. Flash ERGs performed on a light adapted eye will reflect the activity of the cone system. Sufficiently bright flashes will elicit ERGs containing an a-wave (initial negative deflection) followed by a b-wave (positive deflection). The leading edge of the a-wave is produced by the photoreceptors, while the remainder of the wave is produced by a mixture of cells including photoreceptors, bipolar, amacrine, and Müller cells or Müller glia.[1] The pattern ERG (PERG), evoked by an alternating checkerboard stimulus, primarily reflects activity of retinal ganglion cells.
Diagnostics edit


Clinically used mainly by ophthalmologists the electroretinogram (ERG) is used for the diagnosis of various retinal diseases.[2]
Inherited retinal degenerations in which the ERG can be useful include:[citation needed]
- Retinitis pigmentosa and related hereditary degenerations
- Retinitis punctata albescens
- Leber's congenital amaurosis
- Choroideremia
- Gyrate atrophy of the retina and choroid
- Goldman-Favre syndrome
- Congenital stationary night blindness - normal a-wave indicates normal photoreceptors; absent b-wave indicates abnormality in the bipolar cell region.
- X-linked juvenile retinoschisis
- Achromatopsia
- Cone dystrophy
- Disorders mimicking retinitis pigmentosa
- Usher syndrome
Other ocular disorders in which the standard ERG provides useful information include:
- Diabetic retinopathy[3][4][5]
- Other ischemic retinopathies including central retinal vein occlusion (CRVO),[6] branch vein occlusion (BVO), and sickle cell retinopathy
- Toxic retinopathies, including those caused by Plaquenil and Vigabatrin. The ERG is also used to monitor retinal toxicity in many drug trials.
- Autoimmune retinopathies such as cancer associated retinopathy (CAR), melanoma associated retinopathy (MAR), and acute zonal occult outer retinopathy (AZOOR)
- Retinal detachment
- Assessment of retinal function after trauma, especially in vitreous hemorrhage, dense cataracts, and other conditions where the fundus cannot be visualized.
The ERG is also used extensively in eye research, as it provides information about the function of the retina that is not otherwise available.
Other ERG tests, such as the photopic negative response (PhNR) and pattern ERG (PERG) may be useful in assessing retinal ganglion cell function in diseases like glaucoma.
The multifocal ERG is used to record separate responses for different retinal locations.
The international body concerned with the clinical use and standardization of the ERG, EOG, and VEP is the International Society for the Clinical Electrophysiology of Vision (ISCEV).[7]
Other uses edit
In addition to its clinical diagnostic purpose, the ERG can be used during the course of drug development and in clinical trials for testing ocular safety and efficacy of new or existing drugs and treatment modalities.[8]
A 2013 study[9] by Nasser et al. found that the retinal dopaminergic response to eating a brownie is equivalent in magnitude to the response to a 20 mg dose of methylphenidate, which implies that the activity of dopamine neurons in the retina reflects brain dopaminergic activity. The study concludes that, if verified by further research, "ERG could provide the neurotransmitter specificity of PET at a much lower cost".
The ERG has been shown to differ in people with schizophrenia[10] and may be useful in helping to differentiate schizophrenia and bipolar disorder.[11]
History edit
ERG was one of the earliest recorded biological potential. The first known ERG was recorded by the Swedish physiologist Alarik Frithiof Holmgren, who recorded it in 1865 on an amphibian retina.[12] However, he failed to understand his findings accurately. He thought the responses he recorded were from the optic nerve instead of the retina.[13] The first human ERG was recorded in 1877 by Scottish chemist and physicist Sir James Dewar.[12] James Dewar and John Gray McKendrick independently suggested that the biological potential was from retina.[13] In 1908, Einthoven and Jolly divided the ERG response into three components: A-wave, B-wave, and C-wave.[12] In 1941, American psychologist Lorraine Riggs introduced a contact lens electrode for ERG recording.[12] Many of Ragnar Granit's observations became the basis of ERG understanding, for which he was awarded the 1967 Nobel Prize in Physiology and Medicine.[12]
See also edit
References edit
- ^ Perlman, Ido. "The Electroretinogram: ERG by Ido Perlman". Webvision at University of Utah. Archived from the original on 2015-12-28.
- ^ Electroretinography, U.S. National Library of Medicine, 11 April 2005 (accessed 19 January 2007)
- ^ Maa; et al. (2015). "A novel device for accurate and efficient testing for vision-threatening diabetic retinopathy". Journal of Diabetes and Its Complications. 30 (3): 524–32. doi:10.1016/j.jdiacomp.2015.12.005. PMC 4853922. PMID 26803474.
- ^ Zeng, Yunkao; Cao, Dan; Yang, Dawei; Zhuang, Xuenan; Yu, Honghua; Hu, Yunyan; Zhang, Yan; Yang, Cheng; He, Miao; Zhang, Liang (2019-11-12). "Screening for diabetic retinopathy in diabetic patients with a mydriasis-free, full-field flicker electroretinogram recording device". Documenta Ophthalmologica. 140 (3): 211–220. doi:10.1007/s10633-019-09734-2. ISSN 1573-2622. PMID 31720980. S2CID 207934593.
- ^ Brigell, Mitchell G.; Chiang, Bryce; Maa, April Yauguang; Davis, C. Quentin (3 August 2020). "Enhancing Risk Assessment in Patients with Diabetic Retinopathy by Combining Measures of Retinal Function and Structure". Translational Vision Science & Technology. 9 (9): 40. doi:10.1167/tvst.9.9.40. PMC 7453041. PMID 32908803.
- ^ Miyata, Ryohei; Kondo, Mineo; Kato, Kumiko; Sugimoto, Masahiko; Matsubara, Hisashi; Ikesugi, Kengo; Ueno, Shinji; Yasuda, Shunsuke; Terasaki, Hiroko (2018-12-14). "Supernormal Flicker ERGs in Eyes With Central Retinal Vein Occlusion: Clinical Characteristics, Prognosis, and Effects of Anti-VEGF Agent". Investigative Ophthalmology & Visual Science. 59 (15): 5854–5861. doi:10.1167/iovs.18-25087. ISSN 1552-5783. PMID 30550616.
- ^ ISCEV Website
- ^ Brigell; et al. (2005). "An overview of drug development with special emphasis on the role of visual electrophysiological testing". Doc. Ophthalmol. 110 (1): 3–13. doi:10.1007/s10633-005-7338-9. PMID 16249953. S2CID 3154513.
- ^ Nasser, J.a.; Parigi, A. Del; Merhige, K.; Wolper, C.; Geliebter, A.; Hashim, S.a. (2013-05-01). "Electroretinographic detection of human brain dopamine response to oral food stimulation". Obesity. 21 (5): 976–980. doi:10.1002/oby.20101. ISSN 1930-739X. PMC 4964968. PMID 23784899.
- ^ Demmin, Docia L.; Davis, Quentin; Roché, Matthew; Silverstein, Steven M. (2018). "Electroretinographic anomalies in schizophrenia". Journal of Abnormal Psychology. 127 (4): 417–428. doi:10.1037/abn0000347. ISSN 1939-1846. PMID 29745706. S2CID 13663072.
- ^ Hébert, Marc; Mérette, Chantal; Gagné, Anne-Marie; Paccalet, Thomas; Moreau, Isabel; Lavoie, Joëlle; Maziade, Michel (2020-02-01). "The Electroretinogram May Differentiate Schizophrenia From Bipolar Disorder". Biological Psychiatry. 87 (3): 263–270. doi:10.1016/j.biopsych.2019.06.014. ISSN 0006-3223. PMID 31443935. S2CID 195699284.
- ^ a b c d e "Electroretinogram - EyeWiki". eyewiki.aao.org.
- ^ a b Dowling, John E. (1987). The Retina: An Approachable Part of the Brain. Harvard University Press. p. 164. ISBN 978-0-674-76680-8.