Summary
Energy use in Oman was 381 TWh in 2020, almost double the consumption in 2010.[1]

Economy edit
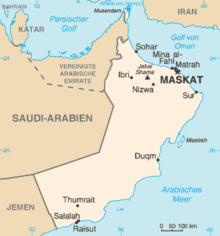
Oman is a country in the Middle East. Its current GDP per capita has expanded continuously over the past 50 years. It grew 339% in the 1960s and reached a peak growth of 1,370% in 1976.[citation needed]. Oman both imports and exports energy.
When Oman declined as an entrepot for arms and slaves in the mid-19th century, much of its former prosperity vanished; the economy turned almost exclusively to agriculture, camel and goat herding, fishing, and traditional handicrafts. Today, petroleum (oil) exports fuel the economy. Revenues from petroleum products have enabled Oman's dramatic development and modernization over the past 300 years.
Overview edit
| Energy in Oman[2][3][4][5][6][7][8][9] | ||||||
|---|---|---|---|---|---|---|
| Capita | Prim. energy | Production | Export | Ammunition | CO2-emission | |
| Million | TWh | TWh | TWh | TWh | Mt | |
| 2004 | 2.5310 | 138 | 676 | 549 | 9.72 | 25.261 |
| 2007 | 2.60 | 180 | 689 | 484 | 12.22 | 35.85 |
| 2008 | 2.79 | 191 | 738 | 497 | 13.63 | 34.92 |
| 2009 | 2.85 | 175 | 782 | 593 | 15.52 | 38.95 |
| 2010 | 2.78 | 233 | 839 | 617 | 16.51 | 40.27 |
| 2012 | 2.85 | 294 | 855 | 576 | 19.03 | 63.48 |
| 2012R | 3.31 | 306 | 881 | 589 | 21.61 | 67.63 |
| 2013 | 3.63 | 283 | 880 | 584 | 23.37 | 57.92 |
| Change 2004–10 | 9.9% | 69.1% | 24.2% | 12.4% | 69.9% | 59.4% |
| Mtoe = 11.63 TWh, Prim. energy includes energy losses
2012R = CO2 calculation criteria changed, numbers updated | ||||||
Oil edit
Oil was first discovered in 1964, near Fahud in the western desert. Petroleum Development Oman (PDO) began production in August 1967. The Omani Government owns 60% of PDO, and foreign interests own 40% (Royal Dutch Shell owns 34%; the remaining 6% is owned by Total and Partex). In 1976, Oman's oil production rose to 366,000 barrels (58,000 m³) per day but declined to about 285,000 barrels (45,000 m³) per day in the late 1980s due to the depletion of recoverable reserves. From 1981 to 1986, Oman compensated for declining oil prices by increasing production levels to 600,000 b/d; however, when oil prices collapsed in 1986, revenues dropped dramatically. Production was cut back temporarily in coordination with the Organization of Petroleum Exporting Countries (OPEC). Production levels again reached 600,000 b/d by mid-1987, which helped increase revenues. Oman's economic performance improved significantly in 1999 due largely to the mid-year upturn in oil prices. The government moved ahead with privatization of its utilities, and the development of the commercial law to encourage foreign investment. Oman liberalized its markets in an effort to join the World Trade Organization (WTO) and was accepted in 2000. By the mid-2000s, production had climbed to more than 900,000 b/d and where they remain. Oman is not a member of OPEC.
- Yibal is the largest oilfield in Oman, and is operated primarily by Royal Dutch Shell.
- Since production started in 1968, Oman's maximum production has been 250,000 barrels a day. As of 2005, production declined to 88,000 barrels a day.
In November 2017, Oman Oilfield received steam generated from 1,021 MW Solar Plant.[10]
Gas edit
Oman LNG is an LNG plant in operation since September 2000. It is supplied with gas in central Oman from Saih Rowl, the gas field is operated by Petroleum Development Oman (PDO).
Hydrogen edit
Since oil and gas account for 60% of Oman's energy exports, the nation has begun to diversify its energy use using renewable hydrogen produced by electrolysis of desalinated seawater. In 2022, the government formed Hydrogen Oman (HYDROM) as an autonomous body to lead and administer its hydrogen policy. 1,500 square km of land have been set aside for development thus far.[11]
See also edit
References edit
- ^ Ritchie, Hannah; Roser, Max; Rosado, Pablo (28 November 2020). "Energy". Our World in Data.
- ^ IEA Key World Energy Statistics Statistics 2015 Archived 2016-03-04 at the Wayback Machine
- ^ 2014 (2012R as in November 2015 Archived 2015-04-05 at the Wayback Machine + 2012 as in March 2014 is comparable to previous years statistical calculation criteria,
- ^ "2013" (PDF). Archived from the original (PDF) on 2014-09-02. Retrieved 2015-12-11.
- ^ "2012" (PDF). Archived from the original (PDF) on 2013-03-09. Retrieved 2012-11-29.
- ^ IEA Key energy statistics 2011 Archived 2011-10-27 at the Wayback Machine Page: Country specific indicator numbers from page 48
- ^ IEA Key energy statistics 2010 Archived 2010-10-11 at the Wayback Machine Page: Country specific indicator numbers from page 48
- ^ "2009" (PDF). Archived from the original (PDF) on 2013-10-07. Retrieved 2011-10-11.
- ^ 2006 Archived 2009-10-12 at the Wayback Machine IEA October, crude oil p.11, coal p. 13 gas p. 15
- ^ "Oman Oilfield to Receive Steam Generated from 1,021 MW Solar Plant". 2017-11-13. Retrieved 2017-11-21.
- ^ "Oman's huge renewable hydrogen potential can bring multiple benefits in its journey to net zero emissions - News". IEA. Retrieved 2023-10-20.


