


Summary
Enfield North is a peripheral Greater London constituency[n 1] created in 1974 and represented in the House of Commons of the UK Parliament since 2019 by Feryal Clark of the Labour Party.
| Enfield North | |
|---|---|
| Borough constituency for the House of Commons | |
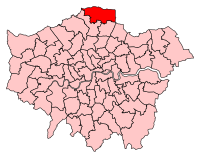 Boundary of Enfield North in Greater London | |
| County | Greater London 51°40′01″N 0°04′30″W / 51.667°N 0.075°W |
| Electorate | 66,761 (December 2010)[1] |
| Current constituency | |
| Created | 1974 |
| Member of Parliament | Feryal Clark (Labour) |
| Seats | One |
| Created from | Enfield East and Enfield West |
Constituency profile edit
The northernmost seat in Greater London, Enfield North is deeply suburban, almost village-like in parts, particularly its rolling terrain, including Gordon Hill and Carterhatch. Green belt legislation has kept housing development at bay, and the area has much in common with the adjoining county of Hertfordshire. The tree-lined avenues of Enfield Chase are also quiet and affluent.[2] However, much of the eastern part of the constituency is in the Lea Valley industrial area, and includes some small areas with significant levels of multiple deprivation.[3]
History edit
The seat was created for the February 1974 election from the former seats of Enfield West and Enfield East. The former was a safe Conservative seat, at one point represented by Iain Macleod, whereas the latter was a secure Labour seat.
From its creation up until 2015, Enfield North was somewhat a bellwether of the national result; it elected Labour MPs at both the 1974 elections, was taken by the Conservatives and held by comfortable margins in every election from 1979 to 1992, before being won back by Labour in 1997 (albeit with relatively narrow majorities throughout the party's time in government) and narrowly going to the Conservatives in 2010 in an election which nationally saw a hung Parliament. In 2015, however, the Conservatives lost the seat to Labour in an election which nationally saw them win an overall majority.
Boundary alterations based on an increased population within the existing area made the seat notionally Conservative before the 6 May 2010 election, and Nick de Bois won the seat. However, the former Labour MP Joan Ryan, who sat for the constituency from 1997 to 2010, regained it in 2015. The 2015 result gave the seat the 13th most marginal majority of Labour's 232 seats by percentage of majority.[4] De Bois and Ryan stood against each other in this seat over five general elections, between 2001 and 2017, with Ryan winning four of those five.
Boundaries edit

1974–1983: The London Borough of Enfield wards of Bullsmoor, Bush Hill, Cambridge Road, Chase, Enfield Wash, Green Street, Ordnance, Ponders End, Town, and Willow.
1983–2010: The London Borough of Enfield wards of Bullsmoor, Chase, Enfield Lock, Enfield Wash, Green Street, Hoe Lane, Ponders End, Southbury, Town, Willow, and Worcesters.
2010–present: The London Borough of Enfield wards of Chase, Enfield Highway, Enfield Lock, Highlands, Southbury, Town, and Turkey Street.
The constituency is set in the northern third of the London Borough of Enfield, stretching from Enfield Chase in the west, and the King George V Reservoir in the east, incorporating Brimsdown, Enfield Lock, and the M25 motorway interchange at the boundary with the borough of Broxbourne to the north.
2010 Boundary review edit
Following its review of parliamentary representation in North London, the Boundary Commission for England made boundary changes to Enfield North for the 2010 general election. Part of Highlands ward was transferred to Enfield North from the constituency of Enfield, Southgate. Part of Grange ward was transferred to Enfield, Southgate. Ponders End ward was transferred to Edmonton, and part of Southbury ward was transferred from Edmonton to Enfield North.
2023 boundary review edit

Under the 2023 Periodic Review of Westminster constituencies, enacted by the Parliamentary Constituencies Order 2023, the boundaries of the constituency from the next general election, due by January 2025, will be composed of the following London Borough of Enfield wards: Brimsdown; Bullsmoor; Carterhatch; Enfield Lock; Ponders End; Ridgeway; Southbury; Town; Whitewebbs.[5]
The contents reflect the local government boundary review for Enfield which came into effect in May 2022. In order to bring the electorate within the permitted electoral range, the Ponders End ward will be transferred back from Edmonton.
Members of Parliament edit
| Election | Member[6] | Party | |
|---|---|---|---|
| Feb 1974 | Bryan Davies | Labour | |
| 1979 | Tim Eggar | Conservative | |
| 1997 | Joan Ryan | Labour | |
| 2010 | Nick de Bois | Conservative | |
| 2015 | Joan Ryan | Labour | |
| February 2019 | The Independent Group for Change | ||
| 2019 | Feryal Clark | Labour | |
Election results edit
Elections in the 2020s edit
| Party | Candidate | Votes | % | ±% | |
|---|---|---|---|---|---|
| Labour | Feryal Clark[7] | ||||
| Reform UK | Stephen Bird[8] | ||||
Elections in the 2010s edit
| Party | Candidate | Votes | % | ±% | |
|---|---|---|---|---|---|
| Labour | Feryal Clark | 23,340 | 51.8 | -6.2 | |
| Conservative | Joanne Laban | 16,848 | 37.4 | +0.5 | |
| Liberal Democrats | Guy Russo | 2,950 | 6.5 | +4.4 | |
| Green | Isobel Whittaker | 1,115 | 2.5 | +1.3 | |
| Brexit Party | Ike Ijeh | 797 | 1.8 | New | |
| Majority | 6,492 | 14.4 | -6.7 | ||
| Turnout | 45,050 | 66.2 | -5.1 | ||
| Registered electors | 68,066 | ||||
| Labour hold | Swing | -3.3 | |||
| Party | Candidate | Votes | % | ±% | |
|---|---|---|---|---|---|
| Labour | Joan Ryan | 28,177 | 58.0 | +14.3 | |
| Conservative | Nick de Bois | 17,930 | 36.9 | -4.5 | |
| Liberal Democrats | Nicholas da Costa | 1,036 | 2.1 | -0.2 | |
| UKIP | Deborah Cairns | 848 | 1.7 | -7.3 | |
| Green | Bill Linton | 574 | 1.2 | -1.6 | |
| Majority | 10,247 | 21.1 | +18.7 | ||
| Turnout | 48,565 | 71.3 | +3.6 | ||
| Registered electors | 68,076 | ||||
| Labour hold | Swing | +9.4 | |||
| Party | Candidate | Votes | % | ±% | |
|---|---|---|---|---|---|
| Labour | Joan Ryan[15] | 20,172 | 43.7 | +5.2 | |
| Conservative | Nick de Bois | 19,086 | 41.4 | −0.9 | |
| UKIP | Deborah Cairns | 4,133 | 9.0 | +6.9 | |
| Green | David Flint[16] | 1,303 | 2.8 | +1.7 | |
| Liberal Democrats | Cara Jenkinson | 1,059 | 2.3 | −9.9 | |
| CPA | Yemi Awolola[17] | 207 | 0.4 | New | |
| TUSC | Joe Simpson[18] | 177 | 0.4 | New | |
| Majority | 1,086 | 2.3 | N/A | ||
| Turnout | 46,137 | 67.7 | +0.6 | ||
| Registered electors | 68,118 | ||||
| Labour gain from Conservative | Swing | +3.1 | |||
| Party | Candidate | Votes | % | ±% | |
|---|---|---|---|---|---|
| Conservative | Nick de Bois | 18,804 | 42.3 | -0.8 | |
| Labour | Joan Ryan | 17,112 | 38.5 | -2.3 | |
| Liberal Democrats | Paul Smith | 5,403 | 12.2 | +0.7 | |
| BNP | Tony Avery | 1,228 | 2.8 | +0.2 | |
| UKIP | Madge Jones | 938 | 2.1 | +0.3 | |
| Green | Bill Linton | 489 | 1.1 | New | |
| Christian | Anthony Williams | 161 | 0.4 | New | |
| English Democrat | Raquel Weald | 131 | 0.3 | New | |
| Workers Revolutionary | Anna Athow | 96 | 0.2 | New | |
| Independent | Gonul Daniels | 91 | 0.2 | New | |
| Majority | 1,692 | 3.8 | N/A | ||
| Turnout | 44,453 | 67.1 | +6.8 | ||
| Registered electors | 66,261 | ||||
| Conservative hold | Swing | +0.7[a] | |||
Elections in the 2000s edit
| Party | Candidate | Votes | % | ±% | |
|---|---|---|---|---|---|
| Labour | Joan Ryan | 18,055 | 44.3 | −2.4 | |
| Conservative | Nick de Bois | 16,135 | 39.6 | −1.1 | |
| Liberal Democrats | Simon Radford | 4,642 | 11.4 | +2.6 | |
| BNP | Terence Farr | 1,004 | 2.5 | +0.9 | |
| UKIP | Gary Robbens | 750 | 1.8 | +0.7 | |
| Independent | Patrick Burns | 163 | 0.4 | New | |
| Majority | 1,920 | 4.7 | -1.3 | ||
| Turnout | 40,749 | 61.3 | +4.3 | ||
| Registered electors | 63,720 | ||||
| Labour hold | Swing | −0.6 | |||
| Party | Candidate | Votes | % | ±% | |
|---|---|---|---|---|---|
| Labour | Joan Ryan | 17,888 | 46.7 | −4.0 | |
| Conservative | Nick de Bois | 15,597 | 40.7 | +4.3 | |
| Liberal Democrats | Hilary Leighter | 3,355 | 8.8 | −0.2 | |
| BNP | Ray Johns | 605 | 1.6 | +0.4 | |
| UKIP | Brian Hall | 427 | 1.1 | +0.1 | |
| ProLife Alliance | Michael Akerman | 241 | 0.6 | New | |
| Independent | Richard Course | 210 | 0.5 | New | |
| Majority | 2,291 | 6.0 | -8.3 | ||
| Turnout | 38,323 | 57.0 | −13.3 | ||
| Registered electors | 67,204 | ||||
| Labour hold | Swing | -4.2 | |||
Elections in the 1990s edit
| Party | Candidate | Votes | % | ±% | |
|---|---|---|---|---|---|
| Labour | Joan Ryan | 24,138 | 50.7 | +15.7 | |
| Conservative | Mark Field | 17,326 | 36.4 | -16.5 | |
| Liberal Democrats | Mike Hopkins | 4,264 | 9.0 | -2.1 | |
| Referendum | Robert Ellingham | 857 | 1.8 | New | |
| BNP | Jean Griffin | 590 | 1.2 | New | |
| UKIP | Jose O'Ware | 484 | 1.0 | New | |
| Majority | 6,812 | 14.3 | N/A | ||
| Turnout | 47,659 | 70.4 | -7.5 | ||
| Registered electors | 67,748 | ||||
| Labour gain from Conservative | Swing | -16.1 | |||
| Party | Candidate | Votes | % | ±% | |
|---|---|---|---|---|---|
| Conservative | Tim Eggar | 27,789 | 52.9 | -2.6 | |
| Labour | Martin Upham | 18,359 | 35.0 | +6.5 | |
| Liberal Democrats | Sarah Tustin | 5,817 | 11.1 | -3.7 | |
| Natural Law | John Markham | 565 | 1.1 | New | |
| Majority | 9,430 | 17.9 | -5.1 | ||
| Turnout | 52,530 | 77.9 | +3.4 | ||
| Registered electors | 67,421 | ||||
| Conservative hold | Swing | ||||
Elections in the 1980s edit
| Party | Candidate | Votes | % | ±% | |
|---|---|---|---|---|---|
| Conservative | Tim Eggar | 28,758 | 55.5 | +3.8 | |
| Labour | Martin Upham | 14,743 | 28.5 | +0.6 | |
| Alliance | Hilary Leighter | 7,633 | 14.7 | -4.4 | |
| Green | Eric Chantler | 644 | 1.2 | +0.6 | |
| Majority | 14,015 | 27.1 | +3.3 | ||
| Turnout | 51,778 | 74.5 | +2.1 | ||
| Registered electors | 69,488 | ||||
| Conservative hold | Swing | ||||
| Party | Candidate | Votes | % | ±% | |
|---|---|---|---|---|---|
| Conservative | Tim Eggar | 25,456 | 51.7 | +3.6 | |
| Labour | Brian Grayson | 13,740 | 27.9 | -13.4 | |
| Alliance | James Daly | 9,452 | 19.2 | +10.2 | |
| Ecology | T Persighetti | 320 | 0.7 | New | |
| BNP | J Billingham | 268 | 0.5 | New | |
| Majority | 11,716 | 23.8 | +17.1 | ||
| Turnout | 49,236 | 72.4 | -5.6 | ||
| Registered electors | 67,980 | ||||
| Conservative hold | Swing | ||||
Elections in the 1970s edit
| Party | Candidate | Votes | % | ±% | |
|---|---|---|---|---|---|
| Conservative | Tim Eggar | 24,927 | 48.06 | +14.42 | |
| Labour | Bryan Davies | 21,444 | 41.34 | -2.32 | |
| Liberal | Keith Crawford[32] | 4,681 | 9.02 | -10.9 | |
| National Front | Jeremy Wotherspoon | 816 | 1.57 | -1.21 | |
| Majority | 3,483 | 6.72 | N/A | ||
| Turnout | 51,866 | 78.08 | +7.58 | ||
| Registered electors | 66,427 | ||||
| Conservative gain from Labour | Swing | +8.37 | |||
| Party | Candidate | Votes | % | ±% | |
|---|---|---|---|---|---|
| Labour | Bryan Davies | 20,880 | 43.66 | +4.66 | |
| Conservative | C de H Parkinson | 16,087 | 33.64 | +1.04 | |
| Liberal | S Curtis | 9,526 | 19.92 | -15.88 | |
| National Front | R Burton | 1,330 | 2.78 | +0.18 | |
| Majority | 4,793 | 10.02 | +3.62 | ||
| Turnout | 47,825 | 70.50 | -8.30 | ||
| Registered electors | 67,818 | ||||
| Labour hold | Swing | ||||
| Party | Candidate | Votes | % | ±% | |
|---|---|---|---|---|---|
| Labour | Bryan Davies | 20,690 | 39.0 | ||
| Conservative | C de H Parkinson | 17,274 | 32.6 | ||
| Liberal | S. Curtis | 13,682 | 25.8 | ||
| National Front | K.T. Robinson | 1,372 | 2.6 | ||
| Majority | 3,416 | 6.4 | |||
| Turnout | 53,015 | 78.8 | |||
| Registered electors | 67,304 | ||||
| Labour win (new seat) | |||||
See also edit
Notes edit
- ^ A borough constituency (for the purposes of election expenses and type of returning officer)
References edit
- ^ "Electorate Figures - Boundary Commission for England". 2011 Electorate Figures. Boundary Commission for England. 4 March 2011. Archived from the original on 6 November 2010. Retrieved 13 March 2011.
- ^ "EN2 Area Guide - Property market & housing stock in EN2 | Mouseprice". Archived from the original on 26 April 2018. Retrieved 2 January 2013. Area Guide from Mouseprice]
- ^ "Intelligence Briefing - Indices of Deprivation 2010" (PDF). June 2011. Archived from the original (PDF) on 7 September 2012. Retrieved 6 February 2013.
- ^ "Labour Members of Parliament 2015". UK Political.info. Archived from the original on 29 September 2018.
- ^ "The Parliamentary Constituencies Order 2023". Schedule 1 Part 3 London region.
- ^ Leigh Rayment's Historical List of MPs – Constituencies beginning with "E" (part 2)
- ^ Feryal Clark [@FeryalClark] (6 April 2022). "Thank you to all the members and affiliates who voted to re-select me as your Labour candidate for Enfield North. It has been an incredible honour to serve our community, and I look forward to working with all of you to ensure Enfield North stays Labour" (Tweet) – via Twitter.
- ^ "Find My PPC" (PDF). Reform UK. Retrieved 9 January 2024.
- ^ "Statement of Persons Nominated, Notice of Poll and Situation of Polling Stations - Enfield North" (PDF). Archived from the original (PDF) on 14 November 2019. Retrieved 14 November 2019.
- ^ "Enfield North parliamentary constituency - Election 2019" – via www.bbc.co.uk.
- ^ "Enfield North parliamentary constituency". BBC News. Archived from the original on 6 June 2017.
- ^ "House Of Commons Library 2017 Election report" (PDF). Archived (PDF) from the original on 25 February 2018.
- ^ "Election Data 2015". Electoral Calculus. Archived from the original on 17 October 2015. Retrieved 17 October 2015.
- ^ "Declarations of Results - Notices of Election 2015 - Downloads - Enfield Council". Archived from the original on 5 March 2016. Retrieved 5 March 2016.
- ^ "ENFIELD NORTH 2015". electionresults.blogspot.co.uk. Archived from the original on 17 February 2016. Retrieved 26 April 2018.
- ^ "Enfield Green Party - Home". www.enfieldgreens.org.uk. Archived from the original on 6 April 2017. Retrieved 26 April 2018.
- ^ "CPA Candidates for the General Election". Christian Peoples Alliance. Archived from the original on 7 February 2015. Retrieved 1 March 2015.
- ^ "TUSC reaches Welsh broadcast threshold - now for England and Scotland". 24 February 2015. Archived from the original on 2 April 2015. Retrieved 1 March 2015.
- ^ "Election Data 2010". Electoral Calculus. Archived from the original on 26 July 2013. Retrieved 17 October 2015.
- ^ "Election Results 2010 - Enfield North". Retrieved 24 February 2023.
- ^ "Election Data 2005". Electoral Calculus. Archived from the original on 15 October 2011. Retrieved 18 October 2015.
- ^ "Election Data 2001". Electoral Calculus. Archived from the original on 15 October 2011. Retrieved 18 October 2015.
- ^ "Election Data 1997". Electoral Calculus. Archived from the original on 15 October 2011. Retrieved 18 October 2015.
- ^ "Enfield North [Archive]". www.politicsresources.net. Archived from the original on 21 September 2016. Retrieved 26 April 2018.
- ^ "Election Data 1992". Electoral Calculus. Archived from the original on 15 October 2011. Retrieved 18 October 2015.
- ^ "UK General Election results: April 1992 [Archive]". www.politicsresources.net. Archived from the original on 3 June 2016. Retrieved 26 April 2018.
- ^ "Election Data 1987". Electoral Calculus. Archived from the original on 15 October 2011. Retrieved 18 October 2015.
- ^ "UK General Election results: June 1987 [Archive]". www.politicsresources.net. Archived from the original on 3 June 2016. Retrieved 26 April 2018.
- ^ "Election Data 1983". Electoral Calculus. Archived from the original on 15 October 2011. Retrieved 18 October 2015.
- ^ "UK General Election results: June 1983 [Archive]". www.politicsresources.net. Archived from the original on 28 June 2017. Retrieved 26 April 2018.
- ^ "UK General Election results: May 1979 [Archive]". www.politicsresources.net. Archived from the original on 28 June 2017. Retrieved 26 April 2018.
- ^ Election Expenses. Parliament of the United Kingdom. 1980. p. 12. ISBN 0102374805.
- ^ "UK General Election results: October 1974 [Archive]". www.politicsresources.net. Archived from the original on 28 August 2016. Retrieved 26 April 2018.
- ^ "UK General Election results: February 1974 [Archive]". www.politicsresources.net. Archived from the original on 1 July 2017. Retrieved 26 April 2018.
External links edit
- Politics Resources (Election results from 1922 onwards)
- Electoral Calculus (Election results from 1955 onwards)