


Summary
Statistics in the European Union are collected by Eurostat (European statistics body).
Area and population edit
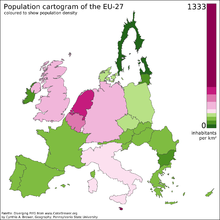
As of 1 January 2006, the population of the EU was about 493 million people, although in 2020 the EU lost over 10% of its population as a result of the UK leaving the bloc.[1] Many countries are expected to experience a decline in population over the coming decades,[2] though this could be offset with new countries planning to join the EU within the next 20 years. The most populous member state is Germany, with an estimated 80.4 million people. France and Ireland have the highest birth-rates.[3] The most densely populated country is the island of Malta, which is also the smallest, while the largest in area is France. The least densely populated country is Finland.
The table below uses data from Eurostat.[4][5]
| Member State | Population | % pop. |
Area km2 |
% area |
Density /km2 |
|---|---|---|---|---|---|
| 448,387,872 | 100% | 4,225,134 | 100% | 106 | |
| 9,104,772 | 2.0% | 83,878 | 2.0% | 109 | |
| 11,754,004 | 2.6% | 30,667 | 0.7% | 383 | |
| 6,447,710 | 1.4% | 110,996 | 2.6% | 58 | |
| 3,850,894 | 0.9% | 56,594 | 1.3% | 68 | |
| 920,701 | 0.2% | 9,253 | 0.2% | 100 | |
| 10,827,529 | 2.4% | 78,871 | 1.9% | 137 | |
| 5,932,654 | 1.3% | 42,925 | 1.0% | 138 | |
| 1,365,884 | 0.3% | 45,336 | 1.1% | 30 | |
| 5,563,970 | 1.2% | 338,411 | 8.0% | 16 | |
| 68,070,697 | 15.2% | 638,475 | 15.1% | 107 | |
| 84,358,845 | 18.8% | 357,569 | 8.5% | 236 | |
| 10,394,055 | 2.3% | 131,694 | 3.1% | 79 | |
| 9,597,085 | 2.1% | 93,012 | 2.2% | 103 | |
| 5,194,336 | 1.2% | 69,947 | 1.7% | 74 | |
| 58,850,717 | 13.1% | 302,079 | 7.1% | 195 | |
| 1,883,008 | 0.4% | 64,586 | 1.5% | 29 | |
| 2,857,279 | 0.6% | 65,284 | 1.5% | 44 | |
| 672,050 | 0.1% | 2,586 | 0.1% | 260 | |
| 542,051 | 0.1% | 316 | 0.01% | 1715 | |
| 17,811,291 | 4.0% | 37,378 | 0.9% | 477 | |
| 36,753,736 | 8.2% | 311,928 | 7.4% | 118 | |
| 10,467,366 | 2.3% | 92,227 | 2.2% | 113 | |
| 19,051,562 | 4.2% | 238,398 | 5.6% | 80 | |
| 5,428,792 | 1.2% | 49,035 | 1.2% | 111 | |
| 2,116,792 | 0.5% | 20,273 | 0.5% | 104 | |
| 48,059,777 | 10.7% | 505,983 | 12.0% | 95 | |
| 10,521,556 | 2.3% | 447,424 | 10.6% | 24 |
Economy edit
For statistics relating to economy, please see Economy of the European Union.
EU budget edit
The primary resource for funding the European Union is the contributions sought from member states. Each member state contributes to the EU budget, and receives funding back from the EU, depending on the relative wealth of the states, i.e. their ability to pay.
The table below shows the contributions as a percentage of the total budget. This takes into account the special considerations given to the United Kingdom to reduce its contribution through a rebate. Expenditure in Luxembourg, Belgium and France include items for the EU administrative centres in each of those countries.
Figures below are in Euros, where applicable. Data are for the year 2006.[citation needed]
| Member State | Total contribution | % total |
Total expenditure | % total |
Net contrib. | Net contrib. per capita |
Total contrib. per capita |
|---|---|---|---|---|---|---|---|
| 105,259,468,772 | 100.00% | 106,575,500,000 | 100.00% | -1,316,031,228 | -3 | 213 | |
| 22,218,438,941 | 21.11% | 12,242,400,000 | 11.49% | 9,976,038,941 | 124 | 276 | |
| 17,303,107,859 | 16.44% | 13,496,200,000 | 12.66% | 3,806,907,859 | 59 | 266 | |
| 14,359,479,157 | 13.64% | 10,922,300,000 | 10.25% | 3,437,179,157 | 58 | 244 | |
| 13,739,900,046 | 13.05% | 8,294,200,000 | 7.78% | 5,445,700,046 | 90 | 226 | |
| 8,957,286,488 | 8.51% | 12,883,000,000 | 12.09% | -3,925,713,512 | -88 | 200 | |
| 5,552,933,781 | 5.28% | 2,190,400,000 | 2.06% | 3,362,533,781 | 198 | 327 | |
| 4,035,286,807 | 3.83% | 5,625,100,000 | 5.28% | -1,589,813,193 | -151 | 384 | |
| 2,832,862,800 | 2.69% | 1,573,400,000 | 1.48% | 1,259,462,800 | 126 | 283 | |
| 2,308,432,030 | 2.19% | 1,830,100,000 | 1.72% | 478,332,030 | 58 | 278 | |
| 2,130,860,212 | 2.02% | 1,501,900,000 | 1.41% | 628,960,212 | 116 | 395 | |
| 2,099,087,114 | 1.99% | 5,305,600,000 | 4.98% | -3,206,512,886 | -84 | 55 | |
| 1,882,611,879 | 1.79% | 6,833,700,000 | 6.41% | -4,951,088,121 | -446 | 170 | |
| 1,544,832,284 | 1.47% | 1,280,400,000 | 1.20% | 264,432,284 | 50 | 291 | |
| 1,443,049,602 | 1.37% | 3,634,800,000 | 3.41% | -2,191,750,398 | -207 | 136 | |
| 1,341,281,313 | 1.27% | 2,461,800,000 | 2.31% | -1,120,518,687 | -244 | 292 | |
| 1,003,119,411 | 0.95% | 1,842,200,000 | 1.73% | -839,080,589 | -83 | 99 | |
| 932,392,859 | 0.89% | 1,330,000,000 | 1.25% | -397,607,141 | -39 | 91 | |
| 393,148,777 | 0.37% | 696,200,000 | 0.65% | -303,051,223 | -56 | 73 | |
| 299,993,572 | 0.29% | 406,000,000 | 0.38% | -106,006,428 | -53 | 150 | |
| 241,439,011 | 0.23% | 1,194,800,000 | 1.12% | -953,360,989 | -1,907 | 483 | |
| 221,997,405 | 0.21% | 799,800,000 | 0.75% | -577,802,595 | -170 | 65 | |
| 144,556,416 | 0.14% | 239,600,000 | 0.22% | -95,043,584 | -119 | 181 | |
| 115,205,431 | 0.11% | 402,600,000 | 0.24% | -287,394,569 | -125 | 50 | |
| 100,756,308 | 0.10% | 300,000,000 | 0.28% | -199,243,692 | -142 | 72 | |
| 57,409,269 | 0.05% | 157,000,000 | 0.14% | -99,590,731 | -249 | 144 | |
| 360,600,000 | 0.34% | -360,600,000 | -47 | ||||
| 693,100,000 | 0.65% | -693,100,000 | -32 |
edit
There are many indices available on issues such as corruption, development, and freedom. The rankings below include all EU member states, EU candidates (with the exception of Turkey, cause their accession negotiations have stalled since 2016) and EFTA countries.
Freedom of the press edit
|
|
Reporters sans frontières (Reporters Without Borders) conducts an annual survey on the freedom of the press and produces scores (not shown here) for each country, resulting in the Press Freedom Index. In 2019 and 2020, Finland was proclaimed as having the freest press in the European Union, and the second in the world behind Norway. Bulgaria was ranked as having the least free press in the European Union in 2019 and 2020.[6]
| Colour Codes |
|---|
| Good Situation |
| Satisfactory Situation |
| Noticeable problems |
| Difficult situation |
Economic freedom edit
|
|
The Index of Economic Freedom, published by The Wall Street Journal and The Heritage Foundation, uses 50 different variables to compile the survey, in areas such as trade policy and government intervention.[7]
A similar index produced by the World Economic Forum is its Global Competitiveness Index.
| Colour Codes |
|---|
| Free |
| Mostly Free |
| Moderately Free |
| Moderately Unfree |
Perception of corruption edit
|
|
Transparency International is an international NGO publishing an annual Global Corruption Report indicating the perception of corruption around the world. The rankings of the table refer to the Corruption Perceptions Index 2022 [1]. A high ranking means low corruption.
Human development edit
|
|
| Colour Codes |
|---|
| Very High Human Development |
| High Human Development |
The Human Development Index is a measure produced by the United Nations which covers three aspects of human development:
- poverty (GDP per capita)
- education (mean years of schooling and expected years of schooling)
- health (life expectancy)
The rankings of the table refer to the UNDP Human Development Report 2019 (2018 data). The UN lists all EU member states as countries with very high human development.
Democracy Index edit
|
|
The Democracy Index is an index compiled by the Economist Intelligence Unit (EIU), the research division of the Economist Group, a UK-based private company which publishes the weekly newspaper The Economist.
See also edit
- Enlargement of the European Union
- Largest cities of the European Union by population within city limits
- Hispanics and Latins in Europe
- List of European Union member states by population
- Largest urban areas of the European Union and Larger Urban Zones
- Organization for Security and Co-operation in Europe statistics
References edit
- ^ "Total Population as of 01.01.06 Archived 6 July 2007 at the Wayback Machine", EUROSTAT. Retrieved 12 November 2006.
- ^ "The EU's baby blues", BBC News, 27 March 2006. Retrieved 10 July 2006.
- ^ "France claims EU fertility crown ", BBC News, 16 January 2007. Retrieved 10 February 2007.
- ^ "EUROSTAT Population on 1 January". ec.europa.eu. Retrieved 16 December 2023.
- ^ "Area by NUTS 3 region". ec.europa.eu. Retrieved 16 December 2023.
- ^ World Press Freedom Index 2019 and World Press Freedom Index 2020, Reporters Without Borders
- ^ 2020 Index of Economic Freedom 2020 Index of Economic Freedom Archived 16 September 2017 at the Wayback Machine, The Heritage Foundation
External links edit
- Eurostat – Statistics Explained
- Health-EU Portal Health Statistics
- EU Budget Data[permanent dead link]