


Summary
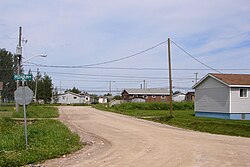
Factory Island 1 is a Cree First Nations reserve on Moose Factory Island in northern Ontario. It is one of two reserves for the Moose Cree First Nation.
Factory Island 1 | |
|---|---|
| Factory Island Indian Reserve No. 1 | |
 | |
 Factory Island 1 | |
| Coordinates: 51°16′09″N 80°35′35″W / 51.26917°N 80.59306°W[1] | |
| Country | Canada |
| Province | Ontario |
| District | Cochrane |
| First Nation | Moose Cree |
| Area | |
| • Land | 3.08 km2 (1.19 sq mi) |
| Population (2011)[2] | |
| • Total | 1,414 |
| • Density | 459.3/km2 (1,190/sq mi) |
| Website | www.moosecree.com |
Land use edit
The northern two-thirds of the island comprises this reserve or land north of Museum Street. Most residential, the reserve is home to a Northern Store, Cree Interpretative Centre and Treeline Diner. Key government services, including the hospital, are located in the southern part of the island under the Unorganized North Cochrane District.
Half of the reserve, namely the north end is tree covered land.
Transportation edit
Gravel roads are used for vehicles within town. There are no bridges, but an ice road is available during the winter season.
Climate edit
The reserve and the Moosonee area has a very cold humid continental climate (Köppen Dfb). The climate data is from Moosonee, around 3 km (1.9 mi) to the west.
| Climate data for Moosonee (Moosonee Upper Air (UA)) WMO ID: 71836; coordinates 51°16′N 80°39′W / 51.267°N 80.650°W; elevation: 10.0 m (32.8 ft); 1981–2010 normals, extremes 1877–present[a] | |||||||||||||
|---|---|---|---|---|---|---|---|---|---|---|---|---|---|
| Month | Jan | Feb | Mar | Apr | May | Jun | Jul | Aug | Sep | Oct | Nov | Dec | Year |
| Record high °C (°F) | 7.2 (45.0) |
10.6 (51.1) |
25.0 (77.0) |
29.0 (84.2) |
34.2 (93.6) |
37.5 (99.5) |
37.8 (100.0) |
35.0 (95.0) |
36.3 (97.3) |
29.7 (85.5) |
20.5 (68.9) |
13.2 (55.8) |
37.8 (100.0) |
| Mean daily maximum °C (°F) | −13.6 (7.5) |
−10.5 (13.1) |
−3.9 (25.0) |
4.3 (39.7) |
13.3 (55.9) |
19.1 (66.4) |
22.6 (72.7) |
21.1 (70.0) |
15.7 (60.3) |
7.9 (46.2) |
−0.5 (31.1) |
−9.3 (15.3) |
5.5 (41.9) |
| Daily mean °C (°F) | −20.0 (−4.0) |
−17.5 (0.5) |
−11.1 (12.0) |
−1.8 (28.8) |
6.8 (44.2) |
12.2 (54.0) |
15.8 (60.4) |
14.9 (58.8) |
10.5 (50.9) |
3.8 (38.8) |
−4.3 (24.3) |
−14.5 (5.9) |
−0.5 (31.1) |
| Mean daily minimum °C (°F) | −26.3 (−15.3) |
−24.6 (−12.3) |
−18.3 (−0.9) |
−7.9 (17.8) |
0.2 (32.4) |
5.3 (41.5) |
8.9 (48.0) |
8.6 (47.5) |
5.2 (41.4) |
−0.5 (31.1) |
−8.2 (17.2) |
−19.7 (−3.5) |
−6.4 (20.5) |
| Record low °C (°F) | −48.9 (−56.0) |
−47.8 (−54.0) |
−44.4 (−47.9) |
−33.9 (−29.0) |
−17.8 (0.0) |
−7.0 (19.4) |
−2.2 (28.0) |
−3.1 (26.4) |
−6.1 (21.0) |
−16.7 (1.9) |
−34.4 (−29.9) |
−44.4 (−47.9) |
−48.9 (−56.0) |
| Average precipitation mm (inches) | 33.0 (1.30) |
28.6 (1.13) |
35.3 (1.39) |
38.1 (1.50) |
54.6 (2.15) |
71.7 (2.82) |
96.8 (3.81) |
77.8 (3.06) |
95.3 (3.75) |
74.7 (2.94) |
56.3 (2.22) |
41.5 (1.63) |
703.6 (27.70) |
| Average rainfall mm (inches) | 0.1 (0.00) |
1.8 (0.07) |
6.5 (0.26) |
21.0 (0.83) |
47.7 (1.88) |
71.5 (2.81) |
96.8 (3.81) |
77.8 (3.06) |
94.6 (3.72) |
62.1 (2.44) |
19.1 (0.75) |
3.5 (0.14) |
502.6 (19.79) |
| Average snowfall cm (inches) | 39.9 (15.7) |
31.7 (12.5) |
31.0 (12.2) |
17.9 (7.0) |
6.6 (2.6) |
0.2 (0.1) |
0.0 (0.0) |
0.0 (0.0) |
0.6 (0.2) |
13.2 (5.2) |
40.6 (16.0) |
45.2 (17.8) |
226.8 (89.3) |
| Average precipitation days (≥ 0.2 mm) | 14.8 | 11.3 | 10.9 | 10.2 | 12.5 | 13.9 | 16.4 | 15.2 | 18.5 | 16.5 | 15.7 | 15.9 | 171.7 |
| Average rainy days (≥ 0.2 mm) | 0.23 | 0.95 | 2.2 | 5.1 | 10.8 | 13.8 | 16.4 | 15.2 | 18.5 | 13.4 | 4.8 | 1.1 | 102.3 |
| Average snowy days (≥ 0.2 cm) | 15.0 | 11.0 | 10.1 | 6.7 | 3.1 | 0.17 | 0.0 | 0.0 | 0.09 | 5.0 | 13.1 | 15.6 | 79.7 |
| Mean monthly sunshine hours | 93.6 | 128.7 | 161.6 | 192.0 | 221.2 | 213.5 | 249.2 | 219.7 | 134.8 | 88.5 | 52.9 | 55.2 | 1,810.7 |
| Percent possible sunshine | 35.8 | 45.7 | 44.0 | 46.3 | 45.9 | 43.1 | 50.0 | 48.6 | 35.4 | 26.6 | 19.7 | 22.3 | 38.6 |
| Source: Environment and Climate Change Canada[3][4][5][6][7][8][9][10] | |||||||||||||
Footnotes edit
- ^ Long term climate data for the Moosonee area was recorded in Moose Factory from October 1877 to December 1938, and in Moosonee from October 1932 to present.
References edit
- ^ "Factory Island 1". Geographical Names Data Base. Natural Resources Canada.
- ^ a b "Factory Island 1 census profile". 2011 Census of Population. Statistics Canada. 8 February 2012. Retrieved 27 May 2015.
- ^ "Moosonee UA". Canadian Climate Normals 1981–2010. Environment and Climate Change Canada. 14 July 2023. Retrieved 15 September 2023.
- ^ "Moose Factory". Canadian Climate Data. Environment and Climate Change Canada. 14 July 2023. Retrieved 15 September 2023.
- ^ "Daily Data Report for October 2011". Canadian Climate Data. Environment and Climate Change Canada. 14 July 2023. Retrieved 15 September 2023.
- ^ "Daily Data Report for March 2012". Canadian Climate Data. Environment and Climate Change Canada. 14 July 2023. Retrieved 15 September 2023.
- ^ "Daily Data Report for November 2020". Canadian Climate Data. Environment and Climate Change Canada. 18 September 2023. Retrieved 4 October 2023.
- ^ "Daily Data Report for September 2023". Canadian Climate Data. Environment and Climate Change Canada. 18 September 2023. Retrieved 4 October 2023.
- ^ "Daily Data Report for May 2018". Canadian Climate Data. Environment and Climate Change Canada. 18 September 2023. Retrieved 4 October 2023.
- ^ "Daily Data Report for October 2023". Canadian Climate Data. Environment and Climate Change Canada. 18 September 2023. Retrieved 9 October 2023.