


Summary
A fluorescence microscope is an optical microscope that uses fluorescence instead of, or in addition to, scattering, reflection, and attenuation or absorption, to study the properties of organic or inorganic substances.[1][2] "Fluorescence microscope" refers to any microscope that uses fluorescence to generate an image, whether it is a simple set up like an epifluorescence microscope or a more complicated design such as a confocal microscope, which uses optical sectioning to get better resolution of the fluorescence image.[3]

Principle edit
The specimen is illuminated with light of a specific wavelength (or wavelengths) which is absorbed by the fluorophores, causing them to emit light of longer wavelengths (i.e., of a different color than the absorbed light). The illumination light is separated from the much weaker emitted fluorescence through the use of a spectral emission filter. Typical components of a fluorescence microscope are a light source (xenon arc lamp or mercury-vapor lamp are common; more advanced forms are high-power LEDs and lasers), the excitation filter, the dichroic mirror (or dichroic beamsplitter), and the emission filter (see figure below). The filters and the dichroic beamsplitter are chosen to match the spectral excitation and emission characteristics of the fluorophore used to label the specimen.[1] In this manner, the distribution of a single fluorophore (color) is imaged at a time. Multi-color images of several types of fluorophores must be composed by combining several single-color images.[1]
Most fluorescence microscopes in use are epifluorescence microscopes, where excitation of the fluorophore and detection of the fluorescence are done through the same light path (i.e. through the objective). These microscopes are widely used in biology and are the basis for more advanced microscope designs, such as the confocal microscope and the total internal reflection fluorescence microscope (TIRF).
Epifluorescence microscopy edit
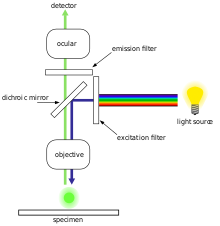
The majority of fluorescence microscopes, especially those used in the life sciences, are of the epifluorescence design shown in the diagram. Light of the excitation wavelength illuminates the specimen through the objective lens. The fluorescence emitted by the specimen is focused to the detector by the same objective that is used for the excitation which for greater resolution will need objective lens with higher numerical aperture. Since most of the excitation light is transmitted through the specimen, only reflected excitatory light reaches the objective together with the emitted light and the epifluorescence method therefore gives a high signal-to-noise ratio. The dichroic beamsplitter acts as a wavelength specific filter, transmitting fluoresced light through to the eyepiece or detector, but reflecting any remaining excitation light back towards the source.[citation needed]
Light sources edit
Fluorescence microscopy requires intense, near-monochromatic, illumination which some widespread light sources, like halogen lamps cannot provide.[4] Four main types of light source are used, including xenon arc lamps or mercury-vapor lamps with an excitation filter, lasers, supercontinuum sources, and high-power LEDs. Lasers are most widely used for more complex fluorescence microscopy techniques like confocal microscopy and total internal reflection fluorescence microscopy while xenon lamps, and mercury lamps, and LEDs with a dichroic excitation filter are commonly used for widefield epifluorescence microscopes. By placing two microlens arrays into the illumination path of a widefield epifluorescence microscope,[5] highly uniform illumination with a coefficient of variation of 1-2% can be achieved.
Sample preparation edit
Displays overlays from four fluorescent channels
(b) Cyan: [PLL-A546 fluorescence] - generic counterstain for visualising eukaryotic cell surfaces
(c) Blue: [Hoechst fluorescence] - stains DNA, identifies nuclei
(d) Red: [chlorophyll autofluorescence] - resolves chloroplasts [6]

In order for a sample to be suitable for fluorescence microscopy it must be fluorescent. There are several methods of creating a fluorescent sample; the main techniques are labelling with fluorescent stains or, in the case of biological samples, expression of a fluorescent protein. Alternatively the intrinsic fluorescence of a sample (i.e., autofluorescence) can be used.[1] In the life sciences fluorescence microscopy is a powerful tool which allows the specific and sensitive staining of a specimen in order to detect the distribution of proteins or other molecules of interest. As a result, there is a diverse range of techniques for fluorescent staining of biological samples.[citation needed]
Biological fluorescent stains edit
Many fluorescent stains have been designed for a range of biological molecules. Some of these are small molecules which are intrinsically fluorescent and bind a biological molecule of interest. Major examples of these are nucleic acid stains such as DAPI and Hoechst (excited by UV wavelength light) and DRAQ5 and DRAQ7 (optimally excited by red light) which all bind the minor groove of DNA, thus labeling the nuclei of cells. Others are drugs, toxins, or peptides which bind specific cellular structures and have been derivatised with a fluorescent reporter. A major example of this class of fluorescent stain is phalloidin, which is used to stain actin fibers in mammalian cells. A new peptide, known as the Collagen Hybridizing Peptide, can also be conjugated with fluorophores and used to stain denatured collagen fibers. Staining of the plant cell walls is performed using stains or dyes that bind cellulose or pectin. The quest for fluorescent probes with a high specificity that also allow live imaging of plant cells is ongoing.[7]
There are many fluorescent molecules called fluorophores or fluorochromes such as fluorescein, Alexa Fluors, or DyLight 488, which can be chemically linked to a different molecule which binds the target of interest within the sample.
Immunofluorescence edit
Immunofluorescence is a technique which uses the highly specific binding of an antibody to its antigen in order to label specific proteins or other molecules within the cell. A sample is treated with a primary antibody specific for the molecule of interest. A fluorophore can be directly conjugated to the primary antibody. Alternatively a secondary antibody, conjugated to a fluorophore, which binds specifically to the first antibody can be used. For example, a primary antibody raised in a mouse which recognises tubulin combined with a secondary anti-mouse antibody derivatised with a fluorophore could be used to label microtubules in a cell.[citation needed]
Fluorescent proteins edit
The modern understanding of genetics and the techniques available for modifying DNA allow scientists to genetically modify proteins to also carry a fluorescent protein reporter. In biological samples this allows a scientist to directly make a protein of interest fluorescent. The protein location can then be directly tracked, including in live cells.
Limitations edit
Fluorophores lose their ability to fluoresce as they are illuminated in a process called photobleaching. Photobleaching occurs as the fluorescent molecules accumulate chemical damage from the electrons excited during fluorescence. Photobleaching can severely limit the time over which a sample can be observed by fluorescence microscopy. Several techniques exist to reduce photobleaching such as the use of more robust fluorophores, by minimizing illumination, or by using photoprotective scavenger chemicals.[citation needed]
Fluorescence microscopy with fluorescent reporter proteins has enabled analysis of live cells by fluorescence microscopy, however cells are susceptible to phototoxicity, particularly with short wavelength light. Furthermore, fluorescent molecules have a tendency to generate reactive chemical species when under illumination which enhances the phototoxic effect.[citation needed]
Unlike transmitted and reflected light microscopy techniques, fluorescence microscopy only allows observation of the specific structures which have been labeled for fluorescence. For example, observing a tissue sample prepared with a fluorescent DNA stain by fluorescence microscopy only reveals the organization of the DNA within the cells and reveals nothing else about the cell morphologies.
Computational techniques that propose to estimate the fluorescent signal from non-fluorescent images (such as brightfield) may reduce these concerns.[8] In general, these approaches involve training a deep convolutional neural network on stained cells and then estimating the fluorescence on unstained samples. Thus by decoupling the cells under investigation from the cells used to train the network, imaging can performed quicker and with reduced phototoxicity.
Sub-diffraction techniques edit
The wave nature of light limits the size of the spot to which light can be focused due to the diffraction limit. This limitation was described in the 19th century by Ernst Abbe and "limits an optical microscope's resolution to approximately half of the wavelength of the light used." Fluorescence microscopy is central to many techniques which aim to reach past this limit by specialized optical configurations.[citation needed]
Several improvements in microscopy techniques have been invented in the 20th century and have resulted in increased resolution and contrast to some extent. However they did not overcome the diffraction limit. In 1978 first theoretical ideas have been developed to break this barrier by using a 4Pi microscope as a confocal laser scanning fluorescence microscope where the light is focused ideally from all sides to a common focus which is used to scan the object by 'point-by-point' excitation combined with 'point-by-point' detection.[9] However, the first experimental demonstration of the 4pi microscope took place in 1994.[10] 4Pi microscopy maximizes the amount of available focusing directions by using two opposing objective lenses or two-photon excitation microscopy using redshifted light and multi-photon excitation.[citation needed]
Integrated correlative microscopy combines a fluorescence microscope with an electron microscope. This allows one to visualize ultrastructure and contextual information with the electron microscope while using the data from the fluorescence microscope as a labelling tool.[11]
The first technique to really achieve a sub-diffraction resolution was STED microscopy, proposed in 1994. This method and all techniques following the RESOLFT concept rely on a strong non-linear interaction between light and fluorescing molecules. The molecules are driven strongly between distinguishable molecular states at each specific location, so that finally light can be emitted at only a small fraction of space, hence an increased resolution.
As well in the 1990s another super resolution microscopy method based on wide field microscopy has been developed. Substantially improved size resolution of cellular nanostructures stained with a fluorescent marker was achieved by development of SPDM localization microscopy and the structured laser illumination (spatially modulated illumination, SMI).[12] Combining the principle of SPDM with SMI resulted in the development of the Vertico SMI microscope.[13][14] Single molecule detection of normal blinking fluorescent dyes like green fluorescent protein (GFP) can be achieved by using a further development of SPDM the so-called SPDMphymod technology which makes it possible to detect and count two different fluorescent molecule types at the molecular level (this technology is referred to as two-color localization microscopy or 2CLM).[15]
Alternatively, the advent of photoactivated localization microscopy could achieve similar results by relying on blinking or switching of single molecules, where the fraction of fluorescing molecules is very small at each time. This stochastic response of molecules on the applied light corresponds also to a highly nonlinear interaction, leading to subdiffraction resolution.
Fluorescence micrograph gallery edit
-
 A z-projection of an osteosarcoma cell, stained with phalloidin to visualise actin filaments. The image was taken on a confocal microscope, and the subsequent deconvolution was done using an experimentally derived point spread function.
 -
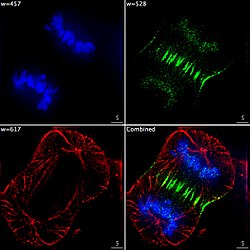 Epifluorescent imaging of the three components in a dividing human cancer cell. DNA is stained blue, a protein called INCENP is green, and the microtubules are red. Each fluorophore is imaged separately using a different combination of excitation and emission filters, and the images are captured sequentially using a digital CCD camera, then overlaid to give a complete image.
 -
 Endothelial cells under the microscope. Nuclei are stained blue with DAPI, microtubules are marked green by an antibody bound to FITC and actin filaments are labeled red with phalloidin bound to TRITC. Bovine pulmonary artery endothelial (BPAE) cells
 -
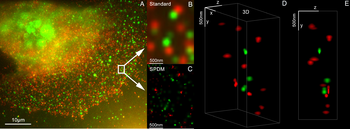 3D dual-color super-resolution microscopy with Her2 and Her3 in breast cells, standard dyes: Alexa 488, Alexa 568. LIMON microscopy
 -
 Human lymphocyte nucleus stained with DAPI with chromosome 13 (green) and 21 (red) centromere probes hybridized (Fluorescent in situ hybridization (FISH))
 -
 Yeast cell membrane visualized by some membrane proteins fused with RFP and GFP fluorescent markers. Imposition of light from both of markers results in yellow color.
 -
 Super-resolution microscopy: Single YFP molecule detection in a human cancer cell. Typical distance measurements in the 15 nm range measured with a Vertico-SMI/SPDMphymod microscope
 -
 Super-resolution microscopy: Co-localization microscopy (2CLM) with GFP and RFP fusion proteins (nucleus of a bone cancer cell) 120.000 localized molecules in a wide-field area (470 µm2) measured with a Vertico-SMI/SPDMphymod microscope
 -
 Fluorescence microscopy of DNA Expression in the Human Wild-Type and P239S Mutant Palladin.
 -
 Fluorescence microscopy images of sun flares pathology in a blood cell showing the affected areas in red.


See also edit
- Correlative light-electron microscopy
- Elizabeth Harry, pioneer of fluorescence microscopy techniques for visualization of bacterial subcellular proteins
- Fluorescence imaging
- Fluorescence in the life sciences
- Green fluorescent protein (GFP)
- Mercury-vapor lamp
- Microscope
- Scanning electron microscope § Cathodoluminescence
- Stokes shift
- Xenon arc lamp
References edit
- ^ a b c d Spring KR, Davidson MW. "Introduction to Fluorescence Microscopy". Nikon MicroscopyU. Retrieved 28 September 2008.
- ^ "The Fluorescence Microscope". Microscopes—Help Scientists Explore Hidden Worlds. The Nobel Foundation. Retrieved 28 September 2008.
- ^ Juan Carlos Stockert, Alfonso Blázquez-Castro (2017). Fluorescence Microscopy in Life Sciences. Bentham Science Publishers. ISBN 978-1-68108-519-7. Archived from the original on 14 May 2019. Retrieved 17 December 2017.
- ^ Huang B (March 2010). "Super resolution fluorescence microscopy". Annual Review of Biochemistry. 78: 993–1016. doi:10.1146/annurev.biochem.77.061906.092014. PMC 2835776. PMID 19489737.
- ^ F.A.W. Coumans; E. van der Pol; L.W.M.M. Terstappen (2012). "Flat-top illumination profile in an epi-fluorescence microscope by dual micro lens arrays". Cytometry Part A. 81 (4): 324–331. doi:10.1002/cyto.a.22029. PMID 22392641. S2CID 13812696.
- ^ Colin, S., Coelho, L.P., Sunagawa, S., Bowler, C., Karsenti, E., Bork, P., Pepperkok, R. and De Vargas, C. (2017) "Quantitative 3D-imaging for cell biology and ecology of environmental microbial eukaryotes". eLife, 6: e26066. doi:10.7554/eLife.26066.002.
 Material was copied from this source, which is available under a Creative Commons Attribution 4.0 International License.
- ^ Bidhendi, AJ; Chebli, Y; Geitmann, A (May 2020). "Fluorescence Visualization of Cellulose and Pectin in the Primary Plant Cell Wall". Journal of Microscopy. 278 (3): 164–181. doi:10.1111/jmi.12895. PMID 32270489. S2CID 215619998.
- ^ Kandel, Mikhail E.; He, Yuchen R.; Lee, Young Jae; Chen, Taylor Hsuan-Yu; Sullivan, Kathryn Michele; Aydin, Onur; Saif, M. Taher A.; Kong, Hyunjoon; Sobh, Nahil; Popescu, Gabriel (2020). "Phase imaging with computational specificity (PICS) for measuring dry mass changes in sub-cellular compartments". Nature Communications. 11 (1): 6256. arXiv:2002.08361. Bibcode:2020NatCo..11.6256K. doi:10.1038/s41467-020-20062-x. PMC 7721808. PMID 33288761. S2CID 212725023.
- ^ Cremer, C; Cremer, T (1978). "Considerations on a laser-scanning-microscope with high resolution and depth of field" (PDF). Microscopica Acta. 81 (1): 31–44. PMID 713859. Archived from the original (PDF) on 4 March 2016. Retrieved 12 August 2013.
- ^ S.W. Hell, E.H.K. Stelzer, S. Lindek, C. Cremer; Stelzer; Lindek; Cremer (1994). "Confocal microscopy with an increased detection aperture: type-B 4Pi confocal microscopy". Optics Letters. 19 (3): 222–224. Bibcode:1994OptL...19..222H. CiteSeerX 10.1.1.501.598. doi:10.1364/OL.19.000222. PMID 19829598.
{{cite journal}}: CS1 maint: multiple names: authors list (link) - ^ Baarle, Kaitlin van. "Correlative microscopy: Opening up worlds of information with fluorescence". Retrieved 16 February 2017.
- ^ Hausmann, Michael; Schneider, Bernhard; Bradl, Joachim; Cremer, Christoph G. (1997), "High-precision distance microscopy of 3D nanostructures by a spatially modulated excitation fluorescence microscope" (PDF), in Bigio, Irving J; Schneckenburger, Herbert; Slavik, Jan; et al. (eds.), Optical Biopsies and Microscopic Techniques II, vol. 3197, p. 217, doi:10.1117/12.297969, S2CID 49339042, archived from the original (PDF) on 4 March 2016, retrieved 12 August 2013
- ^ Reymann, J; Baddeley, D; Gunkel, M; Lemmer, P; Stadter, W; Jegou, T; Rippe, K; Cremer, C; Birk, U (2008). "High-precision structural analysis of subnuclear complexes in fixed and live cells via spatially modulated illumination (SMI) microscopy" (PDF). Chromosome Research. 16 (3): 367–82. doi:10.1007/s10577-008-1238-2. PMID 18461478. S2CID 22811346. Archived from the original (PDF) on 4 March 2016. Retrieved 12 August 2013.
- ^ Baddeley, D; Batram, C; Weiland, Y; Cremer, C; Birk, UJ (2003). "Nanostructure analysis using spatially modulated illumination microscopy" (PDF). Nature Protocols. 2 (10): 2640–6. doi:10.1038/nprot.2007.399. PMID 17948007. S2CID 22042676.[dead link]
- ^ Gunkel, M; Erdel, F; Rippe, K; Lemmer, P; Kaufmann, R; Hörmann, C; Amberger, R; Cremer, C (2009). "Dual color localization microscopy of cellular nanostructures" (PDF). Biotechnology Journal. 4 (6): 927–38. doi:10.1002/biot.200900005. PMID 19548231. S2CID 18162278. Archived from the original (PDF) on 4 March 2016. Retrieved 12 August 2013.
External links edit
- Fluorophores.org[permanent dead link], the database of fluorescent dyes
- Microscopy Resource Center Archived 22 October 2014 at the Wayback Machine
- animations and explanations on various types of microscopes including fluorescent and confocal microscopes (Université Paris Sud)