


Summary
Garfield County is a county located in the U.S. state of Washington. As of the 2020 census, the population was 2,286,[1] making it the least populous county in Washington; with about 3.2 inhabitants per square mile (1.2/km2), it is also the least densely populated county in Washington. The county seat and only city is Pomeroy.[2]
Garfield County | |
|---|---|
 Garfield County Courthouse in Pomeroy | |
 Location within the U.S. state of Washington | |
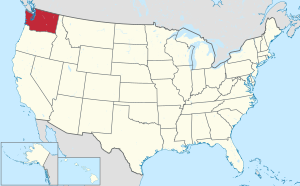 Washington's location within the U.S. | |
| Coordinates: 46°26′N 117°32′W / 46.43°N 117.53°W | |
| Country | |
| State | |
| Founded | November 29, 1881 |
| Named for | James A. Garfield |
| Seat | Pomeroy |
| Largest city | Pomeroy |
| Area | |
| • Total | 718 sq mi (1,860 km2) |
| • Land | 711 sq mi (1,840 km2) |
| • Water | 7.5 sq mi (19 km2) 1.0% |
| Population (2020) | |
| • Total | 2,286 |
| • Estimate (2022) | 2,363 |
| • Density | 3.1/sq mi (1.2/km2) |
| Time zone | UTC−8 (Pacific) |
| • Summer (DST) | UTC−7 (PDT) |
| Congressional district | 5th |
| Website | www |
History edit
The area delineated by the future Washington state boundary began to be colonized at the start of the nineteenth century, both by Americans and British. However, the majority of British exploration and interest in the land was due to the fur trade, whereas American settlers were principally seeking land for agriculture and cattle raising. The Treaty of 1818 provided for the creation of a British and American condominium over the region. During this period, the future Washington Territory was divided into two administrative zones: Clark County and Lewis County (made official in 1845). However, the condominium arrangement was unwieldy, leading to continuous disputes and occasional conflict; it was abolished by an 1846 treaty that established a boundary between British and American possessions that survives as today's Canada–United States border.
In 1854, Skamania County was split from the original Clark County. Also in 1854, Walla Walla County was split from the new Skamania County. In 1875, Columbia County was split from Walla Walla County, and on November 29, 1881, a portion of Columbia County was set off to form Garfield County. The original Garfield County was reduced in size in 1883 when its southeastern area was partitioned off to form Asotin County.[3][4] It was named for the late U.S. President James A. Garfield,[5] who had been assassinated a few weeks prior.
Geography edit
According to the United States Census Bureau, the county has a total area of 718 square miles (1,860 km2), of which 711 square miles (1,840 km2) is land and 7.5 square miles (19 km2) (1.0%) is water.[6] It is part of the Palouse, a wide and rolling prairie-like region of the middle Columbia basin.
Geographic features edit
Major highway edit
Adjacent counties edit
- Whitman County - north
- Asotin County - east
- Wallowa County, Oregon - south
- Columbia County - west
National protected area edit
- Umatilla National Forest (part)
Demographics edit
| Census | Pop. | Note | %± |
|---|---|---|---|
| 1890 | 3,897 | — | |
| 1900 | 3,918 | 0.5% | |
| 1910 | 4,199 | 7.2% | |
| 1920 | 3,875 | −7.7% | |
| 1930 | 3,662 | −5.5% | |
| 1940 | 3,383 | −7.6% | |
| 1950 | 3,204 | −5.3% | |
| 1960 | 2,976 | −7.1% | |
| 1970 | 2,911 | −2.2% | |
| 1980 | 2,468 | −15.2% | |
| 1990 | 2,248 | −8.9% | |
| 2000 | 2,397 | 6.6% | |
| 2010 | 2,266 | −5.5% | |
| 2020 | 2,286 | 0.9% | |
| 2022 (est.) | 2,363 | [7] | 3.4% |
| U.S. Decennial Census[8] 1790–1960[9] 1900–1990[10] 1990–2000[11] 2010–2020[1] | |||
2010 census edit
As of the 2010 census, there were 2,266 people, 989 households, and 650 families living in the county.[12] The population density was 3.2 inhabitants per square mile (1.2/km2). There were 1,233 housing units at an average density of 1.7 units per square mile (0.66 units/km2).[13] The racial makeup of the county was 93.8% white, 1.7% Asian, 0.3% American Indian, 2.3% from other races, and 1.9% from two or more races. Those of Hispanic or Latino origin made up 4.0% of the population.[12] In terms of ancestry, 27.2% were German, 22.4% were English, 19.9% were Irish, 7.9% were Dutch, 5.5% were Swedish, and 3.4% were American.[14]
Of the 989 households, 25.1% had children under the age of 18 living with them, 55.6% were married couples living together, 6.1% had a female householder with no husband present, 34.3% were non-families, and 30.2% of all households were made up of individuals. The average household size was 2.25 and the average family size was 2.79. The median age was 49.0 years.[12]
The median income for a household in the county was $42,469 and the median income for a family was $55,769. Males had a median income of $38,897 versus $30,650 for females. The per capita income for the county was $22,825. About 14.1% of families and 15.7% of the population were below the poverty line, including 22.1% of those under age 18 and 6.6% of those age 65 or over.[15]
2000 census edit
As of the 2000 census, there were 2,397 people, 987 households, and 670 families living in the county. The population density was 3 people per square mile (1.2 people/km2). There were 1,288 housing units at an average density of 2 units per square mile (0.77 units/km2). The racial makeup of the county was 96.45% White, 0.38% Native American, 0.67% Asian, 0.04% Pacific Islander, 1.38% from other races, and 1.08% from two or more races. 1.96% of the population were Hispanic or Latino of any race. 28.8% were of German, 17.9% United States or American, 10.6% English and 9.5% Irish ancestry. 99.2% spoke English as their first language.
There were 987 households, out of which 28.80% had children under the age of 18 living with them, 57.00% were married couples living together, 6.70% had a female householder with no husband present, and 32.10% were non-families. 28.30% of all households were made up of individuals, and 14.40% had someone living alone who was 65 years of age or older. The average household size was 2.39 and the average family size was 2.93.
In the county, the population was spread out, with 25.90% under the age of 18, 5.40% from 18 to 24, 21.90% from 25 to 44, 25.90% from 45 to 64, and 20.90% who were 65 years of age or older. The median age was 43 years. For every 100 females there were 97.90 males. For every 100 females age 18 and over, there were 93.80 males.
The median income for a household in the county was $33,398, and the median income for a family was $41,645. Males had a median income of $33,313 versus $22,132 for females. The per capita income for the county was $16,992. About 12.00% of families and 14.20% of the population were below the poverty line, including 17.10% of those under age 18 and 10.20% of those age 65 or over.
Communities edit
City edit
- Pomeroy (county seat)
Unincorporated communities edit
In popular culture edit
Part of the 1996 film Black Sheep takes place in Garfield County, but was not filmed there.[16]
Politics edit
Garfield County has consistently voted for Republican candidates in presidential elections throughout its history. In only four elections since 1896 have more voters chosen the Democratic candidate, the most recent being the 1964 election. In 1912 the plurality of votes went instead to the Progressive Party candidate, former Republican president Theodore Roosevelt.
| Year | Republican | Democratic | Third party | |||
|---|---|---|---|---|---|---|
| No. | % | No. | % | No. | % | |
| 2020 | 1,069 | 71.79% | 366 | 24.58% | 54 | 3.63% |
| 2016 | 851 | 67.22% | 279 | 22.04% | 136 | 10.74% |
| 2012 | 913 | 71.27% | 336 | 26.23% | 32 | 2.50% |
| 2008 | 968 | 70.50% | 385 | 28.04% | 20 | 1.46% |
| 2004 | 935 | 70.83% | 365 | 27.65% | 20 | 1.52% |
| 2000 | 982 | 73.89% | 300 | 22.57% | 47 | 3.54% |
| 1996 | 623 | 49.64% | 497 | 39.60% | 135 | 10.76% |
| 1992 | 620 | 46.93% | 473 | 35.81% | 228 | 17.26% |
| 1988 | 714 | 54.13% | 593 | 44.96% | 12 | 0.91% |
| 1984 | 913 | 63.94% | 493 | 34.52% | 22 | 1.54% |
| 1980 | 875 | 57.60% | 509 | 33.51% | 135 | 8.89% |
| 1976 | 892 | 57.18% | 616 | 39.49% | 52 | 3.33% |
| 1972 | 1,004 | 65.45% | 481 | 31.36% | 49 | 3.19% |
| 1968 | 841 | 53.03% | 602 | 37.96% | 143 | 9.02% |
| 1964 | 751 | 49.02% | 781 | 50.98% | 0 | 0.00% |
| 1960 | 914 | 56.88% | 690 | 42.94% | 3 | 0.19% |
| 1956 | 966 | 60.15% | 639 | 39.79% | 1 | 0.06% |
| 1952 | 1,157 | 66.76% | 559 | 32.26% | 17 | 0.98% |
| 1948 | 749 | 48.92% | 747 | 48.79% | 35 | 2.29% |
| 1944 | 925 | 57.38% | 677 | 42.00% | 10 | 0.62% |
| 1940 | 1,003 | 58.08% | 714 | 41.34% | 10 | 0.58% |
| 1936 | 652 | 38.83% | 983 | 58.55% | 44 | 2.62% |
| 1932 | 669 | 44.42% | 818 | 54.32% | 19 | 1.26% |
| 1928 | 1,004 | 70.60% | 412 | 28.97% | 6 | 0.42% |
| 1924 | 875 | 65.25% | 324 | 24.16% | 142 | 10.59% |
| 1920 | 869 | 66.03% | 370 | 28.12% | 77 | 5.85% |
| 1916 | 845 | 52.26% | 728 | 45.02% | 44 | 2.72% |
| 1912 | 345 | 22.16% | 426 | 27.36% | 786 | 50.48% |
| 1908 | 556 | 58.53% | 333 | 35.05% | 61 | 6.42% |
| 1904 | 777 | 70.32% | 267 | 24.16% | 61 | 5.52% |
| 1900 | 528 | 52.59% | 437 | 43.53% | 39 | 3.88% |
| 1896 | 378 | 43.20% | 482 | 55.09% | 15 | 1.71% |
| 1892 | 351 | 36.26% | 288 | 29.75% | 329 | 33.99% |
See also edit
Footnotes edit
- ^ a b "State & County QuickFacts". United States Census Bureau. Retrieved November 1, 2023.
- ^ "Find a County". National Association of Counties. Archived from the original on May 31, 2011. Retrieved June 7, 2011.
- ^ "Milestones for Washington State History – Part 2: 1851 to 1900". HistoryLink. June 13, 2010.
- ^ Dougherty, Phil (February 14, 2006). "Asotin County – Thumbnail History". HistoryLink.
- ^ Gannett, Henry (1905). The Origin of Certain Place Names in the United States. Govt. Print. Off. p. 134.
- ^ "2010 Census Gazetteer Files". United States Census Bureau. August 22, 2012. Retrieved July 5, 2015.
- ^ "Annual Estimates of the Resident Population for Counties: April 1, 2020 to July 1, 2022". United States Census Bureau. Retrieved November 1, 2023.
- ^ "U.S. Decennial Census". United States Census Bureau. Retrieved January 7, 2014.
- ^ "Historical Census Browser". University of Virginia Library. Retrieved January 7, 2014.
- ^ "Population of Counties by Decennial Census: 1900 to 1990". United States Census Bureau. Retrieved January 7, 2014.
- ^ "Census 2000 PHC-T-4. Ranking Tables for Counties: 1990 and 2000" (PDF). United States Census Bureau. Archived from the original (PDF) on February 26, 2015. Retrieved January 7, 2014.
- ^ a b c "Profile of General Population and Housing Characteristics: 2010 Demographic Profile Data". United States Census Bureau. Archived from the original on February 13, 2020. Retrieved March 6, 2016.
- ^ "Population, Housing Units, Area, and Density: 2010 - County". United States Census Bureau. Archived from the original on February 13, 2020. Retrieved March 6, 2016.
- ^ "Selected Social Characteristics in the United States – 2006-2010 American Community Survey 5-Year Estimates". United States Census Bureau. Archived from the original on February 13, 2020. Retrieved March 6, 2016.
- ^ "Selected Economic Characteristics – 2006-2010 American Community Survey 5-Year Estimates". United States Census Bureau. Archived from the original on February 13, 2020. Retrieved March 6, 2016.
- ^ "Wikipedia, the free encyclopedia". www.wikipedia.org. Retrieved January 12, 2024.
- ^ Leip, David. "Dave Leip's Atlas of U.S. Presidential Elections". uselectionatlas.org. Retrieved April 6, 2018.
Further reading edit
- Frank T. Gilbert, Historic Sketches: Walla Walla, Columbia and Garfield Counties, Washington Territory. Portland, OR: A.G. Walling Printing House, 1882.
- W.D. Lyman, Lyman's History of Old Walla Walla County, Embracing Walla Walla, Columbia, Garfield and Asotin Counties. In Two Volumes. Chicago: S.J. Clarke Publishing Co., 1918. Volume 1 | Volume 2
- Frederic Ambrose Shaver, An Illustrated History of Southeastern Washington, Including Walla Walla, Columbia, Garfield and Asotin Counties, Washington. Spokane, WA: Western Historical Publishing Co., 1906.
46°26′N 117°32′W / 46.43°N 117.53°W