
KNOWPIA
WELCOME TO KNOWPIA

GenGIS 
Summary
GenGIS[1] merges geographic, ecological and phylogenetic biodiversity data in a single interactive visualization and analysis environment. A key feature of GenGIS is the testing of geographic axes that can correspond to routes of migration or gradients that influence community similarity.[2] Data can also be explored using graphical summaries of data on a site-by-site basis, as 3D geophylogenies, or custom visualizations developed using a plugin framework. Standard statistical test such as linear regression and Mantel are provided, and the R statistical language can be accessed directly within GenGIS. Since its release, GenGIS has been used to investigate the phylogeography of viruses and bacteriophages, bacteria, and eukaryotes.
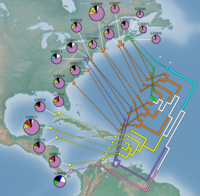 Biodiversity of 19 marine metagenomes from the Global Ocean Sampling Expedition. | |
| Developer(s) | Donovan Parks, Mike Porter, Timothy Mankowski, Suwen Wang, Sylvia Churcher, Alex Keddy, Christian Blouin, Jacqueline Whalley, Stephen Brooks, Rob Beiko |
|---|---|
| Stable release | 2.5.3
/ 22 April 2017 |
| Repository |
|
| Operating system | Windows, Mac OS X |
| Type | Bioinformatics |
| License | GPL v3 |
| Website | kiwi |
See also edit
References edit
- ^ Parks, DH; Porter M; Churcher S; Wang S; Blouin C; Whalley J; Brooks S; Beiko RG (2009). "GenGIS: A geospatial information system for genomic data". Genome Research. 19 (10): 1896–1904. doi:10.1101/gr.095612.109. PMC 2765287. PMID 19635847.
- ^ Parks, DH; Beiko RG (2009). "Quantitative visualizations of hierarchically organized data in a geographic context". 2009 17th International Conference on Geoinformatics. pp. 1–6. doi:10.1109/GEOINFORMATICS.2009.5293552. ISBN 978-1-4244-4562-2. S2CID 22986133.
{{cite book}}:|journal=ignored (help)
External links edit
- GenGIS homepage