


Summary
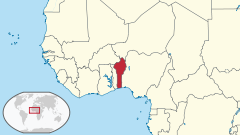
Benin, a narrow, key-shaped, north–south strip of land in West Africa, lies between the Equator and the Tropic of Cancer. Its latitude ranges from 6°30′ N to 12°30′ N and its longitude from 1° E to 3°40′ E. It is bounded by Togo to the west, Burkina Faso and Niger to the north, Nigeria to the east, and the Bight of Benin to the south.
  | |
| Continent | Africa |
|---|---|
| Region | West Africa Sub-Saharan Africa |
| Coordinates | 9°30′N 2°15′E / 9.500°N 2.250°E |
| Area | Ranked 102nd |
| • Total | 112,622 km2 (43,484 sq mi) |
| • Land | 98.2% |
| • Water | 1.8% |
| Coastline | 121 km (75 mi) |
| Borders | Total land borders: 2,123 km (1,319 mi) Burkina Faso 386 km (240 mi), Niger 277 km (172 mi), Nigeria 809 km (503 mi), Togo 651 km (405 mi) |
| Highest point | Mont Sokbaro 658 m (2,159 ft) |
| Lowest point | Atlantic Ocean sea level |
| Terrain | flat to undulating plain; some hills and mountains |
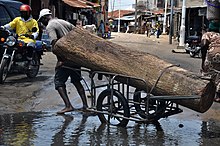
| Natural resources | oil, limestone, marble, timber |
| Environmental issues | deforestation, desertification |
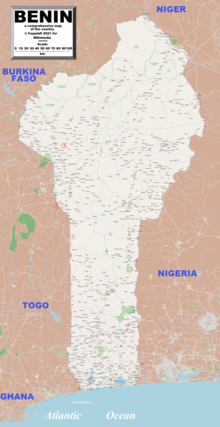
With an area of 112,622 km2 (43,484 sq mi), it is slightly bigger than the nation of Bulgaria. It extends from the Niger River in the north to the Atlantic Ocean in the south, a distance of 700 km (435 mi). Although the coastline measures 121 km (75 mi), the country measures about 325 km (202 mi) at its widest point.
It is one of the smaller countries in West Africa, about one eighth the size of Nigeria, its neighbor to the east. It is, however, twice as large as Togo, its neighbor to the west. A relief map of Benin shows that it has little variation in elevation, averaging 200 m (656 ft) in elevation.
Biogeography edit
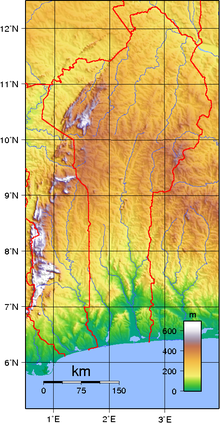
The country can be divided into four main areas from the south to the north. The low-lying, sandy, coastal plain, which has a highest elevation of 10 m (33 ft) is, at most, 10 km (6 mi) wide. It is marshy and dotted with lakes and lagoons connected to the ocean. The plateaus of southern Benin, with an altitude ranging between 20 and 200 m (66 and 656 ft), are split by valleys running north to south along the Couffo, Zou, and Oueme Rivers, an area that has been categorised by the World Wildlife Fund as part of the Guinean forest-savanna mosaic ecoregion. Then an area of flat lands dotted with rocky hills whose altitude seldom reaches 400 m (1,312 ft) extends around Nikki and Savé. Finally, the Atacora mountain range extends along the northwest border and into Togo with the highest point, Mont Sokbaro, at 658 m (2,159 ft).
Benin has fields lying fallow, mangroves, and remnants of large sacred forests. In the rest of the country, the savanna is covered with thorny scrubs and dotted with huge baobab trees. Some forests line the banks of rivers. In the north and the northwest of Benin the Reserve du W du Niger and Pendjari National Park attract tourists eager to see elephants, lions, antelopes, hippos and monkeys. The country formerly offered habitat for the endangered painted hunting dog, Lycaon pictus,[1] although this canid is considered to have been extirpated from Benin due to human population expansion. Woodlands comprise approximately 31 percent of Benin's land area.[2]
Location: Western Africa, bordering the North Atlantic Ocean, between Nigeria and Togo
Geographic coordinates: 9°30′N 2°15′E / 9.500°N 2.250°E
Continent: Africa
Area:
total:
112 622 km2
country comparison to the world: 102
land:
110 622 km2
water:
2 000 km2
Area comparative
- Australia comparative: slightly less than 1/2 the size of Victoria
- Canada comparative: approximately 11/2 times the size of New Brunswick
- United Kingdom comparative: approximately 1/7 smaller than England
- United States comparative: slightly larger than Virginia
- EU comparative: slightly larger than Bulgaria
Land boundaries:
total:
2 123 km
border countries:
Burkina Faso 386 km, Niger 277 km, Nigeria 809 km, Togo 651 km
Coastline: 121 km
Maritime claims:
territorial sea:
200 nautical miles (370.4 km)
Climate: tropical; hot, humid in south; semiarid in north
Terrain: mostly flat to undulating plain; some hills and low mountains
Elevation extremes:
lowest point:
Atlantic Ocean 0 m
highest point:
Mont Sokbaro 658 m
Natural resources: small offshore oil deposits, limestone, marble, timber
Land use:
arable land: 23.94%
permanent crops: 3.99%
other: 72.06% (2012)
Irrigated land: 230.4 km2 (2012)
'Total renewable water resources: 26.39 km3 (2011)
Freshwater withdrawal (domestic/industrial/agricultural):
total: 0.13 km3/a (32%/23%/45%)
per capita: 18.74 m3/a (2001)
Natural hazards: hot, dry, dusty harmattan wind may affect north in December to March
Environment - current issues: inadequate supplies of potable water; poaching threatens wildlife populations; deforestation; desertification
Environment - international agreements:
party to:
Biodiversity, Climate Change, Climate Change-Kyoto Protocol Desertification, Endangered Species, Environmental Modification, Hazardous Wastes, Law of the Sea, Ozone Layer Protection, Ship Pollution, Wetlands, Whaling
Sandbanks create difficult access to a coast with no natural harbors, river mouths, or islands.
Climate edit

Benin's climate is hot and humid. Annual rainfall in the coastal area averages 1,360 mm (53.5 in), not particularly high for coastal West Africa. Benin has two rainy and two dry seasons. The principal rainy season is from April to late July, with a shorter less intense rainy period from late September to November. The main dry season is from December to April, with a short cooler dry season from late July to early September. Temperatures and humidity are high along the tropical coast. In Cotonou, the average maximum temperature is 31 °C (87.8 °F); the minimum is 24 °C (75.2 °F). Variations in temperature increase when moving north through a savanna and plateau toward the Sahel. A dry wind from the Sahara called the harmattan blows from December to March. Grass dries up, the vegetation turns reddish brown, and a veil of fine dust hangs over the country, causing the skies to be overcast. It is also the season when farmers burn brush in the fields.
| Climate data for Porto-Novo | |||||||||||||
|---|---|---|---|---|---|---|---|---|---|---|---|---|---|
| Month | Jan | Feb | Mar | Apr | May | Jun | Jul | Aug | Sep | Oct | Nov | Dec | Year |
| Daily mean °C (°F) | 27 (81) |
28 (82) |
28 (82) |
28 (82) |
27 (81) |
26 (79) |
25 (77) |
25 (77) |
25 (77) |
26 (79) |
27 (81) |
27 (81) |
26 (79) |
| Average rainfall mm (inches) | 23 (0.9) |
34 (1.3) |
86 (3.4) |
127 (5.0) |
215 (8.5) |
370 (14.6) |
129 (5.1) |
44 (1.7) |
89 (3.5) |
140 (5.5) |
52 (2.0) |
16 (0.6) |
1,325 (52.1) |
| Source: [3] | |||||||||||||
| Climate data for Cotonou (1961–1990, extremes 1910–present) | |||||||||||||
|---|---|---|---|---|---|---|---|---|---|---|---|---|---|
| Month | Jan | Feb | Mar | Apr | May | Jun | Jul | Aug | Sep | Oct | Nov | Dec | Year |
| Record high °C (°F) | 36.1 (97.0) |
38.6 (101.5) |
36.0 (96.8) |
35.4 (95.7) |
39.0 (102.2) |
33.0 (91.4) |
33.5 (92.3) |
31.8 (89.2) |
31.6 (88.9) |
33.4 (92.1) |
35.4 (95.7) |
36.6 (97.9) |
39.0 (102.2) |
| Mean daily maximum °C (°F) | 30.8 (87.4) |
31.6 (88.9) |
31.9 (89.4) |
31.6 (88.9) |
31.0 (87.8) |
29.2 (84.6) |
28.0 (82.4) |
27.8 (82.0) |
28.4 (83.1) |
29.6 (85.3) |
30.9 (87.6) |
30.8 (87.4) |
30.1 (86.2) |
| Daily mean °C (°F) | 27.3 (81.1) |
28.5 (83.3) |
28.9 (84.0) |
28.6 (83.5) |
27.8 (82.0) |
26.5 (79.7) |
25.8 (78.4) |
25.6 (78.1) |
26.0 (78.8) |
26.7 (80.1) |
27.6 (81.7) |
27.3 (81.1) |
27.2 (81.0) |
| Mean daily minimum °C (°F) | 23.8 (74.8) |
25.4 (77.7) |
25.9 (78.6) |
25.6 (78.1) |
24.6 (76.3) |
23.7 (74.7) |
23.7 (74.7) |
23.4 (74.1) |
23.6 (74.5) |
23.8 (74.8) |
24.3 (75.7) |
23.8 (74.8) |
24.3 (75.7) |
| Record low °C (°F) | 17.0 (62.6) |
17.9 (64.2) |
18.5 (65.3) |
20.7 (69.3) |
19.6 (67.3) |
20.0 (68.0) |
18.8 (65.8) |
19.8 (67.6) |
20.0 (68.0) |
19.1 (66.4) |
21.0 (69.8) |
17.9 (64.2) |
17.0 (62.6) |
| Average rainfall mm (inches) | 9.2 (0.36) |
36.8 (1.45) |
73.8 (2.91) |
137.0 (5.39) |
196.9 (7.75) |
356.0 (14.02) |
147.0 (5.79) |
64.9 (2.56) |
99.0 (3.90) |
126.7 (4.99) |
41.4 (1.63) |
19.6 (0.77) |
1,308.3 (51.52) |
| Average rainy days (≥ 1.0 mm) | 1 | 2 | 4 | 7 | 11 | 15 | 8 | 5 | 8 | 8 | 4 | 2 | 75 |
| Average relative humidity (%) | 82 | 82 | 80 | 82 | 83 | 87 | 86 | 86 | 86 | 86 | 85 | 83 | 84 |
| Mean monthly sunshine hours | 213.9 | 210.0 | 223.2 | 219.0 | 213.9 | 141.0 | 136.4 | 148.8 | 165.0 | 207.7 | 243.0 | 223.2 | 2,345.1 |
| Mean daily sunshine hours | 6.9 | 7.5 | 7.2 | 7.3 | 6.9 | 4.7 | 4.4 | 4.8 | 5.5 | 6.7 | 8.1 | 7.2 | 6.4 |
| Source 1: NOAA[4] | |||||||||||||
| Source 2: Deutscher Wetterdienst (humidity, 1951–1967),[5] Meteo Climat (record highs and lows)[6] | |||||||||||||
| Climate data for Parakou (1961–1990) | |||||||||||||
|---|---|---|---|---|---|---|---|---|---|---|---|---|---|
| Month | Jan | Feb | Mar | Apr | May | Jun | Jul | Aug | Sep | Oct | Nov | Dec | Year |
| Record high °C (°F) | 36.6 (97.9) |
38.3 (100.9) |
38.9 (102.0) |
38.4 (101.1) |
35.9 (96.6) |
33.7 (92.7) |
32.1 (89.8) |
31.6 (88.9) |
32.2 (90.0) |
33.9 (93.0) |
35.5 (95.9) |
35.8 (96.4) |
38.9 (102.0) |
| Mean daily maximum °C (°F) | 34.1 (93.4) |
36.0 (96.8) |
36.2 (97.2) |
34.9 (94.8) |
32.8 (91.0) |
30.7 (87.3) |
29.2 (84.6) |
28.6 (83.5) |
29.5 (85.1) |
31.5 (88.7) |
33.6 (92.5) |
33.6 (92.5) |
32.6 (90.7) |
| Daily mean °C (°F) | 26.5 (79.7) |
28.7 (83.7) |
29.6 (85.3) |
29.0 (84.2) |
27.5 (81.5) |
26.1 (79.0) |
25.1 (77.2) |
24.7 (76.5) |
25.0 (77.0) |
26.1 (79.0) |
26.6 (79.9) |
26.1 (79.0) |
26.8 (80.2) |
| Mean daily minimum °C (°F) | 18.9 (66.0) |
21.3 (70.3) |
22.9 (73.2) |
23.1 (73.6) |
22.2 (72.0) |
21.4 (70.5) |
21.0 (69.8) |
20.8 (69.4) |
20.5 (68.9) |
20.8 (69.4) |
19.7 (67.5) |
18.5 (65.3) |
20.9 (69.6) |
| Record low °C (°F) | 15.8 (60.4) |
18.2 (64.8) |
19.9 (67.8) |
19.9 (67.8) |
19.2 (66.6) |
18.9 (66.0) |
19.0 (66.2) |
19.1 (66.4) |
18.5 (65.3) |
18.6 (65.5) |
16.7 (62.1) |
15.2 (59.4) |
15.2 (59.4) |
| Average precipitation mm (inches) | 3.8 (0.15) |
9.2 (0.36) |
39.4 (1.55) |
85.5 (3.37) |
130.8 (5.15) |
172.0 (6.77) |
189.9 (7.48) |
208.8 (8.22) |
205.6 (8.09) |
91.1 (3.59) |
6.3 (0.25) |
6.6 (0.26) |
1,149 (45.24) |
| Average precipitation days (≥ 1.0 mm) | 0 | 1 | 3 | 5 | 9 | 11 | 12 | 13 | 15 | 7 | 1 | 1 | 78 |
| Source: NOAA[7] | |||||||||||||
| Climate data for Kandi (1961–1990, extremes 1921–present) | |||||||||||||
|---|---|---|---|---|---|---|---|---|---|---|---|---|---|
| Month | Jan | Feb | Mar | Apr | May | Jun | Jul | Aug | Sep | Oct | Nov | Dec | Year |
| Record high °C (°F) | 41.2 (106.2) |
43.0 (109.4) |
43.3 (109.9) |
43.9 (111.0) |
43.3 (109.9) |
40.9 (105.6) |
38.9 (102.0) |
39.9 (103.8) |
39.8 (103.6) |
41.5 (106.7) |
39.5 (103.1) |
39.5 (103.1) |
43.9 (111.0) |
| Mean daily maximum °C (°F) | 33.6 (92.5) |
36.4 (97.5) |
38.4 (101.1) |
38.6 (101.5) |
36.2 (97.2) |
33.3 (91.9) |
30.9 (87.6) |
30.2 (86.4) |
31.1 (88.0) |
34.2 (93.6) |
35.3 (95.5) |
33.8 (92.8) |
34.3 (93.7) |
| Daily mean °C (°F) | 24.9 (76.8) |
27.8 (82.0) |
30.9 (87.6) |
32.1 (89.8) |
30.4 (86.7) |
28.1 (82.6) |
26.4 (79.5) |
26.0 (78.8) |
26.2 (79.2) |
27.8 (82.0) |
26.5 (79.7) |
24.8 (76.6) |
27.7 (81.9) |
| Mean daily minimum °C (°F) | 16.1 (61.0) |
19.2 (66.6) |
23.4 (74.1) |
25.6 (78.1) |
24.6 (76.3) |
22.9 (73.2) |
21.9 (71.4) |
21.8 (71.2) |
21.4 (70.5) |
21.4 (70.5) |
17.7 (63.9) |
15.8 (60.4) |
21.0 (69.8) |
| Record low °C (°F) | 10.0 (50.0) |
12.6 (54.7) |
15.2 (59.4) |
17.0 (62.6) |
16.5 (61.7) |
14.9 (58.8) |
18.6 (65.5) |
19.0 (66.2) |
15.0 (59.0) |
14.0 (57.2) |
10.8 (51.4) |
5.0 (41.0) |
5.0 (41.0) |
| Average precipitation mm (inches) | 0.2 (0.01) |
2.9 (0.11) |
8.2 (0.32) |
40.5 (1.59) |
107.0 (4.21) |
152.7 (6.01) |
196.9 (7.75) |
271.9 (10.70) |
190.9 (7.52) |
34.1 (1.34) |
0.5 (0.02) |
0.6 (0.02) |
1,006.6 (39.63) |
| Average precipitation days (≥ 1.0 mm) | 0 | 0 | 1 | 3 | 8 | 10 | 13 | 16 | 13 | 3 | 0 | 0 | 67 |
| Average relative humidity (%) | 33 | 28 | 36 | 52 | 65 | 75 | 82 | 85 | 85 | 76 | 54 | 40 | 59 |
| Mean monthly sunshine hours | 279.0 | 257.6 | 260.4 | 255.0 | 272.8 | 252.0 | 223.2 | 195.3 | 213.0 | 275.9 | 282.0 | 279.0 | 3,045.2 |
| Source 1: NOAA[8] | |||||||||||||
| Source 2: Deutscher Wetterdienst (humidity, 1951–1967),[9] Meteo Climat (record highs and lows)[10] | |||||||||||||
Extreme points edit
This is a list of the extreme points of Benin, the points that are farther north, south, east or west than any other location.
- Northernmost point – the confluence of the Mékrou River and the river Niger on the border with Niger, Alibori Department
- Easternmost point – unnamed location on the border with Nigeria immediately east of the town of Néganzi, Borgou Department
- Southernmost point – the point at which the border with Togo enters the Atlantic Ocean, Mono Department
- Westernmost point - unnamed location on the border with Togo immediately south-west of Tiokossi in Datori, Atakora Department
References edit
- C. Michael Hogan. 2009. Painted Hunting Dog: Lycaon pictus, GlobalTwitcher.com, ed. N. Stromberg
- Rebecca Kormos and Christophe Boesch. 2003. West African chimpanzees: status survey and conservation action plan, International Union for Conservation of Nature and Natural Resources, IUCN/SSC Primate Specialist Group, 219 pages ISBN 2-8317-0733-1, ISBN 978-2-8317-0733-4
 This article incorporates public domain material from The World Factbook. CIA.
- This article incorporates public domain material from U.S. Bilateral Relations Fact Sheets. United States Department of State.
Line notes edit
- ^ C. Michael Hogan. 2009
- ^ Rebecca Kormos and Christophe Boesch. 2003
- ^ "Weatherbase". Weatherbase. Retrieved December 13, 2012.
- ^ "Cotonou, Benin Climate Normals 1961-1990". National Oceanic and Atmospheric Administration. Retrieved December 19, 2018.
- ^ "Klimatafel von Cotonou, Prov. Atlantique (Süd) / Benin" (PDF). Baseline climate means (1961-1990) from stations all over the world (in German). Deutscher Wetterdienst. Archived (PDF) from the original on 24 February 2020. Retrieved 11 June 2016.
- ^ "Station Cotonou" (in French). Meteo Climat. Archived from the original on 5 March 2020. Retrieved 11 June 2016.
- ^ "Parakou Climate Normals 1961–1990". National Oceanic and Atmospheric Administration. Retrieved January 13, 2015.
- ^ "KANDI Climate Normals 1961-1990". National Oceanic and Atmospheric Administration. Retrieved June 11, 2016.
- ^ "Klimatafel von Kandi, Prov. Borgou (Nordost) / Benin" (PDF). Baseline climate means (1961-1990) from stations all over the world (in German). Deutscher Wetterdienst. Retrieved 11 June 2016.
- ^ "Station Kansi" (in French). Meteo Climat. Retrieved 11 June 2016.
External links edit
- Soil Maps of Benin European Digital Archive on the Soil Maps of the world