


Summary
The Hay Shire is a local government area in the Riverina area of south-western New South Wales, Australia. The Shire comprises 11,326 square kilometres (4,373 sq mi) and is located adjacent to the Sturt, Mid-western and Cobb Highways. The area includes the towns of Hay, Booligal and Maude.
| Hay Shire New South Wales | |||||||||||||||
|---|---|---|---|---|---|---|---|---|---|---|---|---|---|---|---|
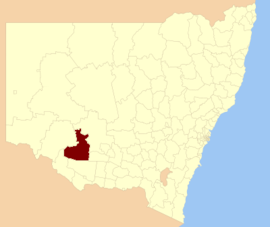 Location in New South Wales | |||||||||||||||
| Coordinates | 34°30′S 144°51′E / 34.500°S 144.850°E | ||||||||||||||
| Population | 2,884 (2021 census)[1] | ||||||||||||||
| • Density | 0.25464/km2 (0.65951/sq mi) | ||||||||||||||
| Established | 1 January 1965 | ||||||||||||||
| Area | 11,325.89 km2 (4,373.0 sq mi)[2] | ||||||||||||||
| Mayor | Cr. Carol Oataway (Unaligned)[3] | ||||||||||||||
| Council seat | Hay | ||||||||||||||
| Region | Riverina | ||||||||||||||
| State electorate(s) | Murray | ||||||||||||||
| Federal division(s) | Farrer | ||||||||||||||
| Website | Hay Shire | ||||||||||||||
| |||||||||||||||
Hay Shire was established in 1965 by the amalgamation of the Municipality of Hay with the surrounding Waradgery Shire.[4]
The mayor of Hay Shire is Cr. Carol Oataway, an unaligned politician who had previously held the position of Principal of Hay Public School.[3][5]
Demographics edit
| Selected historical census data for Hay Shire local government area | |||||||
|---|---|---|---|---|---|---|---|
| Census year | 2001[6] | 2006[7] | 2011[8] | 2016[9] | 2021[1] | ||
| Population | Estimated residents on census night | 3,562 | |||||
| Aboriginal and/or Torres Strait Islanders (%) | 3.5% | ||||||
| LGA rank in terms of size within New South Wales | 123rd | ||||||
| % of New South Wales population | 0.06% | ||||||
| % of Australian population | 0.02% | ||||||
| Cultural and linguistic diversity | 2001 | 2006 | 2011 | 2016 | 2021 | ||
| Country of birth (top responses) |
Australia | 90.4% | |||||
| India | 0.7% | ||||||
| New Zealand | 0.8% | ||||||
| England | 1.0% | ||||||
| Fiji | 0.4% | ||||||
| Scotland | 0.3% | ||||||
| Language (top responses, other than English) |
Italian | 1.1% | |||||
| Punjabi | |||||||
| Fijian | 0.2% | ||||||
| Afrikaans | 0.4% | ||||||
| Malayalam | 0.3% | ||||||
| Religious affiliation | 2001 | 2006 | 2011 | 2016 | 2021 | ||
| Religious affiliation (top responses) |
Catholic | 36.4% | |||||
| No Religion | 7.1% | ||||||
| Anglican | 31.8% | ||||||
| Not stated | n/c | n/c | n/c | 12.8% | |||
| Presbyterian and Reformed | 9.2% | ||||||
| Median weekly incomes | 2001 | 2006 | 2011 | 2016 | 2021 | ||
| Personal income | Median weekly personal income | A$404 | A$441 | A$587 | A$700 | ||
| % of Australian median income | 86.7% | ||||||
| Family income | Median weekly family income | A$983 | A$981 | A$1,344 | A$1,622 | ||
| % of Australian median income | 83.9% | ||||||
| Household income | Median weekly household income | A$741 | A$805 | A$1,075 | A$1,236 | ||
| % of Australian median income | 72.2% | ||||||
Council edit

Current composition and election method edit
Hay Shire Council is composed of eight councillors elected proportionally as a single ward. All councillors are elected for a fixed four-year term of office. The mayor is elected by the councillors at the first meeting of the council. The most recent election was held on 20 December 2021, and the makeup of the council is as follows:[10]
| Party | Councillors | |
|---|---|---|
| Unaligned | 8 | |
| Total | 8 | |
The current Council was elected in December 2021. The councillors, in order of election, are:[10]
| Councillor | Party | Notes | |
|---|---|---|---|
| Martyn Quinn | Unaligned | ||
| Jenny Dwyer | Unaligned | ||
| Peter Handford | Unaligned | ||
| Peter Dwyer | Unaligned | Resigned in August 2022 | |
| Carol Oataway | Unaligned | Mayor[3] | |
| Lionel Garner | Unaligned | Deputy Mayor[3] | |
| Paul Porter | Unaligned | ||
| Geoff Chapman | Unaligned | ||
| Darren Clarke | Unaligned | Elected 26 August 2022 (replacing Peter Dwyer, resigned)[11] | |
Election results edit
2021 edit
| Party | Candidate | Votes | % | ±% | |
|---|---|---|---|---|---|
| Independent | Jenny Dwyer (elected) | 491 | 28.1 | ||
| Independent | Martyn Quinn (elected) | 264 | 15.1 | ||
| Independent | Peter Handford (elected) | 198 | 11.3 | ||
| Independent | Peter Dwyer (elected) | 190 | 10.9 | ||
| Independent | Carol Oataway (elected) | 117 | 6.7 | ||
| Independent | Lionel Garner (elected) | 103 | 5.9 | ||
| Independent | Geoff Chapman (elected) | 90 | 5.2 | ||
| Independent | John Perry | 64 | 3.7 | ||
| Independent | Darren Clarke | 62 | 3.5 | ||
| Independent | Paul Porter (elected) | 57 | 3.3 | ||
| Independent | Beverley McRae | 48 | 2.7 | ||
| Independent | David Townsend | 33 | 1.9 | ||
| Independent | Megan Ruska | 30 | 1.7 | ||
| Total formal votes | 1,747 | 97.4 | |||
| Informal votes | 47 | 2.6 | |||
| Turnout | 1,794 | 83.6 | |||
Literary reference edit
Banjo Paterson (1864–1941) wrote a poem called Hay and Hell and Booligal about the district.[13]
References edit
- ^ a b Australian Bureau of Statistics (28 June 2022). "Hay". 2021 Census QuickStats. Retrieved 25 September 2023.
- ^ "Hay Regional Profile". Riverina Regional Development Board. Archived from the original on 19 July 2008. Retrieved 28 August 2008.
- ^ a b c d Councillors, Hay Shire Council website; accessed 24 September 2023.
- ^ "Waradgery Shire Council". Search. State Records NSW. Retrieved 21 May 2016.
- ^ Ian Beissel (2019), Hay Public School: 150 Years of History 1869-2019, Hay Historical Society, page 175.
- ^ Australian Bureau of Statistics (9 March 2006). "Hay (A)". 2001 Census QuickStats. Retrieved 17 November 2020.
- ^ Australian Bureau of Statistics (25 October 2007). "Hay (A)". 2006 Census QuickStats. Retrieved 17 November 2020.
- ^ Australian Bureau of Statistics (31 October 2012). "Hay (A)". 2011 Census QuickStats. Retrieved 17 November 2020.
- ^ Australian Bureau of Statistics (27 June 2017). "Hay (A)". 2016 Census QuickStats. Retrieved 8 December 2017.
- ^ a b "Hay Shire Council: Councillor Election". Local Government Elections 2021. Electoral Commission of New South Wales. 20 December 2021. Retrieved 24 September 2023.
- ^ 26 August 2022 Hay Shire Council countback election, NSW Electoral Commission website; accessed 24 September 2023.
- ^ "Hay". ABC News.
- ^ "Hay and Hell and Booligal". ghostwolf.dyndns.org. Archived from the original on 14 April 2013. Retrieved 6 September 2008.