


Summary
Hi-C is a high-throughput genomic and epigenomic technique to capture chromatin conformation.[1] In general, Hi-C is considered as a derivative of a series of chromosome conformation capture technologies, including but not limited to 3C (chromosome conformation capture), 4C (chromosome conformation capture-on-chip/circular chromosome conformation capture), and 5C (chromosome conformation capture carbon copy).[1][2][3][4] Hi-C comprehensively detects genome-wide chromatin interactions in the cell nucleus by combining 3C and next-generation sequencing (NGS) approaches and has been considered as a qualitative leap in C-technology (chromosome conformation capture-based technologies) development and the beginning of 3D genomics.[2][3][4]

Similar to the classic 3C technique, Hi-C measures the frequency (as an average over a cell population) at which two DNA fragments physically associate in 3D space, linking chromosomal structure directly to the genomic sequence.[4] The general procedure of Hi-C involves first crosslinking chromatin material using formaldehyde.[3][4] Then, the chromatin is solubilized and fragmented, and interacting loci are re-ligated together to create a genomic library of chimeric DNA molecules.[4] The relative abundance of these chimeras, or ligation products, is correlated to the probability that the respective chromatin fragments interact in 3D space across the cell population.[4] While 3C focuses on the analysis of a set of predetermined genomic loci to offer “one-versus-some” investigations of the conformation of the chromosome regions of interest, Hi-C enables “all-versus-all” interaction profiling by labeling all fragmented chromatin with a biotinylated nucleotide before ligation.[3][4] As a result, biotin-marked ligation junctions can be purified more efficiently by streptavidin-coated magnetic beads, and chromatin interaction data can be obtained by direct sequencing of the Hi-C library.[3][4]
Analyses of Hi-C data not only reveal the overall genomic structure of mammalian chromosomes, but also offer insights into the biophysical properties of chromatin as well as more specific, long-range contacts between distant genomic elements (e.g. between genes and regulatory elements),[4][5][6] including how these change over time in response to stimuli.[7] In recent years, Hi-C has found its application in a wide variety of biological fields, including cell growth and division, transcription regulation, fate determination, development, autoimmune disease, and genome evolution.[7][5][6] By combining Hi-C data with other datasets such as genome-wide maps of chromatin modifications and gene expression profiles, the functional roles of chromatin conformation in genome regulation and stability can also be delineated.[4]
History edit
At its inception, Hi-C was a low-resolution, high-noise technology that was only capable of describing chromatin interaction regions within a bin size of 1 million base pairs (Mb).[1] The Hi-C library also required several days to construct,[4][8] and the datasets themselves were low in both output and reproducibility.[9] Nevertheless, Hi-C data offered new insights for chromatin conformation as well as nuclear and genomic architectures, and these prospects motivated scientists to put efforts to modify the technique over the past decade.
Between 2012 and 2015, several modifications to the Hi-C protocol have taken place, with 4-cutter digestion[10] or adapted deeper sequencing depth to obtain higher resolution.[8][9][11] The use of restriction endonucleases that cut more frequently, or DNaseI and Micrococcal nucleases also significantly increased the resolution of the method.[12] More recently (2017), Belaghzal et al. described a Hi-C 2.0 protocol that was able to achieve kilobase (kb) resolution.[12] The key adaptation to the base protocol was the removal of the SDS solubilization step after digestion to preserve nuclear structure and prevent random ligation between fragmented chromatin by ligation within the intact nuclei, which formed the basis of in situ Hi-C.[12] In 2021, Hi-C 3.0 was described by Lafontaine et al., with higher resolution achieved by enhancing crosslinking with formaldehyde followed by disuccinimidyl glutarate (DSG).[13] While formaldehyde captures the amino and imino groups of both proteins and DNA, the NHS-esters in DSG react with primary amines on proteins and can capture amine-amine interactions.[13] These updates to the base protocol allowed the scientists to look at more detailed conformational structures such as chromosomal compartment and topologically associating domains (TADs), as well as high-resolution conformational features such as DNA loops.[12][13]
To date, a variety of derivatives of Hi-C have already emerged, including in situ Hi-C, low Hi-C, SAFE Hi-C, and Micro-C, with distinctive features related to different aspects of standard Hi-C, but the basic principle has remained the same.
Traditional Hi-C edit
The outline of the classical Hi-C workflow is as follows: cells are cross-linked with formaldehyde; chromatin is digested with a restriction enzyme that generates a 5’ overhang; the 5’ overhang is filled with biotinylated bases and the resulting blunt-ended DNA is ligated.[1] The ligation products, with biotin at the junction, are selected for using streptavidin and further processed to prepare a library ready for subsequent sequencing efforts.[1]
The pairwise interactions that Hi-C can capture across the genome are immense and so it is important to analyze an appropriately large sample size, in order to capture unique interactions that may only be observed in a minority of the general population.[4] To obtain a high complexity library of ligation products that will ensure high resolution and depth of data, a sample of 20–25 million cells is required as input for Hi-C.[3][4] Primary human samples, which may be available only in fewer cell numbers, could be used for standard Hi-C library preparation with as low as 1–5 million cells.[4] However, using such a low input of cells may be associated with low library complexity which results in a high percentage of duplicate reads during library preparation.[4]
Standard Hi-C gives data on pairwise interactions at the resolution of 1 to 10 Mb, requires high sequencing depth and the protocol takes around 7 days to complete.[3][4][14]
Formaldehyde cross-linking edit
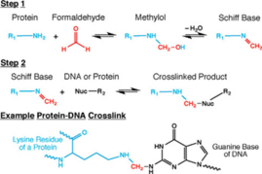
Cell and nuclear membranes are highly permeable to formaldehyde.[4][15][16] Formaldehyde cross-linking is frequently employed for the detection and quantification of DNA-protein and protein-protein interactions.[15] Of interest in the context of Hi-C, and all 3C-based methods, is the ability of formaldehyde to capture cis chromosomal interactions between distal segments of chromatin.[1][4][15][16] It does so by forming covalent links between spatially adjacent chromatin segments. Formaldehyde can react with macromolecules in two steps: first it reacts with a nucleophilic group on a DNA base for example, and forms a methylol adduct, which is then converted to a Schiff base.[15] In the second step, the Schiff base, which can decompose rapidly, forms a methylene bridge with another functional group on another molecule.[15] It can also make this methylene bridge with a small molecule in solution such as glycine, which is used in excess to quench formaldehyde in Hi-C.[1][4][15][16] Quenchers can typically exert an effect on formaldehyde from outside the cell.[15] A key feature of this two-step formaldehyde crosslinking reaction is that all the reactions are reversible, which is vital for chromatin capture.[1][4][15][16]
Crosslinking is a pivotal step of the chromatin capture workflow as the functional readout of the technique is the frequency at which two genomic regions are crosslinked to each other.[4] Thus, the standardization of this step is important and for that, one must consider potential sources of variation.[4] Presence of serum, which contains a high concentration of protein, in culture media can decrease the effective concentration of formaldehyde available for chromatin crosslinking, by sequestering it in the culture media.[4] Therefore, in cases where serum is used in culture, it should be removed for the crosslinking step.[4] The nature of cells, i.e., whether they are suspension or adherent, is also a pertinent consideration for the crosslinking step.[4] Adherent cells bind to surfaces with the help of molecular mechanisms of cytoskeletons.[4] It has been shown that there is a link between cytoskeleton-maintained nuclear and cellular morphology which, if altered, may negatively impact global nuclear organization.[4] Adherent cells therefore, should be crosslinked while still attached to their culture surface.[4]
Lysis, restriction digest and biotinylation edit
Cells are lysed on ice with cold hypotonic buffer containing sodium chloride, Tris-HCl at pH 8.0, and non-ionic detergent IGEPAL CA-630, supplemented with protease inhibitors.[4][16] The protease inhibitors and incubation on ice help preserve the integrity of crosslinked chromatin complexes from endogenous proteases.[4][16] The lysis step helps to release the nucleic material from the cells.[1][4][16]
Following cell lysis, chromatin is solubilized with dilute SDS in order to remove proteins that have not been crosslinked and to open chromatin and make it more accessible for subsequent restriction endonuclease-mediated digestion.[4] If the incubation with SDS exceeds the recommended 10 minutes, the formaldehyde crosslinks can be reversed and so the incubation with SDS must be immediately followed by an incubation on ice.[4] A non-ionic detergent called Triton X-100 is used to quench SDS in order to prevent enzyme denaturation in the next step.[4]
Any restriction enzyme that generates a 5’ overhang, such as HindIII can be used to digest the now accessible chromatin overnight.[4][16] This 5’ overhang provides the template required by the Klenow fragment of DNA Polymerase I to add biotinylated CTP or ATP to the digested ends of chromatin.[4][16] This step allows for the selection of Hi-C ligation products for library preparation.[4][16]
Proximity ligation edit
A dilution ligation is performed on DNA fragments that are still crosslinked to one another in order to favor the intramolecular ligation of fragments within the same chromatin complex instead of ligation events between fragments across different complexes.[4][16] Since this ligation step occurs between blunt-ended DNA fragments (since the sticky ends have been filled in with biotin-labeled bases), the reaction is allowed to go on for up to 4 hours to make up for its inherent inefficiency.[16] As a result of proximity ligation, the terminal HindIII sites are lost and an NheI site is generated.[1]
Biotin removal, DNA shearing, size selection and end repair edit
The biotin-labeled ligation products can be purified using phenol-chloroform DNA extraction.[4][16][17] To remove any fragments with biotin-labeled ends that have not been ligated, T4 DNA Polymerase with 3’ to 5’ exonuclease activity is used to remove nucleotides from the ends of such fragments.[4][16][18] This step ensures that none of these unligated fragments are selected for library preparation.[4][16] The reaction is stopped with EDTA and the DNA is purified once again using phenol-chloroform DNA extraction.[4][16]
The ideal size of DNA fragments for the sequencing library depends on the sequencing platform that will be used.[4][16] DNA can first be sheared to fragments around 300–500 bp long using sonication.[4][16][17] Fragments of this size are suitable for high-throughput sequencing.[4][16][17] Following sonication, fragments can be size selected using AMPure XP beads from Beckman Coulter to obtain ligation products with a size distribution between 150 and 300 bp.[4][17] This is the optimal fragment size window for HiSeq cluster formation.[4][17]
DNA shearing causes asymmetric DNA breaks and must be repaired before biotin pulldown and sequencing adaptor ligation.[4][16] This is achieved by using a combination of enzymes that fill in 5’ overhangs, and add 5’ phosphate groups and adenylate to the 3’ ends of fragments to allow for ligation of sequencing adaptors.[4][16]
Biotin pull-down edit
Using an excess of streptavdin beads, such as the My-One C1 streptavidin bead solution from Dynabeads, biotinylated Hi-C ligation products can be pulled-down and enriched for.[4][16] Ligation of the Illumina paired-end adapters is performed while the DNA fragments are bound to the streptavidin beads.[4][16][17] Adsorption to the beads increases efficiency of the ligation of these blunt-ended DNA fragments to the adaptors, as it decreases their mobility.[4][16][17]
Library preparation and sequencing edit
After the ligation of the adaptors is complete, PCR amplification of the library is performed.[4][16] The PCR step can introduce high number of duplicates in a low complexity Hi-C ligation product sample as a result of over-amplification.[4][16] This results in very few interactions being captured and oftentimes, this is because the input sample size had a low amount of cells.[4][16] It is important to titrate the number of cycles required to get at least 50 ng of Hi-C library DNA for sequencing.[4][16] Fewer the cycle number, the better so that there are no PCR artifacts (such as off-target amplicons, non-specificity, etc.).[4][16] The ideal range of PCR cycles is 9–15 and it is more ideal to pool multiple PCR reactions to get enough DNA for sequencing, than to increase the number of cycles for one PCR reaction.[4][16] The PCR products are purified again using AMPure beads to remove primer dimers and then quantified before being sequenced.[4][16] Regions of chromatin that interact with each other are then identified by paired-end sequencing of the biotinylated, ligated products.[4][16]
Any platform that can allow for the ligated fragments to be sequenced across the NheI junction (Roche 454) or by paired-end or mate-paired reads (Illumina GA and HiSeq platforms) would be suitable for Hi-C.[4] Before high-throughput sequencing, the quality of the library should be verified using Sanger sequencing, wherein the long sequencing read will read through the biotin junction.[4] Thirty-six or 50 bp reads are sufficient to identify most chromatin interacting pairs using Illumina paired-end sequencing.[4] Since the average size of fragments in the library is 250 bp, 50bp paired-end reads have been found to be optimum for Hi-C library sequencing.[4]
Quality control of Hi-C libraries edit
There are several pressure points throughout the workflow of Hi-C sample preparation that are well documented and reported.[4][16] DNA at various stages can be run on 0.8% agarose gels to assay the size distribution of fragments.[4][16] This is particularly important after shearing of size selection steps.[4][16] Degradation of DNA can also be monitored as smears appearing as a result under low molecular weight products on gels.[4][16] Degradation can occur due to not adding sufficient protease inhibitors during lysis, endogenous nuclease activity or thermal degradation due to incorrect icing.[4][16] 3C PCR reactions can be performed to test for the formation of proximity ligation products.[4][16]
Variants edit
Standard Hi-C has a high input cell number cost, requires deep sequencing, generates low-resolution data, and suffers from formation of redundant molecules that contribute to low complexity libraries when cell numbers are low.[4][16][17] To combat these issues in order to be able to apply this technique in contexts where cell number is a limiting factor, for example, with primary human cell work, several Hi-C variants have been developed since the first conceptualization of Hi-C.[3]
The four main classes under which Hi-C variants fall under are: dilution ligation, in situ ligation, single cell, and low noise improvement systems.[3] Standard Hi-C is a type of dilution ligation and other dilution ligation include DNase Hi-C and Capture Hi-C.[3] In contrast to standard and Capture Hi-C, DNase Hi-C requires only 2–5 million cells as input, uses DNaseI for chromatin fragmentation and employs an in-gel dilution proximity ligation.[3][19][20] The use of DNaseI has been shown to greatly improve efficiency and resolution of Hi-C.[3][19] Capture Hi-C is a genome-wide assaying technique to look at chromatin interactions of specific loci using a hybridization-based capture of targeted genomic regions.[20] It was first developed by Mifsud et al. to map long-range promoter contacts in human cells by generating a biotinylated RNA bait library that targeted 21,841 promoter regions.[20] These variants, in addition to others (described below), represent modifications to the foundational technique of standard Hi-C and address and alleviate one or more limitations of the original method.
In situ Hi-C edit
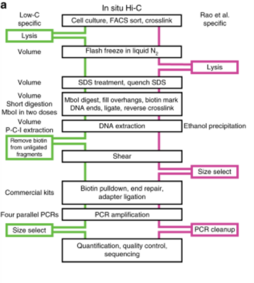
In situ Hi-C combines standard Hi-C with nuclear ligation assay, i.e., proximity ligation performed in intact nuclei.[14][21] The protocol is similar to standard Hi-C in terms of the basic workflow outline but differs in other ways.[14] In situ Hi-C requires 2 to 5 million cells compared to the ideal 20 to 25 million required for standard Hi-C and it requires only 3 days to complete the protocol versus 7 days for standard Hi-C.[14] Furthermore, proximity ligation does not take place in solution like in standard Hi-C, decreasing the frequency of random, biologically irrelevant contacts and ligations, as indicated by the lower frequency of mitochondrial and nuclear DNA contacts in captured biotinylated DNA.[14] This is achieved by leaving the nuclei intact for the ligation step.[14] Cells are still lysed with a buffer containing Tris-HCl at pH 8.0, sodium chloride, and the detergent IGEPAL CA630 before ligation, but instead of homogenization of the cell lysate, cell nuclei are pelleted after initial lysis to degrade the cell membrane.[14] After proximity ligation is complete, cell nuclei are incubated for at least 1.5 hours at 68 degrees Celsius to permeabilize the nuclear membrane and release its nuclear contents.[14]
The resolution that can be achieved with in situ Hi-C can be up to 950 to 1000 bp compared to the 1 to 10 Mb resolution of standard Hi-C and the 100 kb resolution of DNase Hi-C.[3][4][14][19] While standard Hi-C makes use of a 6-bp cutter such as HindIII for the restriction digest step, in situ Hi-C uses a 4-bp cutter such as MboI or its isoschizomer DpnII (which is not sensitive to CpG methylation) to increase efficiency and resolution (as the restriction sites of MboI and DpnII are more frequently occurring in the genome).[3][4][14] Data between replicates for in situ Hi-C is consistent and highly reproducible, with very less background noise and demonstrating clear chromatin interactions.[3][14] It is however possible that some of the captured interactions may not be accurate intermolecular interactions since the nucleus is densely packed with protein and DNA so performing proximity ligations in intact nuclei may pull down confounding interactions that may only form due to the nature of nuclear packaging and not so much unique chromosomal interactions with cellular functional impact.[3][14] It also requires an extremely high sequencing depth of around 5 billion paired-end reads per sample to achieve the resolution of data described by Rao et al.[3][14][22] Several techniques that have adapted the concept of in situ Hi-C exist, including Sis Hi-C, OCEAN-C and in situ capture Hi-C.[3] Described below are two of the most prominent in situ Hi-C based techniques.[3]
1. Low-C edit
Low-C is an in situ Hi-C protocol adapted for use on low cell numbers, which is particularly useful in contexts where cell number is a limiting agent, for example, in primary human cell culture.[23] This method makes use of minor changes, including volumes and concentrations used and the timing and order of certain experimental steps to allow for the generation of high-quality Hi-C libraries from cell numbers as low as 1000 cells.[23] Despite the potential of generating usable and high resolution data with as few as 1000 cells, Diaz et al. still recommend using at least 1 to 2 million cells if feasible, or if not a minimum of 500 K cells.[23] Library quality was first assessed on the Illumina MiSeq (2x84 np paired-end reads) platform and once passed quality control criteria (including low PCR duplicates), the library was sequenced on Illumina NextSeq (2x80 bp paired-end).[23] Overall, this technique circumvents the issue of requiring a high cell number input for Hi-C and the high sequencing depth required to obtain high resolution data, but can only achieve resolutions of up to 5 kb and may not always be reproducible due the variable nature of sample sizes used and the data generated from it.[23]
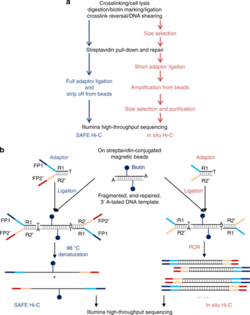
2. SAFE Hi-C edit
SAFE Hi-C, or simplified, fast, and economically efficient Hi-C, generates sufficient ligated fragments without amplification for high-throughput sequencing.[17] In situ Hi-C data that has been published indicates that amplification (at the PCR step for library preparation) introduces distance-dependent amplification bias, which results in a higher noise to signal ratio against genomic distance.[17] SAFE Hi-C was successfully used to generate an amplification-free, in situ Hi-C ligation library from as low as 250 thousand K562 cells.[17] Ligation fragments are anywhere between 200 and 500 bp long, with an average at about 370 bp.[17] All ligation product libraries were sequenced using the Illumina HiSeq platform (2x150 bp paired-end reads).[17] Although SAFE Hi-C can be used for a cell input as low as 250 thousand, Niu et al. recommend using 1 to 2 million cells.[17] Samples produce enough ligates to be sequenced on one-fourth of a lane.[17] SAFE Hi-C has been demonstrated to increase library complexity due to the removal of PCR duplicates which lower the overall percentage of unique paired reads.[17] Overall, SAFE Hi-C preserves the integrity of chromosomal interactions while also reducing the need to have high sequencing depth and saving overall cost and labor.[17]
Micro-C edit
Micro-C is a version of Hi-C that includes a micrococcal nuclease (MNase) digestion step to look at interactions between pairs of nucleosomes, thus enabling resolution of sub-genomic TAD structures at the 1 to 100 nucleosome scale.[24][25] It was first developed for use in yeast and was shown to conserve the structural data obtained from a standard Hi-C but with greater signal-to-noise ratio.[24][25] When used with human embryonic stem cells and fibroblasts, 2.6 to 4.5 billion uniquely mapped reads were obtained per sample.[24][25] Hsieh et al. analyzed 2.64 billion reads from mouse embryonic stem cells and demonstrated that there was increased power for detecting short-range interactions.[24][25][26]

Single cell Hi-C edit
Hi-C has also been adapted for use with single cells but these techniques require high levels of expertise to perform and are plagued with issues such as low data quality, coverage, and resolution.[3]
Data analysis edit
The chimeric DNA ligation products generated by Hi-C represent pairwise chromatin interactions or physical 3D contacts within the nucleus,[1][2][3][4] and can be analyzed by a variety of downstream approaches. Briefly, deep sequencing data is used to build unbiased genome-wide chromatin interaction maps.[3][4][27][28][29][30] Then several different methods can be employed to analyze these maps to identify chromosomal structural patterns and their biological interpretations. Many of these data analysis approaches also apply to 3C-sequencing or other equivalent data.
Read mapping edit
Hi-C data produced by deep sequencing is in the form of a traditional FASTQ file, and the reads can be aligned to the genome of interest using sequence alignment software (e.g. Bowtie,[31] bwa,[9][32] etc.).[27][28] Because Hi-C ligation products may span hundreds of megabases and may bridge loci on different chromosomes,[3][4][27][28] Hi-C read alignment is often chimeric in the sense that different parts of a read may be aligned to loci distant apart, possibly in different orientations. Long-read aligners (e.g. minimap2[33]) often support chimeric alignment and can be directly applied to long-read Hi-C data. Short-read Hi-C alignment is more challenging.
Notably, Hi-C generates ligation junctions of varying sizes, but the exact position of the ligation site is not measured.[3][4][27] To circumvent this problem, iterative mapping[27] is used to avoid the search for the junction site before being able to split the reads into two and mapping them separately to identify the interaction pairs. The idea behind iterative mapping is to map as short a sequence as possible to ensure unique identification of interaction pairs before reaching the junction site.[27][28] As a result, 25-bp long reads starting from the 5’ end are mapped to the genome at first, and reads that do not uniquely map to a single loci are extended by an additional 5 bp and then re-mapped.[27] This process is repeated till all reads uniquely map, or till the reads are extended to their entirety.[27][28] Only paired end reads with each side uniquely mapped to a single genomic loci are kept.[28] All other paired end reads are discarded.
Several variations of read mapping techniques are implemented in many bioinformatics pipelines, such as ICE,[34] HiC-Pro,[35] HIPPIE,[36] HiCUP,[37] and TADbit,[38] to map two portions of a paired end read separately, in the case that the two portions match distinct genomic positions, thus addressing the challenge where reads span the ligation junctions.[28]
With increased read length, more recent pipelines (e.g. Juicer[39] and the 4D-Nucleosome Data Portal[40]) often align short Hi-C reads with an alignment algorithm capable of chimeric alignment, such as bwa-mem,[41] chromap[42] and dragmap. This procedure calls alignment once and is simpler than iterative mapping.
Fragment assignment and filtering edit
The mapped reads are then each assigned a single genomic alignment location according to its 5’ mapped position in the genome.[27] For each read pair, a location is assigned to only one of the restriction fragments, thus should fall in close proximity to a restriction site and less than the maximum molecule length away.[27][28] Reads mapped more than the maximum molecule length away from the closest restriction sites are the results of physical breakage of the chromatin or non-canonical nuclease activities.[27] Because these reads also instruct information on chromatin interactions, they are not discarded, but appropriate filtering must take place after assigning genomic locations to remove technical noise in the dataset.[27][28][29][30]
Depending on whether the read pair falls within the same or different restriction fragments, different filtering criteria are applied. If the paired reads map to the same restriction fragment, they likely represent un-ligated dangling ends or circularized fragments that are uninformative, and are therefore removed from the dataset.[27][28] These reads could also represent PCR artifacts, undigested chromatin fragments, or simply, reads with low alignment quality.[8][28] Whatever their origin, reads mapped to the same fragment are considered “spurious signals”[28] and are typically discarded before downstream processing.
The remaining paired reads mapped to distinct restriction fragments are also filtered to discard identical/redundant PCR products, and this is achieved by removing reads sharing the exact same sequence or 5’ alignment positions.[27] Additional levels of filtering could also be applied to fit the experimental purpose. For example, potential undigested restriction sites could be specifically filtered out, rather than passively identified, by removing reads mapped to the same chromosomal strand with a small distance (user-defined, experience-based) in between.[27]

Binning and bin-level filtering edit
Based on their midpoint coordinates, Hi-C restriction fragments are binned into fixed genomic intervals, with bin sizes ranging from 40 kb to 1 Mb.[27] The rationale behind this approach is that by reducing the complexity of the data and lowering the number of candidate genome-wide interactions per bin, genomic bins allow for the construction of more robust and less noisy signals, in the form of contact frequencies, at the expense of resolution (though restriction fragment length still remains the ultimate physical limit to Hi-C resolution).[27][28] Bin to bin interactions are aggregated by simply taking the sum, although more focused and informative methods have also been developed over the years to further enhance the signal.[27] One such method described by Rao et al. aims to push the limit of bin size to smaller and smaller bins, eventually having > 80% of bins covered by 1000 reads each, which significantly increased the resolution of the final analysis results.[14]
Bin-level filtering, just like fragment-level filtering, also takes place to shed experimental artifacts from the obtained data. Bins with high noise and low signals are removed as they typically represent highly repetitive genomic contents around the telomeres and centromeres.[27] This is done by comparing the individual bin sums to the sum of all bins and removing the bottom 1% of bins, or by using the variance as a measure of noise.[27] Low-coverage bins, or bins three standard deviations below the center of a log-normal distribution (which fits the total number of contacts per genomic bin), are removed using the MAD-max (maximum allowed median absolute deviation) filter.[43][44] After binning, Hi-C data will be stored in a symmetrical matrix format.[27][28][29][30]
More recently, many approaches have been proposed to predetermine the optimal bin size for different Hi-C experiments. Li et al. in 2018 described deDoc, a method where bin size is selected as the one at which the structural entropy of the Hi-C matrix reaches a stable minimum.[45] QuASAR, on the other hand, offers a bit more quality assessment, and compares replicate scores of the samples (given that replicates are indeed included for the experimental purpose) to find the maximum usable resolution.[46] Some publications[8][47] also tried to score interaction frequencies at the single-fragment level, where a higher coverage can be achieved even with a lower number of reads. HiCPlus,[48] a tool developed by Zhang et al. in 2018, is able to impute Hi-C matrices similar to the original ones using only 1/16 of the original reads.[48]
Balancing/normalization edit
Balancing refers to the process of bias correction of the obtained Hi-C data, and can be either explicit or implicit.[27][28] Explicit balancing methods require the explicit definitions of biases known to be associated with Hi-C reads (or any high-throughput sequencing technique in general) including the read mappability, GC content, as well as individual fragment length.[27][28] A correction factor is first computed for each of the considered biases, followed by each of their combination, and then applied to the read counts per genomic bin.[27][28]
However, some biases can come from an unknown origin, in which case an implicit balancing approach is used instead. Implicit balancing relies on the assumption that each genomic locus should have “equal visibility”, which suggests that the interaction signal at each genomic locus in the Hi-C data should add up to the same total amount.[28] One approach called iterative correction uses the Sinkhorn–Knopp balancing algorithm[49] and attempts to balance the symmetrical matrix using the aforementioned assumption (by equalizing the sum of each and every row and column in the matrix).[27][28][49] The algorithm iteratively alternates between two steps: 1) dividing each row by its mean, and 2) dividing each column by its mean, which are guaranteed to converge in the end and leave no obviously high rows or columns in the interaction matrix.[27][49] Other computational methods also exist to normalize the biases inherent to Hi-C data, including sequential component normalization (SCN),[50] the Knight-Ruiz matrix-balancing approach,[14][51] and eigenvector decomposition (ICE) normalization.[34] In the end, both the explicit and the implicit bias correction methods yield comparable results.[27]
Analysis and data interpretation edit
With a binned, genome-wide interaction matrix, common interaction patterns observed in mammalian genomes can be identified and interpreted biologically, while more rare, less frequently observed patterns such as circular chromosomes and centromere clustering, may require additional specially-tailored methods to be identified.
1. Cis/trans interaction ratio edit
Cis/trans interactions are one of the two strongest interaction patterns observed in Hi-C maps.[27] They are not locus-specific, and thus are considered as a genome-level pattern.[27] Typically, a higher interaction frequency is observed, on average, for pairs of loci residing on the same chromosome (in cis) than pairs of loci residing on different chromosomes (in trans).[27] In Hi-C interaction matrices, cis/trans interactions appear as square blocks centered along a diagonal, matching individual chromosomes at the same time.[27] Because this pattern is relatively consistent across different species and cell types, it can be used to assess the quality of the data. A noisier experiment, due to random background ligation or any unknown factor, will result in a lower cis to trans interaction ratio (as the noise is expected to affect both cis and trans interactions to a similar extent), and high-quality experiments typically have a cis/trans interaction ratio between 40 and 60 for the human genome.[27]
2. Distance-dependent interaction frequency edit
This pattern refers to the distance-dependent decay of interaction frequencies on a genome level, and represents the second one of the two strongest Hi-C interaction patterns.[27] As the interaction frequencies between cis-interacting loci decrease (as a result of further distance between them), a gradual decrease of interaction frequency can be observed moving away from the diagonal in the interaction matrix.[27]
Various polymer models[52][53] exist to statistically characterize the properties of loci pairs separated by a given distance, but discrete binning and fitting continuous functions are two common ways to analyze the distance-dependent interaction frequencies between datapoints.[27] First, interaction frequencies can be binned based on their genomic distance, then a continuous function is fitted to the data using information of the average of each bin.[27] The resulting decay function is plotted on a log-log plot so that a linear line can be used to represent the power-law decays predicted by polymer models.[52][53] However, oftentimes a simple polymer model will not be sufficient to fully represent the distance-dependent interaction frequencies, at which point more complicated decay functions might result, which might affect the reproducibility of the data due to the presence of locus-specific rather than genome-wide patterns observed in the Hi-C matrix (which are not taken into consideration by polymer models).[27][52][53]
3. Chromatin compartments edit
The strongest locus-specific pattern found in Hi-C maps is chromatin compartments,[1] which takes the shape of a plaid or “checker-board”-like pattern on the interaction matrix, with alternating blocks that range between 1 and 10 Mb in size (which makes them easy to extract even in experiments with very low sampling) in the human genome.[27][28][30] This pattern can be found at both high and low frequencies. Because chromosomes consist of two types of genomic regions that alternate along the length of individual chromosomes, the interaction frequencies between two regions of the same type and interaction frequencies between two regions of different types can be quite different.[27][28]
The definition of the active (A) and inactive (B) chromatin compartments is based on principal component analysis, first established by Lieberman-Aiden et al. in 2009.[1][27][28][30] Their approach calculated the correlation of the Hi-C matrix of observed vs. expected signal (obtained from a distance-normalized contact matrix) ratio, and used the sign of the first eigenvector to denote positive and negative parts of the resulting plot as A and B compartments, respectively.[1][27][28][30] Many genomic studies have indicated that chromatin compartments are correlated with chromatin states, such as gene density, DNA accessibility, GC content, replication timing, and histone marks.[1][27][28][30] Therefore, type A compartments are more specifically defined to represent the gene-dense regions of euchromatin, while type B compartments represent heterochromatic regions with less gene activities.[27][28][30] Overall, chromatin compartments offer insights on the general organization principles of the genome of interest.
More and more bioinformatics tools capable of performing compartment calling have been developed over the past decade, including HOMER,[54] HiTC R,[35] and CscoreTool.[55] Although they each has their own differences and optimizations made on the original 2009 approach, their base protocols still rely on principal component analysis.
4. Topologically associating domains (TADs) edit
TADs are sub-Mb structures that may harbor gene-regulatory features, such as local promoter-enhancer interactions.[27] More generally, TADs are considered as an emergent property of underlying biological mechanisms, which defines TADs as loop extrusions, compartmentalizations, or any dynamic genomic pattern rather than a static structural feature of the genome.[56] Thus, TADs represent regulatory microenvironments and usually show up on a Hi-C map as blocks of highly self-interacting regions in which interaction frequencies within the region are significantly higher than interaction frequencies between two adjacent regions.[27][28][30] In Hi-C interaction matrices, TADs are square blocks of elevated interaction frequencies centred along the diagonal.[27] However, this is merely an oversimplified description, and identifying the actual pattern requires much more statistical processing and estimation.
One approach to identify TADs was described by Dixon et al.,[9] where they first calculated (within some genomic range) the difference between the average upstream interactions and the average downstream interactions of each bin in the matrix.[9] This difference was then transformed into a chi-squared statistic based on the Hidden Markov Model, and any sharp change in this chi-squared value, called the directionality index, will define the boundaries of TADs.[9][27] Alternatively, one could simply take the ratio between average upstream and downstream interactions to define TAD boundaries, as did Naumova et al.[57]
Another approach is to calculate the average interaction frequencies crossing over each bin, again within some predetermined genomic range.[27][28][58] The resulting value is referred to as the insulation score and can be thought of as the average of a square sliding along the diagonal of the matrix (Crane et al.).[58] This value is expected to be lower at TAD boundaries; thus, one can use standard statistical techniques to find local minima (boundaries), and define regions between consecutive boundaries to be TADs.[27][28][58]
However, as is increasingly recognized today, TADs represent a hierarchical series of structures that cannot be fully characterized by one-dimensional scores given by the previous methods.[28] The increased resolution available in newer datasets can now explicitly address TADs with multiscale analysis approaches. As first introduced by Armatus,[59] resolution specific domains can be identified and a consensus set of domains conserved across resolutions can be calculated,[28][59] which transforms the problem of TAD calling into the optimization of scoring functions based on their local interaction densities.[59] Variations of this approach with different objective functions, such as Lavaburst,[60] MrTADFinder,[61] 3DNetMod,[62] and Matryoshka,[63] are also developed to achieve better computing performance on higher resolution datasets.
5. Point interactions edit
Biologically, regulatory interactions usually occur at much smaller scale than TADs, and two genomic elements can activate/inhibit the expression of a gene within as small a distance as 1 kb.[27] Therefore, point interactions are important in interpreting Hi-C maps, and are expected to appear as local enrichments in contact probability.[27][28] However, current methodologies for the identification of point interactions are all implicit in nature, in that they do not instruct what a point interaction should look like.[27][28] Instead, point mutations are identified as outliers with higher interaction frequencies than expected within the Hi-C matrix, given that the background model consists only of the strongest signals such as the distance-decay functions.[27][28] The background model can be estimated and constructed using both local signal distributions and global approaches (i.e. chromosome-wide/genome-wide).[28] Many of the aforementioned bioinformatics packages incorporate algorithms to identify point interactions. In short, the significance of individual pairwise interaction is calculated, and significantly high outliers are corrected for multiple testing before they are recognized as truly informative point interactions.[27] It is helpful to compliment identified point interactions with additional evidence such as analysis of enrichment scores and biological replicates, to indicate that these interactions are indeed of biological significance.[27]
Uses edit
Development edit
1. Cell division edit
Hi-C can reveal chromatin conformation changes during cell division. In interphase, chromatins are generally loose and vivacious so that transcription regulation and other regulatory activities could take place.[64] When entering mitosis and cell division, chromatins become compactly folded into dense cylindrical chromosomes.[64] Within the past five years, the development of single-cell Hi-C has enabled the depiction of the entire 3D structural landscape of chromatins/chromosomes throughout the cell cycle, and many studies have discovered that these identified genomic domains remain unchanged in interphase, and are erased by silencing mechanisms when the cell enters mitosis.[65][66] When mitotic division is completed and the cell re-enters the interphase, chromatin 3D structures are observed to be re-established, and transcription regulation is restored.[65]
2. Transcription regulation and fate determination edit
It has been suspected that the differentiation of embryonic stem cells (ESCs) and induced pluripotent stem cells (iPSCs) into various mature cell lineages is accompanied by global changes in chromosomal structures and consequently interaction dynamics to allow for the regulation of transcriptional activation/silencing.[3] Standard Hi-C can be used to investigate this research question.
In 2015, Dixon et al.[11] applied standard Hi-C to capture global 3D dynamics in human ESCs during their differentiation into high five cells. Due to the ability of Hi-C to depict dynamic interactions in differentiation-related TADs, the researchers discovered increases in the number of DHS sites, CTCF binding ability, active histone modifications, and target gene expressions within these TADs of interest, and found significant participation of major pluripotency factors such as OCT4, NANOG, and SOX2 in the interaction network during somatic cell reprogramming.[11] Since then, Hi-C has been recognized as one of the standard methods to probe for transcriptional regulatory activities, and has confirmed that chromosome architecture is closely related to cell fate.[11][67]
3. Growth and development edit
Mammalian somatic growth and development starts with the fertilization of sperm and oocyte, followed by the zygote stage, the 2-cell, 4-cell, and the 8-cell stage, the blastocyst stage, and finally the embryo stage.[68] Hi-C made it possible to explore the comprehensive genomic architecture during growth and development, as both sis-Hi-C[69] and in situ Hi-C[70] have reported that TADs and genomic A and B compartments are not obviously present and appear to be less well-structured in oocyte cells.[69][70] These structural features of the chromatin only gradually establish from weaker frequencies to cleaner and more frequent datapoints after fertilization, as developmental stages progress.[69][70]
Genome evolution edit
As data on 3D genome structures becomes more and more prevalent in recent years, Hi-C begins to be used as a means to track evolutionary structural features/changes. Genomic single nucleotide polymorphisms (SNPs) and TADs are typically conserved across species,[71] along with the CTCF factor in the chromatin domain evolution.[72] Other factors, however, have been revealed by Hi-C techniques to experience structural evolutions in 3D architecture. These include codon usage frequency similarity (CUFS),[73] paralog gene co-regulation,[74] and spatially co-evolving orthologous modules (SCOMs).[75] For large-scale domain evolution, chromosomal translocations, syntenic regions, as well as genomic rearrangement regions were all relatively conserved.[2][67][72][76][77] These findings imply that Hi-C technologies is capable of providing an alternative point of view in the eukaryotic tree of life.[3]
Cancer edit
Several studies have employed the use of Hi-C to describe and study chromatin architecture in different cancers and their impact on disease pathogenesis. Kloetgen et al. used in situ Hi-C to study T cell acute lymphoblastic leukemia (T-ALL) and found a TAD fusion event that removed a CTCF insulation site, allowing for the oncogene MYC’s promoter to directly interact with a distal super enhancer.[78] Fang et al. have also shown how there are T-ALL specific gain or loss of chromatin insulation, which alters the strength of TAD architecture of the genome, using in situ Hi-C.[79] Low-C has been used to map the chromatin structure of primary B cells of a diffuse large B-cell lymphoma patient and was used to find high chromosome structural variation between the patient and healthy B-cells.[23] Overall, the application of Hi-C and its variants in cancer research provides unique insight into the molecular underpinnings of the driving factors of cell abnormality.[23][78][79] It can help explain biological phenomena (high MYC expression in T-ALL) and help aid drug development to target mechanisms unique to cancerous cells.[23][78][79]
References edit
- ^ a b c d e f g h i j k l m n o Lieberman-Aiden, E; van Berkum, NL; Williams, L; Imakaev, M; Ragoczy, T; Telling, A; Amit, I; Lajoie, BR; Sabo, PJ; Dorschner, MO; Sandstrom, R; Bernstein, B; Bender, MA; Groudine, M; Gnirke, A; Stamatoyannopoulos, J; Mirny, LA; Lander, ES; Dekker, J (9 October 2009). "Comprehensive mapping of long-range interactions reveals folding principles of the human genome". Science. 326 (5950): 289–93. Bibcode:2009Sci...326..289L. doi:10.1126/science.1181369. PMC 2858594. PMID 19815776.
- ^ a b c d Lin, Da; Hong, Ping; Zhang, Siheng; Xu, Weize; Jamal, Muhammad; Yan, Keji; Lei, Yingying; Li, Liang; Ruan, Yijun; Fu, Zhen F.; Li, Guoliang; Cao, Gang (May 2018). "Digestion-ligation-only Hi-C is an efficient and cost-effective method for chromosome conformation capture". Nature Genetics. 50 (5): 754–763. doi:10.1038/s41588-018-0111-2. ISSN 1546-1718. PMID 29700467. S2CID 13740808.
- ^ a b c d e f g h i j k l m n o p q r s t u v w x y z Kong, Siyuan; Zhang, Yubo (1 February 2019). "Deciphering Hi-C: from 3D genome to function". Cell Biology and Toxicology. 35 (1): 15–32. doi:10.1007/s10565-018-09456-2. ISSN 1573-6822. PMID 30610495. S2CID 57427743.
- ^ a b c d e f g h i j k l m n o p q r s t u v w x y z aa ab ac ad ae af ag ah ai aj ak al am an ao ap aq ar as at au av aw ax ay az ba bb bc bd be bf bg bh bi bj bk bl bm bn bo bp bq br bs bt bu bv bw bx by Belton, Jon-Matthew; McCord, Rachel Patton; Gibcus, Johan; Naumova, Natalia; Zhan, Ye; Dekker, Job (November 2012). "Hi-C: A comprehensive technique to capture the conformation of genomes". Methods. 58 (3): 268–276. doi:10.1016/j.ymeth.2012.05.001. ISSN 1046-2023. PMC 3874846. PMID 22652625.
- ^ a b Eagen, Kyle P. (June 2018). "Principles of Chromosome Architecture Revealed by Hi-C". Trends in Biochemical Sciences. 43 (6): 469–478. doi:10.1016/j.tibs.2018.03.006. ISSN 0968-0004. PMC 6028237. PMID 29685368.
- ^ a b Kim, Kyukwang; Kim, Mooyoung; Kim, Yubin; Lee, Dongsung; Jung, Inkyung (1 January 2022). "Hi-C as a molecular rangefinder to examine genomic rearrangements". Seminars in Cell & Developmental Biology. 121: 161–170. doi:10.1016/j.semcdb.2021.04.024. ISSN 1084-9521. PMID 33992531. S2CID 234746398.
- ^ a b Burren, Oliver S.; Rubio García, Arcadio; Javierre, Biola-Maria; Rainbow, Daniel B.; Cairns, Jonathan; Cooper, Nicholas J.; Lambourne, John J.; Schofield, Ellen; Castro Dopico, Xaquin; Ferreira, Ricardo C.; Coulson, Richard; Burden, Frances; Rowlston, Sophia P.; Downes, Kate; Wingett, Steven W. (2017-09-04). "Chromosome contacts in activated T cells identify autoimmune disease candidate genes". Genome Biology. 18 (1): 165. doi:10.1186/s13059-017-1285-0. ISSN 1474-760X. PMC 5584004. PMID 28870212.
- ^ a b c d Jin, Fulai; Li, Yan; Dixon, Jesse R.; Selvaraj, Siddarth; Ye, Zhen; Lee, Ah Young; Yen, Chia-An; Schmitt, Anthony D.; Espinoza, Celso; Ren, Bing (14 November 2013). "A high-resolution map of three-dimensional chromatin interactome in human cells". Nature. 503 (7475): 290–294. Bibcode:2013Natur.503..290J. doi:10.1038/nature12644. ISSN 0028-0836. PMC 3838900. PMID 24141950.
- ^ a b c d e f Dixon, JR; Selvaraj, S; Yue, F; Kim, A; Li, Y; Shen, Y; Hu, M; Liu, JS; Ren, B (11 April 2012). "Topological domains in mammalian genomes identified by analysis of chromatin interactions". Nature. 485 (7398): 376–80. Bibcode:2012Natur.485..376D. doi:10.1038/nature11082. PMC 3356448. PMID 22495300.
- ^ Sexton, Tom; Yaffe, Eitan; Kenigsberg, Ephraim; Bantignies, Frédéric; Leblanc, Benjamin; Hoichman, Michael; Parrinello, Hugues; Tanay, Amos; Cavalli, Giacomo (3 February 2012). "Three-Dimensional Folding and Functional Organization Principles of the Drosophila Genome". Cell. 148 (3): 458–472. doi:10.1016/j.cell.2012.01.010. ISSN 0092-8674. PMID 22265598. S2CID 17364610.
- ^ a b c d Dixon, Jesse R.; Jung, Inkyung; Selvaraj, Siddarth; Shen, Yin; Antosiewicz-Bourget, Jessica E.; Lee, Ah Young; Ye, Zhen; Kim, Audrey; Rajagopal, Nisha; Xie, Wei; Diao, Yarui; Liang, Jing; Zhao, Huimin; Lobanenkov, Victor V.; Ecker, Joseph R.; Thomson, James A.; Ren, Bing (February 2015). "Chromatin architecture reorganization during stem cell differentiation". Nature. 518 (7539): 331–336. Bibcode:2015Natur.518..331D. doi:10.1038/nature14222. ISSN 1476-4687. PMC 4515363. PMID 25693564.
- ^ a b c d Belaghzal, Houda; Dekker, Job; Gibcus, Johan H. (1 July 2017). "Hi-C 2.0: An optimized Hi-C procedure for high-resolution genome-wide mapping of chromosome conformation". Methods. 123: 56–65. doi:10.1016/j.ymeth.2017.04.004. ISSN 1046-2023. PMC 5522765. PMID 28435001.
- ^ a b c Lafontaine, Denis L.; Yang, Liyan; Dekker, Job; Gibcus, Johan H. (July 2021). "Hi-C 3.0: Improved Protocol for Genome-Wide Chromosome Conformation Capture". Current Protocols. 1 (7): e198. doi:10.1002/cpz1.198. ISSN 2691-1299. PMC 8362010. PMID 34286910.
- ^ a b c d e f g h i j k l m n o Rao, Suhas S. P.; Huntley, Miriam H.; Durand, Neva C.; Stamenova, Elena K.; Bochkov, Ivan D.; Robinson, James T.; Sanborn, Adrian L.; Machol, Ido; Omer, Arina D.; Lander, Eric S.; Aiden, Erez Lieberman (18 December 2014). "A 3D Map of the Human Genome at Kilobase Resolution Reveals Principles of Chromatin Looping". Cell. 159 (7): 1665–1680. doi:10.1016/j.cell.2014.11.021. ISSN 0092-8674. PMC 5635824. PMID 25497547.
- ^ a b c d e f g h i Hoffman, Elizabeth A.; Frey, Brian L.; Smith, Lloyd M.; Auble, David T. (30 October 2015). "Formaldehyde Crosslinking: A Tool for the Study of Chromatin Complexes". The Journal of Biological Chemistry. 290 (44): 26404–26411. doi:10.1074/jbc.R115.651679. ISSN 0021-9258. PMC 4646298. PMID 26354429.
- ^ a b c d e f g h i j k l m n o p q r s t u v w x y z aa ab ac ad ae af ag ah ai aj ak al am van Berkum, Nynke L.; Lieberman-Aiden, Erez; Williams, Louise; Imakaev, Maxim; Gnirke, Andreas; Mirny, Leonid A.; Dekker, Job; Lander, Eric S. (6 May 2010). "Hi-C: A Method to Study the Three-dimensional Architecture of Genomes". Journal of Visualized Experiments (39): 1869. doi:10.3791/1869. ISSN 1940-087X. PMC 3149993. PMID 20461051.
- ^ a b c d e f g h i j k l m n o p q r Niu, Longjian; Shen, Wei; Huang, Yingzhang; He, Na; Zhang, Yuedong; Sun, Jialei; Wan, Jing; Jiang, Daxin; Yang, Manyun; Tse, Yu Chung; Li, Li; Hou, Chunhui (19 July 2019). "Amplification-free library preparation with SAFE Hi-C uses ligation products for deep sequencing to improve traditional Hi-C analysis". Communications Biology. 2 (1): 267. doi:10.1038/s42003-019-0519-y. ISSN 2399-3642. PMC 6642088. PMID 31341966.
- ^ Doetsch, P W; Chan, G L; Haseltine, W A (10 May 1985). "T4 DNA polymerase (3'–5') exonuclease, an enzyme for the detection and quantitation of stable DNA lesions: the ultraviolet light example". Nucleic Acids Research. 13 (9): 3285–3304. doi:10.1093/nar/13.9.3285. ISSN 0305-1048. PMC 341235. PMID 2987881.
- ^ a b c Ma, Wenxiu; Ay, Ferhat; Lee, Choli; Gulsoy, Gunhan; Deng, Xinxian; Cook, Savannah; Hesson, Jennifer; Cavanaugh, Christopher; Ware, Carol B.; Krumm, Anton; Shendure, Jay; Blau, Carl Anthony; Disteche, Christine M.; Noble, William S.; Duan, Zhijun (January 2015). "Fine-scale chromatin interaction maps reveal the cis-regulatory landscape of human lincRNA genes". Nature Methods. 12 (1): 71–78. doi:10.1038/nmeth.3205. ISSN 1548-7105. PMC 4281301. PMID 25437436.
- ^ a b c Mifsud, Borbala; Tavares-Cadete, Filipe; Young, Alice N.; Sugar, Robert; Schoenfelder, Stefan; Ferreira, Lauren; Wingett, Steven W.; Andrews, Simon; Grey, William; Ewels, Philip A.; Herman, Bram; Happe, Scott; Higgs, Andy; LeProust, Emily; Follows, George A.; Fraser, Peter; Luscombe, Nicholas M.; Osborne, Cameron S. (June 2015). "Mapping long-range promoter contacts in human cells with high-resolution capture Hi-C". Nature Genetics. 47 (6): 598–606. doi:10.1038/ng.3286. ISSN 1546-1718. PMID 25938943. S2CID 6036717.
- ^ Cullen, Katherine E.; Kladde, Michael P.; Seyfred, Mark A. (9 July 1993). "Interaction Between Transcription Regulatory Regions of Prolactin Chromatin". Science. 261 (5118): 203–206. Bibcode:1993Sci...261..203C. doi:10.1126/science.8327891. PMID 8327891.
- ^ Zhou, Yufan; Cheng, Xiaolong; Yang, Yini; Li, Tian; Li, Jingwei; Huang, Tim H.-M.; Wang, Junbai; Lin, Shili; Jin, Victor X. (12 August 2020). "Modeling and analysis of Hi-C data by HiSIF identifies characteristic promoter-distal loops". Genome Medicine. 12 (1): 69. doi:10.1186/s13073-020-00769-8. ISSN 1756-994X. PMC 7425017. PMID 32787954.
- ^ a b c d e f g h i Díaz, Noelia; Kruse, Kai; Erdmann, Tabea; Staiger, Annette M.; Ott, German; Lenz, Georg; Vaquerizas, Juan M. (29 November 2018). "Chromatin conformation analysis of primary patient tissue using a low input Hi-C method". Nature Communications. 9 (1): 4938. Bibcode:2018NatCo...9.4938D. doi:10.1038/s41467-018-06961-0. ISSN 2041-1723. PMC 6265268. PMID 30498195.
- ^ a b c d de Souza, Natalie (September 2015). "Micro-C maps of genome structure". Nature Methods. 12 (9): 812. doi:10.1038/nmeth.3575. ISSN 1548-7105. PMID 26554092. S2CID 5765554.
- ^ a b c d Burgess, Darren J. (June 2020). "Chromosome structure at micro-scale". Nature Reviews Genetics. 21 (6): 337. doi:10.1038/s41576-020-0243-y. ISSN 1471-0064. PMID 32346116. S2CID 216560645.
- ^ a b Hsieh, Tsung-Han S.; Cattoglio, Claudia; Slobodyanyuk, Elena; Hansen, Anders S.; Rando, Oliver J.; Tjian, Robert; Darzacq, Xavier (7 May 2020). "Resolving the 3D Landscape of Transcription-Linked Mammalian Chromatin Folding". Molecular Cell. 78 (3): 539–553.e8. doi:10.1016/j.molcel.2020.03.002. ISSN 1097-2765. PMC 7703524. PMID 32213323.
- ^ a b c d e f g h i j k l m n o p q r s t u v w x y z aa ab ac ad ae af ag ah ai aj ak al am an ao ap aq ar as at au av aw ax ay az ba bb bc bd be bf Lajoie, Bryan R.; Dekker, Job; Kaplan, Noam (January 2015). "The Hitchhiker's Guide to Hi-C Analysis: Practical guidelines". Methods. 72: 65–75. doi:10.1016/j.ymeth.2014.10.031. ISSN 1046-2023. PMC 4347522. PMID 25448293.
- ^ a b c d e f g h i j k l m n o p q r s t u v w x y z aa ab ac ad ae af ag ah ai Pal, Koustav; Forcato, Mattia; Ferrari, Francesco (20 December 2018). "Hi-C analysis: from data generation to integration". Biophysical Reviews. 11 (1): 67–78. doi:10.1007/s12551-018-0489-1. ISSN 1867-2450. PMC 6381366. PMID 30570701.
- ^ a b c Forcato, Mattia; Bicciato, Silvio (2021). "Computational Analysis of Hi-C Data". Capturing Chromosome Conformation. Methods in Molecular Biology. Vol. 2157. Springer US. pp. 103–125. doi:10.1007/978-1-0716-0664-3_7. ISBN 978-1-0716-0663-6. PMID 32820401. S2CID 221219811.
{{cite book}}:|journal=ignored (help) - ^ a b c d e f g h i Gong, Haiyan; Yang, Yi; Zhang, Sichen; Li, Minghong; Zhang, Xiaotong (1 January 2021). "Application of Hi-C and other omics data analysis in human cancer and cell differentiation research". Computational and Structural Biotechnology Journal. 19: 2070–2083. doi:10.1016/j.csbj.2021.04.016. ISSN 2001-0370. PMC 8086027. PMID 33995903.
- ^ Langmead, Ben (December 2010). "Aligning Short Sequencing Reads with Bowtie". Current Protocols in Bioinformatics. 32 (1): Unit 11.7. doi:10.1002/0471250953.bi1107s32. hdl:2027.42/137758. ISSN 1934-3396. PMC 3010897. PMID 21154709.
- ^ Li, Heng; Durbin, Richard (15 July 2009). "Fast and Accurate Short Read Alignment with Burrows–Wheeler Transform". Bioinformatics. 25 (14): 1754–1760. doi:10.1093/bioinformatics/btp324. PMC 2705234. PMID 19451168.
- ^ Li, Heng (2018). "Minimap2: pairwise alignment for nucleotide sequences". Bioinformatics. 34 (18): 3094–3100. doi:10.1093/bioinformatics/bty191. PMC 6137996. PMID 29750242.
- ^ a b Imakaev, Maxim; Fudenberg, Geoffrey; McCord, Rachel Patton; Naumova, Natalia; Goloborodko, Anton; Lajoie, Bryan R.; Dekker, Job; Mirny, Leonid A. (October 2012). "Iterative correction of Hi-C data reveals hallmarks of chromosome organization". Nature Methods. 9 (10): 999–1003. doi:10.1038/nmeth.2148. ISSN 1548-7105. PMC 3816492. PMID 22941365.
- ^ a b Servant, Nicolas; Varoquaux, Nelle; Lajoie, Bryan R.; Viara, Eric; Chen, Chong-Jian; Vert, Jean-Philippe; Heard, Edith; Dekker, Job; Barillot, Emmanuel (1 December 2015). "HiC-Pro: an optimized and flexible pipeline for Hi-C data processing". Genome Biology. 16 (1): 259. doi:10.1186/s13059-015-0831-x. ISSN 1474-760X. PMC 4665391. PMID 26619908.
- ^ Hwang, Yih-Chii; Lin, Chiao-Feng; Valladares, Otto; Malamon, John; Kuksa, Pavel P.; Zheng, Qi; Gregory, Brian D.; Wang, Li-San (15 April 2015). "HIPPIE: a high-throughput identification pipeline for promoter interacting enhancer elements". Bioinformatics. 31 (8): 1290–1292. doi:10.1093/bioinformatics/btu801. ISSN 1367-4803. PMC 4393516. PMID 25480377.
- ^ Wingett, Steven; Ewels, Philip; Furlan-Magaril, Mayra; Nagano, Takashi; Schoenfelder, Stefan; Fraser, Peter; Andrews, Simon (20 November 2015). "HiCUP: pipeline for mapping and processing Hi-C data". F1000Research. 4: 1310. doi:10.12688/f1000research.7334.1. ISSN 2046-1402. PMC 4706059. PMID 26835000.
- ^ Serra, François; Baù, Davide; Goodstadt, Mike; Castillo, David; Filion, Guillaume J.; Marti-Renom, Marc A. (19 July 2017). "Automatic analysis and 3D-modelling of Hi-C data using TADbit reveals structural features of the fly chromatin colors". PLOS Computational Biology. 13 (7): e1005665. Bibcode:2017PLSCB..13E5665S. doi:10.1371/journal.pcbi.1005665. ISSN 1553-7358. PMC 5540598. PMID 28723903.
- ^ Durand, Neva C.; Shamim, Muhammad S.; Machol, Ido; Rao, Suhas S. P.; Huntley, Miriam H.; Lander, Eric S.; Aiden, Erez Lieberman (27 July 2016). "Juicer Provides a One-Click System for Analyzing Loop-Resolution Hi-C Experiments". Cell Systems. 3 (1): 95–98. doi:10.1016/j.cels.2016.07.002. ISSN 2405-4712. PMC 5846465. PMID 27467249.
- ^ Reiff, Sarah B.; Schroeder, Andrew J.; Kırlı, Koray; Cosolo, Andrea; Bakker, Clara; Lee, Soohyun; Veit, Alexander D.; Balashov, Alexander K.; Vitzthum, Carl; Ronchetti, William; Pitman, Kent M.; Johnson, Jeremy; Ehmsen, Shannon R.; Kerpedjiev, Peter; Abdennur, Nezar; Imakaev, Maxim; Öztürk, Serkan Utku; Çamoğlu, Uğur; Mirny, Leonid A.; Gehlenborg, Nils; Alver, Burak H.; Park, Peter J. (2022). "The 4D Nucleome Data Portal as a resource for searching and visualizing curated nucleomics data". Nature Communications. 13 (1): 2365. Bibcode:2022NatCo..13.2365R. doi:10.1038/s41467-022-29697-4. PMC 9061818. PMID 35501320.
- ^ Li, Heng (2013). "Aligning sequence reads, clone sequences and assembly contigs with BWA-MEM". arXiv:1303.3997 [q-bio.GN].
- ^ Zhang, H.; Song, L.; Wang, X.; Cheng, H.; Wang, C.; Meyer, C. A.; Liu, T.; Tang, M.; Aluru, S.; Yue, F.; Liu, X. S.; Li, H. (2021). "Fast alignment and preprocessing of chromatin profiles with Chromap". Nature Communications. 12 (1): 6566. Bibcode:2021NatCo..12.6566Z. doi:10.1038/s41467-021-26865-w. PMC 8589834. PMID 34772935.
- ^ Forcato, Mattia; Nicoletti, Chiara; Pal, Koustav; Livi, Carmen Maria; Ferrari, Francesco; Bicciato, Silvio (July 2017). "Comparison of computational methods for Hi-C data analysis". Nature Methods. 14 (7): 679–685. doi:10.1038/nmeth.4325. ISSN 1548-7105. PMC 5493985. PMID 28604721.
- ^ Nora, Elphège P.; Goloborodko, Anton; Valton, Anne-Laure; Gibcus, Johan H.; Uebersohn, Alec; Abdennur, Nezar; Dekker, Job; Mirny, Leonid A.; Bruneau, Benoit G. (18 May 2017). "Targeted Degradation of CTCF Decouples Local Insulation of Chromosome Domains from Genomic Compartmentalization". Cell. 169 (5): 930–944.e22. doi:10.1016/j.cell.2017.05.004. ISSN 0092-8674. PMC 5538188. PMID 28525758.
- ^ Li, Angsheng; Yin, Xianchen; Xu, Bingxiang; Wang, Danyang; Han, Jimin; Wei, Yi; Deng, Yun; Xiong, Ying; Zhang, Zhihua (15 August 2018). "Decoding topologically associating domains with ultra-low resolution Hi-C data by graph structural entropy". Nature Communications. 9 (1): 3265. Bibcode:2018NatCo...9.3265L. doi:10.1038/s41467-018-05691-7. ISSN 2041-1723. PMC 6093941. PMID 30111883.
- ^ Sauria, Michael EG; Taylor, James (14 November 2017). "QuASAR: Quality Assessment of Spatial Arrangement Reproducibility in Hi-C Data": 204438. doi:10.1101/204438. S2CID 90376810.
{{cite journal}}: Cite journal requires|journal=(help) - ^ Ramirez, Fidel; Lingg, Thomas; Toscano, Sarah; Lam, Kin Chung; Georgiev, Plamen; Chung, Ho-Ryun; Lajoie, Bryan; de Wit, Elzo; Zhan, Ye; de Laat, Wouter; Dekker, Job; Manke, Thomas; Akhtar, Asifa (1 October 2015). "High-affinity sites form an interaction network to facilitate spreading of the MSL complex across the X chromosome in Drosophila". Molecular Cell. 60 (1): 146–162. doi:10.1016/j.molcel.2015.08.024. ISSN 1097-2765. PMC 4806858. PMID 26431028.
- ^ a b Zhang, Yan; An, Lin; Xu, Jie; Zhang, Bo; Zheng, W. Jim; Hu, Ming; Tang, Jijun; Yue, Feng (21 February 2018). "Enhancing Hi-C data resolution with deep convolutional neural network HiCPlus". Nature Communications. 9 (1): 750. Bibcode:2018NatCo...9..750Z. doi:10.1038/s41467-018-03113-2. ISSN 2041-1723. PMC 5821732. PMID 29467363.
- ^ a b c Knopp, Paul; Sinkhorn, Richard (January 1967). "Concerning nonnegative matrices and doubly stochastic matrices". Pacific Journal of Mathematics. 21 (2): 343–348. doi:10.2140/pjm.1967.21.343. ISSN 0030-8730.
- ^ Cournac, Axel; Marie-Nelly, Hervé; Marbouty, Martial; Koszul, Romain; Mozziconacci, Julien (30 August 2012). "Normalization of a chromosomal contact map". BMC Genomics. 13: 436. doi:10.1186/1471-2164-13-436. ISSN 1471-2164. PMC 3534615. PMID 22935139.
- ^ Knight, Philip; Ruiz, Daniel (26 October 2012). "A fast algorithm for matrix balancing". IMA Journal of Numerical Analysis. 33 (3): 1029–1047. doi:10.1093/imanum/drs019.
- ^ a b c Raccosta, Samuele; Librizzi, Fabio; Jagger, Alistair M.; Noto, Rosina; Martorana, Vincenzo; Lomas, David A.; Irving, James A.; Manno, Mauro (January 2021). "Scaling Concepts in Serpin Polymer Physics". Materials. 14 (10): 2577. Bibcode:2021Mate...14.2577R. doi:10.3390/ma14102577. ISSN 1996-1944. PMC 8156723. PMID 34063488.
- ^ a b c Fudenberg, Geoffrey; Mirny, Leonid A (1 April 2012). "Higher-order chromatin structure: bridging physics and biology". Current Opinion in Genetics & Development. 22 (2): 115–124. doi:10.1016/j.gde.2012.01.006. hdl:1721.1/103044. ISSN 0959-437X. PMC 3697851. PMID 22360992.
- ^ Heinz, Sven; Benner, Christopher; Spann, Nathanael; Bertolino, Eric; Lin, Yin C.; Laslo, Peter; Cheng, Jason X.; Murre, Cornelis; Singh, Harinder; Glass, Christopher K. (28 May 2010). "Simple combinations of lineage-determining transcription factors prime cis-regulatory elements required for macrophage and B cell identities". Molecular Cell. 38 (4): 576–589. doi:10.1016/j.molcel.2010.05.004. ISSN 1097-2765. PMC 2898526. PMID 20513432.
- ^ Zheng, Xiaobin; Zheng, Yixian (1 May 2018). "CscoreTool: fast Hi-C compartment analysis at high resolution". Bioinformatics. 34 (9): 1568–1570. doi:10.1093/bioinformatics/btx802. ISSN 1367-4803. PMC 5925784. PMID 29244056.
- ^ de Wit, Elzo (7 February 2020). "TADs as the Caller Calls Them". Journal of Molecular Biology. 432 (3): 638–642. doi:10.1016/j.jmb.2019.09.026. ISSN 0022-2836. PMID 31654669. S2CID 204918507.
- ^ Naumova, Natalia; Imakaev, Maxim; Fudenberg, Geoffrey; Zhan, Ye; Lajoie, Bryan R.; Mirny, Leonid A.; Dekker, Job (22 November 2013). "Organization of the mitotic chromosome". Science. 342 (6161): 948–953. Bibcode:2013Sci...342..948N. doi:10.1126/science.1236083. ISSN 0036-8075. PMC 4040465. PMID 24200812.
- ^ a b c Crane, Emily; Bian, Qian; McCord, Rachel Patton; Lajoie, Bryan R.; Wheeler, Bayly S.; Ralston, Edward J.; Uzawa, Satoru; Dekker, Job; Meyer, Barbara J. (July 2015). "Condensin-driven remodelling of X chromosome topology during dosage compensation". Nature. 523 (7559): 240–244. Bibcode:2015Natur.523..240C. doi:10.1038/nature14450. ISSN 1476-4687. PMC 4498965. PMID 26030525.
- ^ a b c Filippova, Darya; Patro, Rob; Duggal, Geet; Kingsford, Carl (3 May 2014). "Identification of alternative topological domains in chromatin". Algorithms for Molecular Biology. 9 (1): 14. doi:10.1186/1748-7188-9-14. ISSN 1748-7188. PMC 4019371. PMID 24868242.
- ^ Schwarzer, Wibke; Abdennur, Nezar; Goloborodko, Anton; Pekowska, Aleksandra; Fudenberg, Geoffrey; Loe-Mie, Yann; Fonseca, Nuno A; Huber, Wolfgang; Haering, Christian; Mirny, Leonid; Spitz, Francois (2 November 2017). "Two independent modes of chromatin organization revealed by cohesin removal". Nature. 551 (7678): 51–56. Bibcode:2017Natur.551...51S. doi:10.1038/nature24281. ISSN 0028-0836. PMC 5687303. PMID 29094699.
- ^ Yan, Koon-Kiu; Lou, Shaoke; Gerstein, Mark (24 July 2017). "MrTADFinder: A network modularity based approach to identify topologically associating domains in multiple resolutions". PLOS Computational Biology. 13 (7): e1005647. Bibcode:2017PLSCB..13E5647Y. doi:10.1371/journal.pcbi.1005647. ISSN 1553-734X. PMC 5546724. PMID 28742097.
- ^ Norton, Heidi K.; Emerson, Daniel J.; Huang, Harvey; Kim, Jesi; Titus, Katelyn R.; Gu, Shi; Bassett, Danielle S.; Phillips-Cremins, Jennifer E. (February 2018). "Detecting hierarchical genome folding with network modularity". Nature Methods. 15 (2): 119–122. doi:10.1038/nmeth.4560. ISSN 1548-7105. PMC 6029251. PMID 29334377.
- ^ Malik, Laraib; Patro, Rob (September 2019). "Rich Chromatin Structure Prediction from Hi-C Data". IEEE/ACM Transactions on Computational Biology and Bioinformatics. 16 (5): 1448–1458. doi:10.1109/TCBB.2018.2851200. ISSN 1557-9964. PMID 29994683. S2CID 54563346.
- ^ a b Ou, Horng D.; Phan, Sébastien; Deerinck, Thomas J.; Thor, Andrea; Ellisman, Mark H.; O’Shea, Clodagh C. (28 July 2017). "ChromEMT: Visualizing 3D chromatin structure and compaction ninterphase and mitotic cells". Science. 357 (6349): eaag0025. doi:10.1126/science.aag0025. ISSN 0036-8075. PMC 5646685. PMID 28751582.
- ^ a b Nagano, Takashi; Lubling, Yaniv; Várnai, Csilla; Dudley, Carmel; Leung, Wing; Baran, Yael; Mendelson Cohen, Netta; Wingett, Steven; Fraser, Peter; Tanay, Amos (July 2017). "Cell-cycle dynamics of chromosomal organization at single-cell resolution". Nature. 547 (7661): 61–67. Bibcode:2017Natur.547...61N. doi:10.1038/nature23001. ISSN 1476-4687. PMC 5567812. PMID 28682332.
- ^ Bintu, Bogdan; Mateo, Leslie J.; Su, Jun-Han; Sinnott-Armstrong, Nicholas A.; Parker, Mirae; Kinrot, Seon; Yamaya, Kei; Boettiger, Alistair N.; Zhuang, Xiaowei (26 October 2018). "Super-resolution chromatin tracing reveals domains and cooperative interactions in single cells". Science. 362 (6413): eaau1783. Bibcode:2018Sci...362.1783B. doi:10.1126/science.aau1783. ISSN 0036-8075. PMC 6535145. PMID 30361340.
- ^ a b Yu, Miao; Ren, Bing (6 October 2017). "The Three-Dimensional Organization of Mammalian Genomes". Annual Review of Cell and Developmental Biology. 33 (1): 265–289. doi:10.1146/annurev-cellbio-100616-060531. ISSN 1081-0706. PMC 5837811. PMID 28783961.
- ^ Niakan, Kathy K.; Han, Jinnuo; Pedersen, Roger A.; Simon, Carlos; Pera, Renee A. Reijo (1 March 2012). "Human pre-implantation embryo development". Development. 139 (5): 829–841. doi:10.1242/dev.060426. ISSN 0950-1991. PMC 3274351. PMID 22318624.
- ^ a b c Du, Zhenhai; Zheng, Hui; Huang, Bo; Ma, Rui; Wu, Jingyi; Zhang, Xianglin; He, Jing; Xiang, Yunlong; Wang, Qiujun; Li, Yuanyuan; Ma, Jing; Zhang, Xu; Zhang, Ke; Wang, Yang; Zhang, Michael Q.; Gao, Juntao; Dixon, Jesse R.; Wang, Xiaowo; Zeng, Jianyang; Xie, Wei (July 2017). "Allelic reprogramming of 3D chromatin architecture during early mammalian development". Nature. 547 (7662): 232–235. Bibcode:2017Natur.547..232D. doi:10.1038/nature23263. ISSN 1476-4687. PMID 28703188. S2CID 4410486.
- ^ a b c Ke, Yuwen; Xu, Yanan; Chen, Xuepeng; Feng, Songjie; Liu, Zhenbo; Sun, Yaoyu; Yao, Xuelong; Li, Fangzhen; Zhu, Wei; Gao, Lei; Chen, Haojie; Du, Zhenhai; Xie, Wei; Xu, Xiaocui; Huang, Xingxu; Liu, Jiang (13 July 2017). "3D Chromatin Structures of Mature Gametes and Structural Reprogramming during Mammalian Embryogenesis". Cell. 170 (2): 367–381.e20. doi:10.1016/j.cell.2017.06.029. ISSN 0092-8674. PMID 28709003. S2CID 23974814.
- ^ Diament, Alon; Tuller, Tamir (1 June 2019). "Modeling three-dimensional genomic organization in evolution and pathogenesis". Seminars in Cell & Developmental Biology. 90: 78–93. doi:10.1016/j.semcdb.2018.07.008. ISSN 1084-9521. PMID 30030143. S2CID 51704135.
- ^ a b Vietri, Matteo; Barrington, Christopher; Henderson, Stephen; Ernst, Christina; Odom, Duncan; Tanay, Amos; Hadjur, Suzana (26 February 2015). "Comparative Hi-C Reveals that CTCF Underlies Evolution of Chromosomal Domain Architecture". Cell Reports. 10 (8): 1297–1309. doi:10.1016/j.celrep.2015.02.004. ISSN 2211-1247. PMC 4542312. PMID 25732821.
- ^ Diament, Alon; Pinter, Ron Y.; Tuller, Tamir (16 December 2014). "Three-dimensional eukaryotic genomic organization is strongly correlated with codon usage expression and function". Nature Communications. 5 (1): 5876. Bibcode:2014NatCo...5.5876D. doi:10.1038/ncomms6876. ISSN 2041-1723. PMID 25510862.
- ^ Ibn-Salem, Jonas; Muro, Enrique M.; Andrade-Navarro, Miguel A. (9 January 2017). "Co-regulation of paralog genes in the three-dimensional chromatin architecture". Nucleic Acids Research. 45 (1): 81–91. doi:10.1093/nar/gkw813. ISSN 0305-1048. PMC 5224500. PMID 27634932.
- ^ Diament, Alon; Tuller, Tamir (5 May 2017). "Tracking the evolution of 3D gene organization demonstrates its connection to phenotypic divergence". Nucleic Acids Research. 45 (8): 4330–4343. doi:10.1093/nar/gkx205. ISSN 0305-1048. PMC 5416853. PMID 28369658.
- ^ Bonev, Boyan; Cavalli, Giacomo (November 2016). "Organization and function of the 3D genome". Nature Reviews Genetics. 17 (11): 661–678. doi:10.1038/nrg.2016.112. ISSN 1471-0064. PMID 27739532. S2CID 31259189.
- ^ Chambers, Emily V.; Bickmore, Wendy A.; Semple, Colin A. (4 April 2013). "Divergence of Mammalian Higher Order Chromatin Structure Is Associated with Developmental Loci". PLOS Computational Biology. 9 (4): e1003017. Bibcode:2013PLSCB...9E3017C. doi:10.1371/journal.pcbi.1003017. ISSN 1553-7358. PMC 3617018. PMID 23592965.
- ^ a b c Kloetgen, Andreas; Thandapani, Palaniraja; Ntziachristos, Panagiotis; Ghebrechristos, Yohana; Nomikou, Sofia; Lazaris, Charalampos; Chen, Xufeng; Hu, Hai; Bakogianni, Sofia; Wang, Jingjing; Fu, Yi; Boccalatte, Francesco; Zhong, Hua; Paietta, Elisabeth; Trimarchi, Thomas; Zhu, Yixing; Van Vlierberghe, Pieter; Inghirami, Giorgio G.; Lionnet, Timothee; Aifantis, Iannis; Tsirigos, Aristotelis (April 2020). "Three-dimensional chromatin landscapes in T cell acute lymphoblastic leukemia". Nature Genetics. 52 (4): 388–400. doi:10.1038/s41588-020-0602-9. ISSN 1546-1718. PMC 7138649. PMID 32203470.
- ^ a b c Fang, Celestia; Wang, Zhenjia; Han, Cuijuan; Safgren, Stephanie L.; Helmin, Kathryn A.; Adelman, Emmalee R.; Serafin, Valentina; Basso, Giuseppe; Eagen, Kyle P.; Gaspar-Maia, Alexandre; Figueroa, Maria E.; Singer, Benjamin D.; Ratan, Aakrosh; Ntziachristos, Panagiotis; Zang, Chongzhi (15 September 2020). "Cancer-specific CTCF binding facilitates oncogenic transcriptional dysregulation". Genome Biology. 21 (1): 247. doi:10.1186/s13059-020-02152-7. ISSN 1474-760X. PMC 7493976. PMID 32933554.