
KNOWPIA
WELCOME TO KNOWPIA

Hohenau an der March 
Summary
Hohenau an der March (Czech: Cáhnov, Slovak: Cahnov) is a town in the district of Gänserndorf in the Austrian state of Lower Austria, close to Vienna and the borders with the Czech Republic and Slovakia.
Hohenau an der March | |
|---|---|
 Coat of arms | |
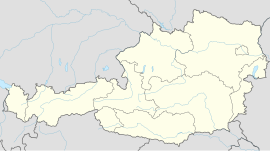 Hohenau an der March Location within Austria  Hohenau an der March Location within Lower Austria | |
| Coordinates: 48°36′N 16°54′E / 48.600°N 16.900°E | |
| Country | Austria |
| State | Lower Austria |
| District | Gänserndorf |
| Government | |
| • Mayor | Wolfgang Gaida |
| Area | |
| • Total | 23.41 km2 (9.04 sq mi) |
| Elevation | 155 m (509 ft) |
| Population (2018-01-01)[2] | |
| • Total | 2,738 |
| • Density | 120/km2 (300/sq mi) |
| Time zone | UTC+1 (CET) |
| • Summer (DST) | UTC+2 (CEST) |
| Postal code | 2273 |
| Area code | 02535 |
| Website | www.hohenau-march.at |
Geography edit
The town lies on the river Morava (March in German). It lies in the Weinviertel in Lower Austria. Only about 6.18 percent of the municipality is forested.

Climate edit
| Climate data for Hohenau an der March 1981-2010 | |||||||||||||
|---|---|---|---|---|---|---|---|---|---|---|---|---|---|
| Month | Jan | Feb | Mar | Apr | May | Jun | Jul | Aug | Sep | Oct | Nov | Dec | Year |
| Record high °C (°F) | 18.3 (64.9) |
19.3 (66.7) |
24.6 (76.3) |
27.9 (82.2) |
32.6 (90.7) |
35.6 (96.1) |
37.3 (99.1) |
38.8 (101.8) |
32.7 (90.9) |
28.4 (83.1) |
21.5 (70.7) |
16.4 (61.5) |
38.8 (101.8) |
| Mean daily maximum °C (°F) | 2.4 (36.3) |
4.8 (40.6) |
10.1 (50.2) |
16.4 (61.5) |
21.1 (70.0) |
24.1 (75.4) |
27 (81) |
26.5 (79.7) |
21.2 (70.2) |
15.3 (59.5) |
8.1 (46.6) |
3.1 (37.6) |
15 (59) |
| Daily mean °C (°F) | −1.4 (29.5) |
0 (32) |
4.3 (39.7) |
9.8 (49.6) |
14.8 (58.6) |
17.8 (64.0) |
20.1 (68.2) |
19.5 (67.1) |
14.6 (58.3) |
9.2 (48.6) |
4.1 (39.4) |
−0.2 (31.6) |
9.4 (48.9) |
| Mean daily minimum °C (°F) | −4.5 (23.9) |
−3.6 (25.5) |
0.3 (32.5) |
3.9 (39.0) |
8.5 (47.3) |
11.4 (52.5) |
13.3 (55.9) |
13.3 (55.9) |
9.6 (49.3) |
5.1 (41.2) |
1.1 (34.0) |
−2.9 (26.8) |
4.6 (40.3) |
| Record low °C (°F) | −29.3 (−20.7) |
−24 (−11) |
−16.3 (2.7) |
−6.5 (20.3) |
−2.3 (27.9) |
1.6 (34.9) |
4.3 (39.7) |
4.4 (39.9) |
−0.6 (30.9) |
−8.9 (16.0) |
−17.3 (0.9) |
−23.5 (−10.3) |
−29.3 (−20.7) |
| Average precipitation mm (inches) | 25 (1.0) |
24 (0.9) |
30 (1.2) |
28 (1.1) |
52 (2.0) |
54 (2.1) |
59 (2.3) |
50 (2.0) |
48 (1.9) |
27 (1.1) |
35 (1.4) |
32 (1.3) |
463 (18.2) |
| Average relative humidity (%) (at 14:00) | 75.3 | 66 | 56.7 | 46.5 | 49.2 | 49.8 | 45.5 | 47 | 52.4 | 58.3 | 71.8 | 78.4 | 58.1 |
| Source: Central Institute for Meteorology and Geodynamics[3] | |||||||||||||
References edit
- ^ "Dauersiedlungsraum der Gemeinden Politischen Bezirke und Bundesländer - Gebietsstand 1.1.2018". Statistics Austria. Retrieved 10 March 2019.
- ^ "Einwohnerzahl 1.1.2018 nach Gemeinden mit Status, Gebietsstand 1.1.2018". Statistics Austria. Retrieved 9 March 2019.
- ^ "Klimamittel - ZAMG" (in German). Central Institute for Meteorology and Geodynamics. Retrieved 31 May 2020.
External links edit
Wikimedia Commons has media related to Hohenau an der March.