
KNOWPIA
WELCOME TO KNOWPIA

Hull (provincial electoral district) 
Summary
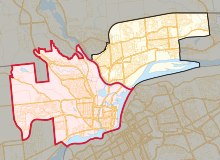
Hull is provincial electoral riding located in the Outaouais region of Quebec, Canada. It includes the entire Hull sector of the city of Gatineau, as well as some additional territory.
 Location in Gatineau | |||
| Coordinates: | 45°26′31″N 75°45′07″W / 45.442°N 75.752°W | ||
| Provincial electoral district | |||
| Legislature | National Assembly of Quebec | ||
| MNA |
Coalition Avenir Québec | ||
| District created | 1919 | ||
| First contested | 1919 | ||
| Last contested | 2022 | ||
| Demographics | |||
| Population (2006) | 68,374 | ||
| Electors (2012)[1] | 51,226 | ||
| Area (km²)[2] | 53.8 | ||
| Pop. density (per km²) | 1,270.9 | ||
| Census division(s) | Gatineau (part) | ||
| Census subdivision(s) | Gatineau (part) | ||
It was created for the 1919 election from part of the Ottawa electoral district.
In the change from the 2001 to the 2011 electoral map, it gained some territory from Pontiac and also a very small amount of territory from Gatineau electoral district.
Members of the Legislative Assembly / National Assembly edit
| Legislature | Years | Member | Party | |
|---|---|---|---|---|
| Riding created from Ottawa | ||||
| 15th | 1919–1923 | Joseph Caron | Liberal | |
| 16th | 1923–1927 | Joseph-Roméo Lafond | ||
| 17th | 1927–1931 | Aimé Guertin | Conservative | |
| 18th | 1931–1935 | |||
| 19th | 1935–1936 | Alexis Caron | Liberal | |
| 20th | 1936–1939 | Alexandre Taché | Union Nationale | |
| 21st | 1939–1944 | Alexis Caron | Liberal | |
| 22nd | 1944–1948 | Alexandre Taché | Union Nationale | |
| 23rd | 1948–1952 | |||
| 24th | 1952–1956 | |||
| 25th | 1956–1960 | Oswald Parent | Liberal | |
| 26th | 1960–1962 | |||
| 27th | 1962–1966 | |||
| 28th | 1966–1970 | |||
| 29th | 1970–1973 | |||
| 30th | 1973–1976 | |||
| 31st | 1976–1981 | Jocelyne Ouellette | Parti Québécois | |
| 32nd | 1981–1985 | Gilles Rocheleau | Liberal | |
| 33rd | 1985–1988 | |||
| 34th | 1989–1994 | Robert LeSage | ||
| 35th | 1994–1998 | |||
| 36th | 1998–2003 | Roch Cholette | ||
| 37th | 2003–2007 | |||
| 38th | 2007–2008 | |||
| 39th | 2008–2012 | Maryse Gaudreault | ||
| 40th | 2012–2014 | |||
| 41st | 2014–2018 | |||
| 42nd | 2018–2022 | |||
| 43rd | 2022–Present | Suzanne Tremblay | Coalition Avenir Québec | |
Election results edit
| 2022 Quebec general election | ||||||||
|---|---|---|---|---|---|---|---|---|
| Party | Candidate | Votes | % | ±% | ||||
| Coalition Avenir Québec | Suzanne Tremblay | 11,060 | 34.64 | +8.20 | ||||
| Liberal | Maryse Gaudreault | 8,276 | 25.92 | -7.84 | ||||
| Québec solidaire | Mathieu Perron-Dufour | 6,623 | 20.75 | +2.25 | ||||
| Parti Québécois | Camille Pellerin-Forget | 3,122 | 9.78 | -3.82 | ||||
| Conservative | Lise Couture | 2,189 | 6.86 | +5.40 | ||||
| Green | Rachid Jemmah | 655 | 2.05 | -1.48 | ||||
| Total valid votes | 31,925 | 98.84 | ||||||
| Total rejected ballots | 375 | 1.16 | -0.14 | |||||
| Turnout | 32,300 | 57.94 | +0.31 | |||||
| Electors on the lists | 55,751 | |||||||
| Coalition Avenir Québec gain from Liberal | Swing | +8.02 | ||||||
| 2018 Quebec general election | ||||||||
|---|---|---|---|---|---|---|---|---|
| Party | Candidate | Votes | % | ±% | ||||
| Liberal | Maryse Gaudreault | 10,519 | 33.76 | -21.41 | ||||
| Coalition Avenir Québec | Rachel Bourdon | 8,238 | 26.44 | +15.51 | ||||
| Québec solidaire | Benoit Renaud | 5,764 | 18.50 | +7.45 | ||||
| Parti Québécois | Marysa Nadeau | 4,238 | 13.6 0 | -8.24 | ||||
| Green | Patricia Pilon | 1,099 | 3.53 | |||||
| New Democratic | Nichola St-Jean | 721 | 2.31 | |||||
| Conservative | Jean-Philippe Chaussé | 454 | 1.46 | |||||
| Citoyens au pouvoir | Marco Jetté | 69 | 0.22 | |||||
| Marxist–Leninist | Pierre Soublière | 56 | 0.18 | -0.26 | ||||
| Total valid votes | 31,158 | 98.70 | ||||||
| Total rejected ballots | 411 | 1.30 | -0.28 | |||||
| Turnout | 31,569 | 57.62 | -6.22 | |||||
| Eligible voters | 54,787 | |||||||
| Liberal hold | Swing | -18.46 | ||||||
Source(s)
"Rapport des résultats officiels du scrutin". Élections Québec. | ||||||||
| 2014 Quebec general election | ||||||||
|---|---|---|---|---|---|---|---|---|
| Party | Candidate | Votes | % | ±% | ||||
| Liberal | Maryse Gaudreault | 18,213 | 55.17 | +15.69 | ||||
| Parti Québécois | Gilles Aubé | 7,209 | 21.84 | –10.24 | ||||
| Québec solidaire | Benoit Renaud | 3,647 | 11.05 | +3.11 | ||||
| Coalition Avenir Québec | Jean Bosco Citegetse | 3,609 | 10.93 | –5.02 | ||||
| Option nationale | Eid Harb | 189 | 0.57 | –0.29 | ||||
| Marxist–Leninist | Gabriel Girard Bernier | 146 | 0.44 | +0.22 | ||||
| Total valid votes | 33,013 | |||||||
| Liberal hold | Swing | +12.96 | ||||||
| 2012 Quebec general election | ||||||||
|---|---|---|---|---|---|---|---|---|
| Party | Candidate | Votes | % | ±% | ||||
| Liberal | Maryse Gaudreault | 13,179 | 39.48 | -11.79 | ||||
| Parti Québécois | Gilles Aubé | 10,708 | 32.08 | -1.10 | ||||
| Coalition Avenir Québec | Étienne Boulrice | 5,323 | 15.95 | +15.95 | ||||
| Québec solidaire | Bill Clennett | 2,651 | 7.94 | -0.83 | ||||
| Green | Jozyam Ilsa Fontaine | 781 | 2.34 | +2.34 | ||||
| Option nationale | Mikaël St-Louis | 287 | 0.86 | +0.86 | ||||
| Parti nul | Marc Fiset | 260 | 0.78 | +0.78 | ||||
| Quebec Citizens' Union | Kamal Maghri | 119 | 0.36 | +0.36 | ||||
| Marxist–Leninist | Gabriel Girard Bernier | 72 | 0.22 | -0.21 | ||||
| Total valid votes | 33,380 | – | ||||||
| Total rejected ballots | 320 | – | ||||||
| Turnout | 65.23 | |||||||
| Electors on the lists | 51,663 | – | ||||||
| 2008 Quebec general election | ||||||||
|---|---|---|---|---|---|---|---|---|
| Party | Candidate | Votes | % | |||||
| Liberal | Maryse Gaudreault | 11,651 | 51.27 | |||||
| Parti Québécois | Gilles Aubé | 7,541 | 33.18 | |||||
| Québec solidaire | Bill Clennett | 1,994 | 8.77 | |||||
| Action démocratique | Renée Gagné | 1,309 | 5.76 | |||||
| Parti indépendantiste | Jean-Roch Villemaire | 134 | 0.59 | |||||
| Marxist–Leninist | Gabriel Girard-Bernier | 97 | 0.43 | |||||
| Total valid votes | 22,726 | 100.00 | ||||||
| Rejected and declined votes | 317 | |||||||
| Turnout | 23,043 | 47.72 | ||||||
| Electors on the lists | 48,290 | |||||||
| Source: Official Results, Government of Quebec | ||||||||
| Party | Candidate | Votes | % | ±% | |
|---|---|---|---|---|---|
| Liberal | Maryse Gaudreault | 7,403 | 45.21 | +2.68 | |
| Parti Québécois | Gilles Aubé | 5,559 | 33.95 | +10.02 | |
| Québec solidaire | Bill Clennett | 1,589 | 9.70 | +1.77 | |
| Green | Brian Gibb | 1,185 | 7.24 | -1.09 | |
| Action démocratique | Jean-Philip Ruel | 529 | 3.23 | -13.83 | |
| Parti indépendantiste | Jean-Roch Villemaire | 111 | 0.68 | – | |
| 2007 Quebec general election | ||||||||
|---|---|---|---|---|---|---|---|---|
| Party | Candidate | Votes | % | ±% | ||||
| Liberal | Roch Cholette | 12,643 | 42.53 | |||||
| Parti Québécois | Marcel Painchaud | 7,115 | 23.93 | |||||
| Action démocratique | François Lizotte | 5,071 | 17.06 | |||||
| Green | Mélanie Perreault | 2,476 | 8.33 | – | ||||
| Québec solidaire | Bill Clennett | 2,358 | 7.93 | |||||
| Marxist–Leninist | Gabriel Girard-Bernier | 67 | 0.23 | |||||
| Total valid votes | 29,730 | 100.00 | ||||||
| Rejected and declined votes | 237 | |||||||
| Turnout | 29,967 | 61.26 | ||||||
| Electors on the lists | 48,915 | |||||||
| Party | Candidate | Votes | % | ±% | |
|---|---|---|---|---|---|
| Liberal | Roch Cholette | 16262 | 57.25 | -2.05 | |
| Parti Québécois | Raphael J. Dery | 7,234 | 25.47 | -6.55 | |
| Action démocratique | Jean-Francois Larue | 3,663 | 12.90 | +6.22 | |
| UFP | Denise Veilleux | 677 | 2.38 | - | |
| Bloc Pot | Stephane Salko | 305 | 1.07 | - | |
| Independent | Maxime Gauld | 155 | 0.55 | - | |
| Marxist–Leninist | Benoit Legros | 72 | 0.25 | 0.00 | |
| Independent | Gheorghe Irimia | 37 | 0.13 | - | |
| Party | Candidate | Votes | % | ±% | |
|---|---|---|---|---|---|
| Liberal | Roch Cholette | 18,873 | 59.30 | +2.74 | |
| Parti Québécois | Jacques Dupont | 10,191 | 32.02 | -9.10 | |
| Action démocratique | Mark Buzan | 2,126 | 6.68 | - | |
| Socialist Democracy | Marc Bonhomme | 291 | 0.91 | - | |
| Natural Law | Rita Bouchard | 266 | 0.84 | - | |
| Marxist–Leninist | Mathieu-Henri Jetté | 78 | 0.25 | -0.02 | |
| Independent | Gheorghe Irimia | 37 | 0.13 | - | |
| 1995 Quebec referendum | |||
|---|---|---|---|
| Side | Votes | % | |
| Non | 28,553 | 69.73 | |
| Oui | 12,394 | 30.27 | |
| 1994 Quebec general election | ||||||||
|---|---|---|---|---|---|---|---|---|
| Party | Candidate | Votes | % | |||||
| Liberal | Robert LeSage | 19,184 | 56.56 | |||||
| Parti Québécois | Michel Légère | 13,947 | 41.12 | |||||
| Lemon | Denis Patenaude | 452 | 1.33 | |||||
| Natural Law | Michel Dubois | 231 | 0.68 | |||||
| Commonwealth of Canada | Harold Quesnel | 56 | 0.17 | |||||
| Marxist–Leninist | Françoise Roy | 46 | 0.14 | |||||
| Total valid votes | 33,916 | |||||||
| Rejected and declined votes | 291 | |||||||
| Turnout | 34,207 | 78.33 | ||||||
| Electors on the lists | 43,670 | |||||||
| 1992 Charlottetown Accord referendum | |||
|---|---|---|---|
| Side | Votes | % | |
| Oui | 18,979 | 56.44 | |
| Non | 14,649 | 43.56 | |
| 1989 Quebec general election | ||||||||
|---|---|---|---|---|---|---|---|---|
| Party | Candidate | Votes | % | |||||
| Liberal | Robert LeSage | 13,980 | 55.25 | |||||
| Parti Québécois | Marcel Villeneuve | 9,434 | 37.29 | |||||
| Unity | Glen E.P. Kealey | 751 | 2.97 | |||||
| New Democratic | Charles Rheault | 673 | 2.66 | |||||
| Lemon | Denis Patenaude | 391 | 1.55 | |||||
| Marxist–Leninist | Pierre Soublière | 72 | 0.28 | |||||
| Total valid votes | 25,301 | 100.00 | ||||||
| Rejected and declined votes | 279 | |||||||
| Turnout | 25,580 | 62.23 | ||||||
| Electors on the lists | 41,107 | |||||||
| Quebec provincial by-election, May 29, 1989 | ||||||||
|---|---|---|---|---|---|---|---|---|
| Party | Candidate | Votes | % | ±% | ||||
| Liberal | Robert LeSage | 9,223 | 67.16 | |||||
| Parti Québécois | Paul Lemaire | 4,510 | 32.84 | |||||
| Total valid votes | 13,733 | 100.00 | ||||||
| Rejected and declined votes | 291 | |||||||
| Turnout | 14,024 | 35.46 | ||||||
| Electors on the lists | 39,544 | |||||||
| Source: Official Results, Government of Quebec | ||||||||
| 1981 Quebec general election | ||||||||
|---|---|---|---|---|---|---|---|---|
| Party | Candidate | Votes | % | ±% | ||||
| Liberal | Gilles Rocheleau | 15,572 | 49.76 | |||||
| Parti Québécois | Jocelyne Ouellette | 15,116 | 48.30 | |||||
| Union Nationale | Joe McGovern | 263 | 0.84 | – | ||||
| Workers | Gilles Bourque | 153 | 0.49 | |||||
| Independent | Gilles Bégin | 96 | 0.31 | |||||
| Communist | Marc Bonhomme | 59 | 0.19 | |||||
| Marxist–Leninist | Pierre Soublière | 35 | 0.11 | |||||
| Total valid votes | 31,294 | 100.00 | ||||||
| Rejected and declined votes | 530 | |||||||
| Turnout | 31,824 | 80.19 | ||||||
| Electors on the lists | 39,686 | |||||||
References edit
- ^ http://www.electionsquebec.qc.ca/english/provincial/electoral-map/general-information-on-the-provincial-electoral-divisions-2011.php?bsq=561§ion=population [dead link]
- ^ http://www.electionsquebec.qc.ca/english/provincial/electoral-map/general-information-on-the-provincial-electoral-divisions-2011.php?bsq=561§ion=superficie [dead link]
External links edit
- Information
- Elections Quebec
- Election results
- Election results (National Assembly)
- Maps
- 2011 map (PDF)
- 2001 map (Flash)
- 2001–2011 changes (Flash)
- 1992–2001 changes (Flash)
- Electoral map of Outaouais region
- Quebec electoral map, 2011