The results of the analyser identify the type of vision defect. Therefore, it provides information regarding the location of any disease processes or lesion(s) throughout the visual pathway. This guides and contributes to the diagnosis of the condition affecting the patient's vision. These results are stored and used for monitoring the progression of vision loss and the patient's condition.[2]
Medical usesedit
The analyser can be used for screening, monitoring and assisting in the diagnosis of certain conditions. There are numerous testing protocols to select, based on the purpose. The first number denotes the extent of the field measured on the temporal side, from the centre of fixation, in degrees. The '-2' represents the pattern of the points tested.[3] They include:
10-2: Measures 10 degrees temporally and nasally and tests 68 points. Used for macula, retinal and neuro-ophthalmic conditions and advanced glaucoma[4]
24-2: Measures 24 degrees temporally and 30 degrees nasally and tests 54 points. Used for neuro-ophthalmic conditions and general screening[5] as well as early detection of glaucoma[6][7]
30-2: Measures 30 degrees temporally and nasally and tests 76 points. Used for general screening, early glaucoma and neurological conditions[6]
The above tests can be performed in either SITA-Standard or SITA-Fast. SITA-Fast is a quicker method of testing. It produces similar results compared to SITA-Standard, however repeatability is questionable and it is slightly less sensitive[8][9]
There are additional tests for more specific purposes such as the following:
Esterman – Used to test the functionality of a patient's vision to ensure they are safe to drive, as requested by VicRoads, Australia[10][11]
SITA SWAP: Short Wavelength Automated Perimetry (SWAP) is used for detection of early glaucomatous loss[5]
Method of assessmentedit
Figure 2 - Chin Rest and Lens Holder
The analyser test takes approximately 5–8 minutes, excluding patient set up. There are multiple steps which need to be done before commencement of the test to ensure reliable results are attained.
The test type and eye are firstly selected and the patient's details are entered, including their refractive error. The analyser will provide a lens strength and type (either spherical and/or cylindrical), if required for the test. In these instances, wire-rimmed trial lenses are generally used, with the cylindrical lens placed closest to the patient so the axis is easily read. The clinician can alter the fixation targets as per necessary (see Fixation Targets for advice).[12]
Before putting the patient onto the machine, the patient is instructed to maintain fixation on the central target and is given a buzzer to only press when they see a light stimulus. It is not possible to see every light and some lights appear brighter/duller and slower/faster than others. The eye not being tested is patched and the room lights are dimmed prior to commencement of the test.[12]
The patient is positioned appropriately and comfortably against the forehead rest and chin rest. Minor adjustments to the head position are made to centre the pupil on the display screen to allow eye monitoring throughout the test. The lens holder should be as close to the patient's eye as possible to avoid artefacts (see Disadvantages for possible artefacts).
It is important for the patient to blink normally, relax and maintain concentration throughout the test. This will increase the reliability of results.[12]
Figure 3 - Fixation targets left: central, middle: small diamond, right: large diamond
How it worksedit
The analyser projects a series of white light stimuli of varying intensities (brightness), throughout a uniformly illuminated bowl. The patient uses a handheld button that they press to indicate when they see a light. This assesses the retina's ability to detect a stimulus at specific points within the visual field. This is called retinal sensitivity and is recorded in 'decibels' (dB).[1]
The analyser currently utilises the Swedish Interactive Thresholding Algorithm (SITA); a formula which allows the fastest and most accurate visual field assessment to date. Results are then compared against an age-matched database which highlights unusual and suspicious vision loss, potentially caused by pathology.[8]
Fixation targetsedit
There are different targets a patient can fixate on during the test. They are chosen on the basis of the patient's conditions.[12]
Central target: Yellow light in the bowl's centre
Small diamond: For patients who cannot see the central target such as those with macular degeneration. The patient looks into the centre of the four lights
Large diamond: For patients who cannot see the above two[12]
Interpreting resultsedit
Reliability indicesedit
Issues of reliability are critical in result interpretation. These include, but not limited to, the patient losing concentration, closing their eyes or pressing the buzzer too frequently. Monitoring fixation is made visible via the display screen and gaze tracker, located at the bottom of the printout. The degree of reliability is determined by the reliability indices located on the printout (Fig. 4). These are assessed first and allow the examiner to determine if the end results are reliable. These indices include:
Fixation losses: Recorded when a patient responds to a stimulus that is projected on to area of their blind spot. Fixation losses exceeding 20%, are denoted with an 'XX' next to the score, and deems results unreliable[12]
False positives: Recorded when a patient responds when there is no stimulus present. This patient is often referred to as 'buzzer happy'. False positives exceeding 15% are denoted with an 'XX' and results are considered unreliable. This may indicate that the patient is anxious and concerned about missing targets[12]
False negatives: Recorded when a patient does not respond to brighter stimuli where a duller stimulus has already been seen. High false negative scores indicate that the patient is fatigued, inattentive, a malingerer or has genuine significant visual field loss.[12] Literature presents various percentages regarding reliability. However, majority of the literature defines that false negatives exceeding approximately 30% deem results unreliable.[13][14][15]
Plotsedit
Figure 4 - Analyser Printout 1: Reliability Indices 2: Numerical Display 3: Grey Scale 4: Total Deviation 5: Probability Display 6: Pattern Deviation 7: Global Indices 8: Glaucoma Hemifield Test 9: Visual Field Index
After reliability is determined, the remaining data is assessed.
Numerical displayedit
The numerical display represents raw values of patient's retinal sensitivity at specific retinal points in dB. Higher numbers equate to higher retinal sensitivities. Sensitivity is greatest in the central field and decreases towards the periphery. Normal values are approximately 30 dB while recorded values of <0 dB equate to no sensitivity measured.[16]
Grey scaleedit
The grey scale is a graphical representation of the numerical display, allowing for easy interpretation of the field loss. Lower sensitivities are indicated by darker areas and higher sensitivities are represented with a lighter tone.[3] This scale is used to demonstrate vision changes to the patient but is not used for diagnostic purposes.
Total deviationedit
The numerical total demonstrates the difference between measured values and population age-norm values at specific retinal points.[3]
Negative values indicate lower than normal sensitivity
The statistical display (located below the numerical total) demonstrates the percentage of the normal population who measure below the patient's value at a specific retinal point. The probability display provides this percentage a key for interpreting the statistical display.[3] For example, the darkest square in the key represents that <0.5% of the population would also attain this result, indicating that the vision loss is extensive. The total deviation plots highlight diffuse vision loss (i.e. the total departure from the age-norm).[17]
Pattern deviationedit
The pattern deviation provides a numerical total and statistical display as the total deviation plot. However, it accounts for general reductions of vision caused by media opacities (e.g. cataract), uncorrected refractive error, reductions in sensitivity due to age and pupil miosis. This highlights focal loss only (i.e. vision loss suspected from only pathological processes).[16] Therefore, this is the main plot referred to when making a diagnosis. The pattern deviation plot is generally lighter than the total deviation because of the factors accounted for.
Global indicesedit
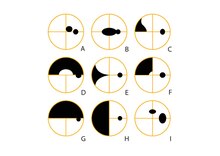
Figure 5 - Types of Visual Field Defects (right eye) A: Central scotoma B: Centrocaecal scotoma C: Nasal Step D: Superior Arcuate E: Nasal Wedge defect F: Superior Nasal quadrantanopia G: Superior Altitudinal H: Nasal hemianopia I: Enlarged Blind Spot with Paracentral scotoma located 15 degrees superiorly
These provide a statistical summary of the field with one number. Although not used for initial diagnosis, they are essential for monitoring glaucoma progression.[3] They include:
Mean deviation (MD): Derived from the total deviation and represents the overall mean departure from the age-corrected norm.[18] A negative value indicates field loss, while a positive value indicates that the field is above average. A P value is provided if the global indices are abnormal. It provides a statistical representation of the population. For example, P <2% means that less than 2% of the population have vision loss worse than measured[19]
Pattern standard deviation (PSD): Derived from the pattern deviation and thus highlights focal loss only. A high PSD, indicating irregular vision, is therefore a more useful indicator of glaucomatous progression, than the MD[3]
Glaucoma hemifield testedit
The glaucoma hemifield test (GHT) provides assessment of the visual field where glaucomatous damage is often seen. It compares five corresponding and mirrored areas in the superior and inferior visual fields.[3][20] The result of either 'Outside Normal Limits' (significant difference in superior and inferior fields), 'Borderline' (suspicious differences) or 'Within Normal Limits' (no differences) is only considered when the patient has, or is a suspect for, glaucoma.[20] This is only available in 30-2 and 24-2 analyser protocol.[3]
Visual field indexedit
The visual field index (VFI) reflects retinal ganglion cell loss and function, as a percentage, with central points weighted more.[21]
It is expressed as a percentage of visual function; with 100% being a perfect age-adjusted visual field and 0% represents a perimetrically blind field. The pattern deviation probability plot (or total deviation probability plot when MD is worse than -20 dB) is used to identify abnormal points and age corrected sensitivity at each point is calculated using total deviation numerical map. VFI is a reliable index on which glaucomatous visual field severity staging can be based.[22]
The shaded pattern of vision loss provided on the pattern deviation plot allows for diagnosis of the type of vision loss present. This contributes to other clinical findings in the diagnosis of certain conditions. The types of vision loss and associated conditions are not described in the extent of this article, however Figure 5 provides typical examples of visual field loss seen. Refer to #See also for more information.
Advantages and disadvantagesedit
Advantagesedit
Provides a comprehensive visual field assessment and ensures reliable results[12]
Compares patient's data to age-matched populations[12]
Figure 6 - Artefacts (right eye) A: Aphakia B: Rim artefact C: Chin slip D: Lens position E: Corneal opacity F: Keratoconus G: Ptosis H: Pupil Miosis - 1mm I: Pupil Miosis - 3mmCan be used for patients who are wheelchair users, hearing impaired, have postural and fixation problems and/or very low visual acuity[12]
Provides a baseline measurement
Simple for the examiner to perform and interpret
Disadvantagesedit
Requires a higher level of patient understanding and concentration compared to other visual field tests[9]
Time-consuming
Learning effect: new patients improve as more tests are performed due to understanding of the test conditions. Consider the third test as the baseline result[23]
Potential for artefacts (i.e. uncharacteristic vision loss) (fig. 6). Below is a list of possible artefacts and a representation of how they may appear. These can however, be managed with correct patient setup.
Uncorrected refractive error and aphakia cause significant decrease in visual field sensitivity[3]
^ abLanders, John; Sharma, Alok; Goldberg, Ivan; Graham, Stuart L (February 2010). "A comparison of visual field sensitivities between the Medmont automated perimeter and the Humphrey field analyzer". Clinical & Experimental Ophthalmology. 38 (3): 273–276. doi:10.1111/j.1442-9071.2010.02246.x. PMID 20447123. S2CID 9446504.
^Kedar, Sachin; Ghate, Deepta; Corbett, JamesJ (2011). "Visual fields in neuro-ophthalmology". Indian Journal of Ophthalmology. 59 (2): 103–109. doi:10.4103/0301-4738.77013. PMC3116538. PMID 21350279.
^ abcdefghijklmKanski, J. J.; Bowling, B. (2011). Clinical Ophthalmology. Edinburgh: Elsevier Saunders.
^Asaoka, Ryo; Vavvas, Demetrios (20 June 2014). "Mapping Glaucoma Patients' 30-2 and 10-2 Visual Fields Reveals Clusters of Test Points Damaged in the 10-2 Grid That Are Not Sampled in the Sparse 30-2 Grid". PLOS ONE. 9 (6): e98525. Bibcode:2014PLoSO...998525A. doi:10.1371/journal.pone.0098525. PMC4064971. PMID 24950300.
^ abKhoury, Johnny, M.; Donahue, Sean, P.; Lavin, Patric, J.; Tsai, James (1999). "Comparison of 24-2 and 30-2 Perimetry in Glaucomatous and Nonglaucomatous Optic Neuropathies". Journal of Neuro-Ophthalmology. 19 (2): 100–108. doi:10.1097/00041327-199906000-00004. PMID 10380130.{{cite journal}}: CS1 maint: multiple names: authors list (link)
^ abNouri-Mahdavi, Kouros (December 2014). "Selecting visual field tests and assessing visual field deterioration in glaucoma". Canadian Journal of Ophthalmology. 49 (6): 497–505. doi:10.1016/j.jcjo.2014.10.002. PMID 25433738.
^Huang, Charles Q.; Carolan, James; Redline, Daniel; Taravati, Parisa; Woodward, Kimberly R.; Johnson, Chris A.; Wall, Michael; Keltner, John L. (1 March 2008). "Humphrey Matrix Perimetry in Optic Nerve and Chiasmal Disorders: Comparison with Humphrey SITA Standard 24-2". Investigative Ophthalmology & Visual Science. 49 (3): 917–23. doi:10.1167/iovs.07-0241. PMID 18326712.
^ abBengtsson, Boel; Olsson, Jonny; Heijl, Anders; Rootzén, Holger (27 May 2009). "A new generation of algorithms for computerized threshold perimetry, SITA". Acta Ophthalmologica Scandinavica. 75 (4): 368–375. doi:10.1111/j.1600-0420.1997.tb00392.x. PMID 9374242.
^ abSzatmáry, Gabriella (1 September 2002). "Can Swedish Interactive Thresholding Algorithm Fast Perimetry Be Used as an Alternative to Goldmann Perimetry in Neuro-ophthalmic Practice?". Archives of Ophthalmology. 120 (9): 1162–1173. doi:10.1001/archopht.120.9.1162. PMID 12215089.
^"Vic Driving Vision Standards". Optometry Australia. Archived from the original on 2016-04-18.
^"Visual impairment". VicRoads. State Government of Victoria. 2015. Archived from the original on 2019-02-28.
^ abcdefghijklArtes, Paul H (2012). Humphrey Field Analyzer II-i series User Manual. Carl Zeiss Meditec.
^Bengtsson, B; Heijl, A (2000). "False-negative responses in glaucoma perimetry: indicators of patient performance or test reliability?". Investigative Ophthalmology and Visual Science. 41 (8): 2201–2204. PMID 10892863.
^McKendrick, Allison M.; Denniss, Jonathan; Turpin, Andrew (August 2014). "Response times across the visual field: Empirical observations and application to threshold determination". Vision Research. 101: 1–10. doi:10.1016/j.visres.2014.04.013. PMID 24802595.
^Johnson, Chris A; Keltner, John L; Cello, Kimberly E; Edwards, Mary; Kass, Michael A; Gordon, Mae O; Budenz, Donald L; Gaasterland, Douglas E; Werner, Elliot (March 2002). "Baseline visual field characteristics in the ocular hypertension treatment study". Ophthalmology. 109 (3): 432–437. doi:10.1016/S0161-6420(01)00948-4. PMID 11874743.
^ abWyatt, Harry J.; Dul, Mitchell W.; Swanson, William H. (March 2007). "Variability of visual field measurements is correlated with the gradient of visual sensitivity". Vision Research. 47 (7): 925–936. doi:10.1016/j.visres.2006.12.012. PMC2094527. PMID 17320924.
^Cubbidge, R (2012). "Essentials of visual field assessment". The Optician. 243 (6356): 14–16. ProQuest 1027770159.
^Chen, Yi-Hao; Wu, Jian-Nan; Chen, Jiann-Torng; Lu, Da-Wen (2008). "Comparison of the Humphrey Field Analyser and Humphrey Matrix Perimeter for the Evaluation of Glaucoma Patients". Ophthalmologica. 222 (6): 400–407. doi:10.1159/000154203. PMID 18781091. S2CID 38153319.
^Stamper, Robert L; Lieberman, Marc F; Drake, Michael V (2009). Becker-Shaffer's diagnosis and therapy of the glaucomas (8th ed.). [Edinburgh]: Mosby/Elsevier. ISBN 978-0-323-02394-8.
^ abIshiyama, Y.; Murata, H.; Mayama, C.; Asaoka, R. (11 November 2014). "An Objective Evaluation of Gaze Tracking in Humphrey Perimetry and the Relation With the Reproducibility of Visual Fields: A Pilot Study in Glaucoma". Investigative Ophthalmology & Visual Science. 55 (12): 8149–8152. doi:10.1167/iovs.14-15541. PMID 25389198.
^Horton, M. (2015). "10 tips for improving visual fields: perimetry may seem like second nature, but these recommendations can help you obtain better results by refining your understanding of the technology". Review of Optometry. 152 (4): 62.
^Kuzhuppilly N, Patil S, Dev S, Deo A. Reliability of Visual Field Index in Staging Glaucomatous Visual Field Damage. Journal of Clinical & Diagnostic Research. 2018 Jun 1;12(6): NC05-NC08
^Saigal, Rahul. "Learning Effects and Artefacts in Automated Perimetry" (PDF). Association Of Optometry Ireland. Archived from the original (PDF) on 2015-10-04. Retrieved 2015-09-21.