


Summary
Hunt County is a county in the U.S. state of Texas. As of the 2020 census, its population was 99,956.[1] Its county seat is Greenville.[2] The county is named for Memucan Hunt, Jr., the first Republic of Texas Minister to the United States from 1837 to 1838 and the third Texas Secretary of the Navy from 1838 to 1839.[3] Hunt County is located in Northeast Texas, at the eastern edge of the Dallas/Fort Worth Metroplex and the western edge of East Texas. Hunt County is part of the Dallas-Fort Worth-Arlington metropolitan statistical area.
Hunt County | |
|---|---|
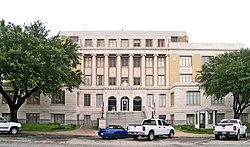 The Hunt County Courthouse in Greenville | |
 Location within the U.S. state of Texas | |
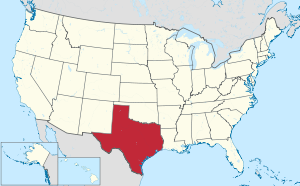 Texas's location within the U.S. | |
| Coordinates: 33°07′N 96°05′W / 33.12°N 96.09°W | |
| Country | |
| State | |
| Founded | 1846 |
| Named for | Memucan Hunt, Jr. |
| Seat | Greenville |
| Largest city | Greenville |
| Area | |
| • Total | 882 sq mi (2,280 km2) |
| • Land | 840 sq mi (2,200 km2) |
| • Water | 42 sq mi (110 km2) 4.7% |
| Population (2020) | |
| • Total | 99,956 |
| • Density | 110/sq mi (44/km2) |
| Time zone | UTC−6 (Central) |
| • Summer (DST) | UTC−5 (CDT) |
| Congressional districts | 3rd, 4th |
| Website | www |
Geography edit
According to the U.S. Census Bureau, the county has a total area of 882 square miles (2,280 km2), of which 840 square miles (2,200 km2) are land and 42 square miles (110 km2) (4.7%) are covered by water.[4]
Lakes edit
Major highways edit
Adjacent counties edit
- Fannin County (north)
- Delta County (northeast)
- Hopkins County (east)
- Rains County (southeast)
- Van Zandt County (southeast)
- Kaufman County (south)
- Rockwall County (southwest)
- Collin County (west)
Communities edit
Cities edit
- Caddo Mills
- Campbell
- Celeste
- Commerce (part in Delta County)
- Farmersville (mostly in Collin County)
- Greenville (county seat)
- Hawk Cove
- Josephine (mainly in Collin County)
- Lone Oak
- Quinlan
- Royse City (mostly in Rockwall County and partly in Collin County)
- Union Valley
- West Tawakoni
- Wolfe City
Towns edit
- Neylandville
- Poetry (also in Kaufman County)
Unincorporated communities edit
Demographics edit
| Census | Pop. | Note | %± |
|---|---|---|---|
| 1850 | 1,520 | — | |
| 1860 | 6,630 | 336.2% | |
| 1870 | 10,291 | 55.2% | |
| 1880 | 17,230 | 67.4% | |
| 1890 | 31,885 | 85.1% | |
| 1900 | 47,295 | 48.3% | |
| 1910 | 48,116 | 1.7% | |
| 1920 | 50,350 | 4.6% | |
| 1930 | 49,016 | −2.6% | |
| 1940 | 48,793 | −0.5% | |
| 1950 | 42,731 | −12.4% | |
| 1960 | 39,399 | −7.8% | |
| 1970 | 47,948 | 21.7% | |
| 1980 | 55,248 | 15.2% | |
| 1990 | 64,343 | 16.5% | |
| 2000 | 76,596 | 19.0% | |
| 2010 | 86,129 | 12.4% | |
| 2020 | 99,956 | 16.1% | |
| 2023 (est.) | 113,347 | 13.4% | |
| U.S. Decennial Census[6] 1850–2010[7] 2010–2020[8][9] | |||
| Race / Ethnicity | Pop 2010[10] | Pop 2020[9] | % 2010 | % 2020 |
|---|---|---|---|---|
| White alone (NH) | 64,393 | 65,598 | 74.76% | 65.63% |
| Black or African American alone (NH) | 6,976 | 7,812 | 8.10% | 7.82% |
| Native American or Alaska Native alone (NH) | 600 | 722 | 0.70% | 0.72% |
| Asian alone (NH) | 897 | 979 | 1.04% | 0.98% |
| Pacific Islander alone (NH) | 130 | 151 | 0.15% | 0.15% |
| Some Other Race alone (NH) | 58 | 301 | 0.07% | 0.30% |
| Mixed Race/Multi-Racial (NH) | 1,324 | 4,720 | 1.54% | 4.72% |
| Hispanic or Latino (any race) | 11,751 | 19,673 | 13.64% | 19.68% |
| Total | 86,129 | 99,956 | 100.00% | 100.00% |
Note: the US Census treats Hispanic/Latino as an ethnic category. This table excludes Latinos from the racial categories and assigns them to a separate category. Hispanics/Latinos can be of any race.
As of the census[11] of 2000, 76,596 people, 28,742 households, and 20,521 families resided in the county. The population density was 91 people per square mile (35 people/km2). The 32,490 housing units averaged 39 units per square mile (15/km2). The racial makeup of the county was 83.57% White, 9.45% Black or African American, 0.73% Native American, 0.54% Asian, 0.07% Pacific Islander, 3.93% from other races, and 1.70% from two or more races. About 8.31% of the population were Hispanic or Latino of any race.
Of the 28,742 households, 32.90% had children under the age of 18 living with them, 56.20% were married couples living together, 11.00% had a female householder with no husband present, and 28.60% were not families; 24.10% of all households were made up of individuals, and 9.60% had someone living alone who was 65 years of age or older. The average household size was 2.60 and the average family size was 3.08.
In the county, the population was distributed as 26.50% under the age of 18, 10.00% from 18 to 24, 28.00% from 25 to 44, 22.80% from 45 to 64, and 12.60% who were 65 years of age or older. The median age was 36 years. For every 100 females, there were 98.10 males. For every 100 females age 18 and over, there were 95.30 males.
The median income for a household in the county was $36,752, and for a family was $44,388. Males had a median income of $33,347 versus $23,085 for females. The per capita income for the county was $17,554. About 8.60% of families and 12.80% of the population were below the poverty line, including 15.80% of those under age 18 and 11.70% of those age 65 or over.
Media edit
Hunt County is part of the Dallas/Fort Worth DMA. Local media outlets are: KDFW-TV, KXAS-TV, WFAA-TV, KTVT-TV, KERA-TV, KTXA-TV, KDFI-TV, KDAF-TV, KFWD-TV, and KDTX-TV. Other nearby stations that provide coverage for Hunt County come from the Tyler/Longview/Jacksonville market, and they include: KLTV-TV, KYTX-TV, KFXK-TV, KCEB-TV, and KETK-TV. In addition to this, there is a radio station located at Texas A&M University-Commerce called KETR[12] and located on 88.9 FM on the radio. KETR is a 100,000 watt radio station that can reach up to 75 miles away; the station serves Commerce, A&M-Commerce, Hunt County, and surrounding cities. KGVL in Greenville is another radio station within the county. Two newspapers besides The Dallas Morning News circulate within the county. They are the Herald-Banner (Greenville) and the Commerce Journal (Commerce).
Education edit


The following school districts serve Hunt County:
- Bland ISD (small portion in Collin County)
- Boles ISD
- Caddo Mills ISD
- Campbell ISD
- Celeste ISD
- Commerce ISD (small portion in Delta County)
- Community ISD (mostly in Collin County)
- Cooper ISD (mostly in Delta County)
- Cumby ISD (mostly in Hopkins County)
- Fannindel ISD (mostly in Fannin County; small portion in Delta, Lamar counties)
- Greenville ISD
- Leonard ISD (mostly in Fannin County, small portion in Collin County)
- Lone Oak ISD (small portion in Rains County)
- Quinlan ISD
- Royse City ISD (mostly in Rockwall County, small portion in Collin County)
- Terrell ISD (mostly in Kaufman County)
- Wolfe City ISD (small portion in Fannin County)
In addition, Texas A&M University-Commerce and Paris Junior College-Greenville Center are located within the county.
Top employers edit
| # | Employer | # of Employees | Location |
|---|---|---|---|
| 1 | L3Harris Technologies | 6,400 | Greenville |
| T-2 | Texas A&M University-Commerce | 900 | Commerce |
| T-2 | Walmart | 900* | Commerce, Greenville, Quinlan |
| 4 | Greenville Independent School District | 702 | Greenville |
| 5 | Hunt Regional Medical Center | 1200* | Greenville, Commerce, Quinlan |
Note*: A rough estimate of the four combined Walmarts in Hunt County in the cities of Greenville (two: one supercenter and one neighborhood market), Commerce (one supercenter), and Quinlan (one supercenter). In 2020 HRMC full-time employees has grown to over 1200 people.
Public transportation edit

A public transit called the Connection serves all of Hunt County. The transit operates Monday through Friday from 7 am to 7 pm. Reservations have to be made one day in advance and the transit charges $2 ($4 round trip) if the passenger is traveling to a place within the same community or city, and $3 ($6 round trip) if the passenger is traveling from one city or community to another within Hunt County. Also, the transit will take Hunt County residents to Dallas; this is offered round-trip only, passengers are charged $34, and a minimum of three passengers is also required.[13]
Medical services edit

Hunt County's medical needs are primarily served by Hunt Regional Healthcare, with the Hunt Regional Medical Center located in Greenville being the largest hospital in the county.
Veterans services edit
The Disabled American Veterans, Chapter 81, located at 2502 Church Street, offers veterans and their dependents a meeting place and assistance with filing and mailing disability forms.
The American Legion Otho Morgan Post 17 meets at 4509 Moulton St.
Notable people edit
- Waggoner Carr, Texas state representative and attorney general
- Audie Murphy, World War II soldier and Medal of Honor recipient
- Bart Millard, singer
Politics edit
| Year | Republican | Democratic | Third party | |||
|---|---|---|---|---|---|---|
| No. | % | No. | % | No. | % | |
| 2020 | 29,163 | 75.56% | 8,906 | 23.07% | 528 | 1.37% |
| 2016 | 23,910 | 75.77% | 6,396 | 20.27% | 1,248 | 3.96% |
| 2012 | 21,011 | 74.91% | 6,671 | 23.78% | 367 | 1.31% |
| 2008 | 20,573 | 69.68% | 8,594 | 29.11% | 357 | 1.21% |
| 2004 | 20,065 | 71.17% | 7,971 | 28.27% | 158 | 0.56% |
| 2000 | 16,177 | 66.12% | 7,857 | 32.11% | 432 | 1.77% |
| 1996 | 10,746 | 49.12% | 8,801 | 40.23% | 2,329 | 10.65% |
| 1992 | 9,739 | 39.51% | 7,452 | 30.23% | 7,459 | 30.26% |
| 1988 | 12,331 | 58.06% | 8,820 | 41.53% | 87 | 0.41% |
| 1984 | 14,303 | 67.08% | 6,971 | 32.69% | 48 | 0.23% |
| 1980 | 9,283 | 50.18% | 8,773 | 47.42% | 445 | 2.41% |
| 1976 | 6,676 | 43.59% | 8,543 | 55.79% | 95 | 0.62% |
| 1972 | 9,535 | 72.02% | 3,655 | 27.61% | 49 | 0.37% |
| 1968 | 4,651 | 36.04% | 4,785 | 37.08% | 3,469 | 26.88% |
| 1964 | 3,302 | 33.42% | 6,567 | 66.47% | 10 | 0.10% |
| 1960 | 4,084 | 49.55% | 4,116 | 49.94% | 42 | 0.51% |
| 1956 | 4,508 | 52.47% | 4,051 | 47.15% | 33 | 0.38% |
| 1952 | 5,614 | 53.06% | 4,953 | 46.81% | 14 | 0.13% |
| 1948 | 1,195 | 16.91% | 5,082 | 71.91% | 790 | 11.18% |
| 1944 | 714 | 8.88% | 6,200 | 77.14% | 1,123 | 13.97% |
| 1940 | 877 | 9.70% | 8,156 | 90.18% | 11 | 0.12% |
| 1936 | 335 | 5.45% | 5,801 | 94.37% | 11 | 0.18% |
| 1932 | 465 | 6.34% | 6,856 | 93.41% | 19 | 0.26% |
| 1928 | 3,009 | 46.16% | 3,510 | 53.84% | 0 | 0.00% |
| 1924 | 836 | 10.70% | 6,828 | 87.43% | 146 | 1.87% |
| 1920 | 880 | 15.20% | 4,397 | 75.97% | 511 | 8.83% |
| 1916 | 424 | 8.76% | 4,242 | 87.68% | 172 | 3.56% |
| 1912 | 225 | 5.28% | 3,410 | 80.05% | 625 | 14.67% |
See also edit
References edit
- ^ "Hunt County, Texas". United States Census Bureau. Retrieved January 30, 2022.
- ^ "Find a County". National Association of Counties. Archived from the original on May 31, 2011. Retrieved June 7, 2011.
- ^ Gannett, Henry (1905). The Origin of Certain Place Names in the United States. Govt. Print. Off. pp. 163.
- ^ "2010 Census Gazetteer Files". United States Census Bureau. August 22, 2012. Archived from the original on April 19, 2015. Retrieved April 30, 2015.
- ^ "TSHA | South Sulphur, TX".
- ^ "Decennial Census of Population and Housing by Decades". US Census Bureau.
- ^ "Texas Almanac: Population History of Counties from 1850–2010" (PDF). Texas Almanac. Archived from the original (PDF) on February 26, 2015. Retrieved April 30, 2015.
- ^ "State & County QuickFacts". United States Census Bureau. Archived from the original on July 28, 2011. Retrieved December 17, 2013.
- ^ a b "P2 HISPANIC OR LATINO, AND NOT HISPANIC OR LATINO BY RACE - 2020: DEC Redistricting Data (PL 94-171) - Hunt County, Texas". United States Census Bureau.
- ^ "P2 HISPANIC OR LATINO, AND NOT HISPANIC OR LATINO BY RACE - 2010: DEC Redistricting Data (PL 94-171) - Hunt County, Texas". United States Census Bureau.
- ^ "U.S. Census website". United States Census Bureau. Retrieved May 14, 2011.
- ^ "88.9 KETR - Your Station". www.ketr.org. Archived from the original on March 23, 2018. Retrieved May 6, 2018.
- ^ "SCRPT - Transportation". www.connectioninfo.org. Archived from the original on May 17, 2016. Retrieved May 28, 2016.
- ^ Leip, David. "Dave Leip's Atlas of U.S. Presidential Elections". uselectionatlas.org. Archived from the original on March 23, 2018. Retrieved May 6, 2018.
Further reading edit
- Hathcock, James A. (2004). The Role of Violence in Hunt County, Texas, during Reconstruction (M.S. thesis). University of North Texas. OCLC 1053097663.
External links edit
 Media from Commons
 Data from Wikidata
- Hunt County official web site
- Hunt County in Handbook of Texas Online
33°07′N 96°05′W / 33.12°N 96.09°W