
KNOWPIA
WELCOME TO KNOWPIA

ILembe District Municipality 
Summary
iLembe is one of the 11 district municipalities of KwaZulu-Natal province in South Africa. The seat of iLembe is KwaDukuza.[3] The majority (82%) of its 606,809 people speak isiZulu as their first language (2011 census). The district code is DC29. It was formerly named the King Shaka District Municipality.[4]
iLembe | |
|---|---|
 Seal | |
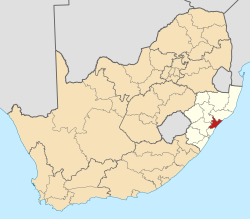 Location of ILembe District Municipality within KwaZulu-Natal | |
| Coordinates: 29°20′S 31°17′E / 29.333°S 31.283°E | |
| Country | South Africa |
| Province | KwaZulu-Natal |
| Seat | KwaDukuza |
| Local municipalities | |
| Government | |
| • Type | Municipal council |
| • Mayor | Sibusiso Welcome Mdabe |
| Area | |
| • Total | 3,269 km2 (1,262 sq mi) |
| Population (2011)[2] | |
| • Total | 606,809 |
| • Density | 190/km2 (480/sq mi) |
| Racial makeup (2011) | |
| • Black African | 90.8% |
| • Coloured | 0.5% |
| • Indian/Asian | 5.9% |
| • White | 2.4% |
| First languages (2011) | |
| • Zulu | 82.2% |
| • English | 9.6% |
| • Xhosa | 3.3% |
| • Southern Ndebele | 1.2% |
| • Other | 3.7% |
| Time zone | UTC+2 (SAST) |
| Municipal code | DC29 |
Geography edit
Neighbours edit
iLembe is surrounded by:
- Umzinyathi to the north (DC24)
- the Indian Ocean to the east
- eThekwini to the south (Durban)
- Umgungundlovu to the west (DC22)
- King Cetshwayo District Municipality to the north-east (DC28)
- Umlalazi to the Noth-west
Local municipalities edit
The district contains the following local municipalities:
| Local municipality | Population | % |
|---|---|---|
| KwaDukuza | 231 187 | 38.10% |
| Ndwedwe | 140 820 | 23.21% |
| Mandeni | 138 078 | 22.75% |
| Maphumulo | 96 724 | 15.94% |
Demographics edit
The following statistics are from the 2011 census.
| Language | Population | % |
|---|---|---|
| Zulu | 496 834 | 82.18% |
| English | 58 227 | 9.63% |
| Xhosa | 20 005 | 3.31% |
| Ndebele | 7 145 | 1.18% |
| Afrikaans | 5 210 | 0.86% |
| Other | 4 465 | 0.74% |
| Sign language | 4 340 | 0.72% |
| Tswana | 3 156 | 0.52% |
| Tsonga | 1 916 | 0.32% |
| Sotho | 1 062 | 0.18% |
| Swati | 624 | 0.10% |
| Venda | 261 | 0.04% |
Gender edit
| Gender | Population | % |
|---|---|---|
| Female | 317 801 | 52.37% |
| Male | 289 009 | 47.63% |
Ethnic group edit
| Ethnic group | Population | % |
|---|---|---|
| Black African | 550 758 | 90.76% |
| Indian/Asian | 35 911 | 5.92% |
| White | 14 713 | 2.42% |
| Coloured | 3 222 | 0.53% |
| Other | 2 205 | 0.36% |
Age edit
| Age | Population | % |
|---|---|---|
| 000 - 004 | 63 172 | 11.27% |
| 005 - 009 | 70 472 | 12.58% |
| 010 - 014 | 71 672 | 12.79% |
| 015 - 019 | 68 769 | 12.27% |
| 020 - 024 | 51 863 | 9.25% |
| 025 - 029 | 44 409 | 7.92% |
| 030 - 034 | 34 767 | 6.20% |
| 035 - 039 | 32 311 | 5.77% |
| 040 - 044 | 26 364 | 4.70% |
| 045 - 049 | 21 287 | 3.80% |
| 050 - 054 | 19 708 | 3.52% |
| 055 - 059 | 14 517 | 2.59% |
| 060 - 064 | 13 614 | 2.43% |
| 065 - 069 | 9 802 | 1.75% |
| 070 - 074 | 8 611 | 1.54% |
| 075 - 079 | 4 533 | 0.81% |
| 080 - 084 | 2 909 | 0.52% |
| 085 - 089 | 876 | 0.16% |
| 090 - 094 | 420 | 0.07% |
| 095 - 099 | 248 | 0.04% |
| 100 plus | 85 | 0.02% |
Politics edit
Election results edit
Election results for iLembe in the South African general election, 2004.
- Population 18 and over: 312 758 [55.81% of total population]
- Total votes: 166 460 [29.70% of total population]
- Voting % estimate: 53.22% votes as a % of population 18 and over
| Party | Votes | % |
|---|---|---|
| African National Congress | 78 343 | 47.06% |
| Inkhata Freedom Party | 69 110 | 41.52% |
| Democratic Alliance | 10 311 | 6.19% |
| African Christian Democratic Party | 2 113 | 1.27% |
| United Democratic Movement | 1 214 | 0.73% |
| Minority Front | 727 | 0.44% |
| New National Party | 570 | 0.34% |
| Azanian People's Organisation | 567 | 0.34% |
| UF | 542 | 0.33% |
| Independent Democrats | 466 | 0.28% |
| Freedom Front Plus | 401 | 0.24% |
| United Christian Democratic Party | 331 | 0.20% |
| Pan African Congress | 316 | 0.19% |
| SOPA | 280 | 0.17% |
| CDP | 247 | 0.15% |
| EMSA | 228 | 0.14% |
| PJC | 209 | 0.13% |
| KISS | 150 | 0.09% |
| NA | 133 | 0.08% |
| TOP | 120 | 0.07% |
| NLP | 82 | 0.05% |
| Total | 166 460 | 100.00% |
See also edit
References edit
- ^ "Contact list: Executive Mayors". Government Communication & Information System. Archived from the original on 14 July 2010. Retrieved 22 February 2012.
- ^ a b c "Statistics by place". Statistics South Africa. Retrieved 27 September 2015.
- ^ "ILembe District Municipality". Archived from the original on 2009-05-22. Retrieved 2009-10-08.
- ^ "Ilembe Case Study" (PDF). The Water Dialogues. p. 10. Archived from the original (PDF) on 2016-03-03. Retrieved 2013-03-16.
External links edit
- iLembe DM Official Website