


Summary
In scientific visualization, image-based flow visualization (or visualisation) is a computer modelling technique developed by Jarke van Wijk[1] to visualize two dimensional flows of liquids such as water and air, like the wind movement of a tornado. Compared with integration techniques it has the advantage of producing a whole image at every step, as the technique relies upon graphical computing methods for frame-by-frame capture of the model of advective transport of a decaying dye. It is a method from the texture advection family.

Principle edit
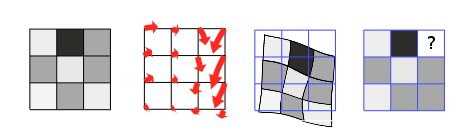
The core idea is to create a noise texture on a regular grid and then bend this grid according to the flow (the vector field). The bent grid is then sampled at the original grid locations. Thus, the output is a version of the noise, that is displaced according to the flow.
The advantage of this approach is that it can be accelerated on modern graphics hardware, thus allowing for real-time or almost real-time simulation of 2D flow data. This is particularly handy if one wants to visualise multiple scaled versions of the vector field to first gain an overview and then concentrate on the details.[2]
References edit
- ^ van Wijk, Jack (2002). "Image Based Flow Visualization" (PDF). Proceedings ACM SIGGRAPH 2002, San Antonio, Texas.
- ^ Telea, Alexandru; Strzodka, Robert (2006). "Multiscale image based flow visualization" (PDF). In Erbacher, Robert F.; Roberts, Jonathan C.; Gröhn, Matti T.; Börner, Katy (eds.). Visualization and Data Analysis 2006. Vol. 6060. p. 606001. Bibcode:2006SPIE.6060E..01T. CiteSeerX 10.1.1.72.3457. doi:10.1117/12.640425. S2CID 14935756.
{{cite book}}:|journal=ignored (help)
External links edit
- Website of Jarke van Wijk with demo software and pictures