


Summary
Indentation plastometry is the idea of using an indentation-based procedure to obtain (bulk) mechanical properties (of metals) in the form of stress-strain relationships in the plastic regime (as opposed to hardness testing, which gives numbers that are only semi-quantitative indicators of the resistance to plastic deformation). Since indentation is a much easier and more convenient procedure than conventional tensile testing, with far greater potential for mapping of spatial variations, this is an attractive concept (provided that the outcome is at least approximately as reliable as those of standard uniaxial tests).
Basic requirements edit
Capturing of macroscopic (size-independent) properties brings in a requirement[1][2][3][4] to deform a volume of material that is large enough to be representative of the bulk. This depends on the microstructure, but usually means that it must contain “many” grains and is typically of the order of hundreds of microns in linear dimensions. The indentation size effect, in which the measured hardness tends to increase as the deformed volume becomes small, is at least partly due to a failure to interrogate a representative volume. The indenter, which is normally spherical, therefore needs to have a radius in the approximate range of several hundred microns up to a mm or two.
A further requirement concerns the plastic strains generated in the sample. The indentation response must be sensitive to the plasticity characteristics of the material over the strain range of interest, which normally extends up to at least several % and commonly up to several tens of %. The strains created in the sample must therefore also range up to values of this order. This typically requires that the “penetration ratio” (penetration depth over indenter radius) should be at least about 10%. Finally, depending on the hardness of the metal, this in turn requires that the facility should have a relatively high load capability – usually of the order of several kN.
Experimental outcomes edit
The simplest indentation procedures, which have been in use for many decades, involve the application of a pre-determined load (often from a dead weight), followed by measurement of the lateral size of the residual indent (or possibly its depth). However, many indentation procedures are now based on “instrumented” set-ups, in which the load is progressively ramped up and both load and penetration (displacement) are continuously monitored during indentation. A key experimental outcome is thus the load-displacement curve. Various types of equipment can be used to generate such curves. These include those designed to carry out so-called “nanoindentation” - for which both the load (down to the mN range) and the displacement (commonly sub-micron) are very small. However, as noted above, if the deformed volume is small, then it’s not possible to obtain “bulk” properties. Moreover, even with relatively large loads and displacements, some kind of “compliance correction” may be required, to separate the response of the sample from displacements associated with the loading system.
The other main form of experimental outcome is the shape of the residual indent. As mentioned above, early types of hardness tester focused on this, in the form of (relatively crude) measurement of the “width” of the indent – commonly via simple optical microscopy. However, much richer information can be extracted by using a profilometer (optical or stylus) to obtain the full shape of the residual indent. With a spherical indenter (and a sample that is isotropic in the plane of the indented surface), the indent will exhibit radial symmetry and its shape can be captured in the form of a single profile (of depth against radial position). The details of this shape (for a given applied load) exhibit a high sensitivity to the stress-strain relationship of the sample.[5][6][7] Also, it is easier to obtain than a load-displacement curve, partly because no measurements need to be made during loading. Finally, such profilometry has potential for the detection and characterization[8][9][10][11][12] of sample anisotropy (whereas load-displacement curves carry no such information).
Solution procedures edit
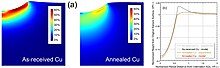
Two main approaches have evolved for obtaining stress-strain relationships from experimental indentation outcomes (load-displacement curves or residual indent profiles). The simpler of the two involves direct “conversion” of the load-displacement curve. This is usually done[13][14] by obtaining a series of “equivalent”, “effective” or “representative” values of the stress in the loaded part of the sample (from the applied load) and a corresponding set of values of the strain in the deformed region (from the displacement). The assumptions involved in carrying out such conversions are inevitably very crude, since (even for a spherical indenter) the fields of both stress and strain within the sample are highly complex and evolve throughout the process – the figure shows some typical plastic strain fields. Various empirical correction factors are commonly employed, with neural network “training” procedures sometimes being applied[15][16] to sets of load-displacement data and corresponding stress-strain curves, to help evaluate them. It’s also common for loading to be periodically interrupted, and data from partial unloading procedures to be used in the conversion. However, unsurprisingly, universal conversions of this type (applied to samples with unknown stress-strain curves) tend to be unreliable[17][18][19] and it is now widely accepted that the procedure cannot be used with any confidence.
The other main approach is a more cumbersome one, although with much greater potential for obtaining reliable results. It involves iterative numerical (Finite element method – FEM) modelling of the indentation procedure. This is first done with a trial stress-strain relationship (in the form of an analytical expression – often termed a constitutive equation), followed by convergence on the best fit version (set of parameter values in the equation), giving optimal agreement between experimental and modelled outcomes (load-displacement plots or residual indent profiles). This procedure fully captures the complexity of the evolving stress and strain fields during indentation. While it is based on relatively intensive modelling computations, protocols have been developed in which the convergence is automated and rapid.
Profilometry-based indentation plastometry (PIP) edit
It has become clear that important advantages are offered by using the residual indent profile as the target outcome, rather than the load-displacement curve. These include easier measurement, greater sensitivity of the experimental outcome to the stress-strain relationship and potential for detection and characterisation of sample anisotropy – see above. The figure gives an indication of the sensitivity of the profile to the stress-strain curve of the material. The term PIP thus encompasses the following features: 1) Obtaining stress-strain curves characteristic of the bulk of a material (by using relatively large spherical indenters and relatively deep penetration), 2) Experimental measurement of the residual indent profile and 3) Iterative FEM simulation of the indentation test, to obtain the stress-strain curve (captured in a constitutive equation) that gives the best fit between modelled and measured profiles.
For tractable and user-friendly application, an integrated facility is needed, in which the procedures of indentation, profilometry and convergence on the optimal stress-strain curve are all under automated control
References edit
- ^ Cheng, Y (2004). "Scaling, dimensional analysis, and indentation measurements". Materials Science and Engineering: R: Reports. 44 (4–5): 91–149. doi:10.1016/j.mser.2004.05.001.
- ^ Ostoja-Starzewski, M (2006). "Material Spatial Randomness: From Statistical to Representative Volume Element". Probabilistic Engineering Mechanics. 21 (2): 112–132. doi:10.1016/j.probengmech.2005.07.007.
- ^ Roters, F (2010). "Overview of constitutive laws, kinematics, homogenization and multiscale methods in crystal plasticity finite-element modeling: Theory, experiments, applications". Acta Materialia. 58 (4): 1152–1211. Bibcode:2010AcMat..58.1152R. doi:10.1016/j.actamat.2009.10.058.
- ^ Voyiadjis, G (2017). "Review of Nanoindentation Size Effect: Experiments and Atomistic Simulation". Crystals. 7 (10): 321. doi:10.3390/cryst7100321.
- ^ Bolzon, G (2004). "Material model calibration by indentation, imprint mapping and inverse analysis". International Journal of Solids and Structures. 41 (11–12): 2957–2975. doi:10.1016/j.ijsolstr.2004.01.025.
- ^ Lee, J (2009). "Reverse analysis of nano-indentation using different representative strains and residual indentation profiles". Materials and Design. 30 (9): 3395–3404. doi:10.1016/j.matdes.2009.03.030.
- ^ Campbell, J (2019). "Comparison between stress-strain plots obtained from indentation plastometry, based on residual indent profiles, and from uniaxial testing". Acta Materialia. 168: 87–99. Bibcode:2019AcMat.168...87C. doi:10.1016/j.actamat.2019.02.006.
- ^ Bocciarelli, M (2005). "Parameter identification in anisotropic elastoplasticity by indentation and imprint mapping". Mechanics of Materials. 37 (8): 855–868. doi:10.1016/j.mechmat.2004.09.001.
- ^ Yonezu, A (2009). "Estimation of the anisotropic plastic property using single spherical indentation - An FEM study". Computational Materials Science. 47 (2): 611–619. doi:10.1016/j.commatsci.2009.10.003.
- ^ Zambaldi, C (2010). "Plastic anisotropy of gamma-TiAl revealed by axisymmetric indentation". Acta Materialia. 58 (9): 3516–3530. Bibcode:2010AcMat..58.3516Z. doi:10.1016/j.actamat.2010.02.025. hdl:11858/00-001M-0000-0019-3BCC-D.
- ^ Zhan, X (2017). "Identification of plastic anisotropy using spherical indentation on different anisotropic yield criterions". Engineering Computations. 34 (7): 2268–2299. doi:10.1108/ec-01-2017-0015.
- ^ Tang, Y (2021). "Use of Profilometry-based Indentation Plastometry to obtain Stress-Strain Curves from Small Superalloy Components made by Additive Manufacturing". Materialia. 15: 101017. doi:10.2139/ssrn.3746800. S2CID 234579523.
- ^ Kim, J (2006). "Determination of Tensile Properties by Instrumented Indentation Technique: Representative Stress and Strain Approach". Surface and Coatings Technology. 201 (7): 4278–4283. doi:10.1016/j.surfcoat.2006.08.054.
- ^ Hernot, X (2014). "Study of the concept of representative strain and constraint factor introduced by Vickers indentation". Mechanics of Materials. 68: 1–14. doi:10.1016/j.mechmat.2013.07.004. S2CID 17603877.
- ^ Huber, N (1999). "Determination of constitutive properties from spherical indentation data using neural networks. Part I: the case of pure kinematic hardening in plasticity laws". Journal of the Mechanics and Physics of Solids. 47 (7): 1569–1588. Bibcode:1999JMPSo..47.1569H. doi:10.1016/s0022-5096(98)00109-4.
- ^ Mahmoudi, A (2012). "An Alternative Approach to Determine Material Characteristics Using Spherical Indentation and Neural Networks for Bulk Metals" (PDF). Journal of Testing and Evaluation. 40 (2): 211–219. doi:10.1520/jte103897.
- ^ Jeon, E (2009). "A Method for Estimating Uncertainty of Indentation Tensile Properties in Instrumented Indentation Test". Journal of Engineering Materials and Technology. 131 (3): 6. doi:10.1115/1.3120391.
- ^ Chang, C (2018). "Representative Stress-Strain Curve by Spherical Indentation on Elastic-Plastic Materials". Advances in Materials Science and Engineering. 8316384: 1–9. doi:10.1155/2018/8316384.
- ^ Huang, F (2021). "Uncertainties in the representative indentation stress and strain using spherical nanoindentation". Applied Nanoscience. 13 (3): 895–909. Bibcode:2021ApNan..11..895H. doi:10.1007/s13204-020-01646-x. S2CID 231745165.