


Summary
The Interlake Region is an informal geographic region of the Canadian province of Manitoba that lies roughly between Lake Winnipeg and Lake Manitoba in the Canadian province of Manitoba.
Interlake Region | |
|---|---|
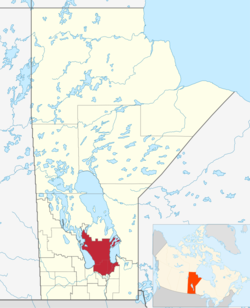 Map of the Interlake Region of Manitoba. | |
| Country | |
| Province | |
| Area | |
| • Total | 15,858.13 km2 (6,122.86 sq mi) |
| Population | |
| • Total | 98,028 |
| • Density | 6.2/km2 (16/sq mi) |
The region comprises 14 rural municipalities, one city (the City of Selkirk), five towns (Arborg, Riverton, Stonewall, Teulon and Winnipeg Beach) ,and one village (Dunnottar). The largest population centre in the region is Selkirk, and the second largest is the town of Stonewall.
Argyle, Manitoba, is the small hamlet that is located on the Principal Meridian of Canada, near the middle of the Interlake Region. Sandy Hook is located between Winnipeg Beach and Gimli, a popular summer vacation spot.
Geography edit
The Interlake Region geographically is a low lying glacial lake basin that is poorly drained.[2] The area is clearly defined on the west by the shores of Lake Manitoba and on the eastern edge by Lake Winnipeg. The northern and southern boundaries are less clearly defined geographically. The geography of the region is mostly composed of sandy beaches, wetlands, lakes, bogs, marshlands, agricultural fields, glacial till, rocky shorelines, and oak, aspen, and eastern cedar forests.[2] The topography is mostly level and poorly drained, swamps exist in all portions of the region.[3] The soils are mostly shallow and mixed with lime and thus mostly infertile.[3] Agricultural areas do thrive in the regions surrounding the Icelandic River basin in the north around Arborg and Riverton, as well as in the area east of Teulon and close to Gimli.
Climate edit
The climate of the area is moderated by the lakes and overall is slightly cooler than the weather found in Winnipeg and southern Manitoba.
| Climate data for Arborg (1981–2010 normals) | |||||||||||||
|---|---|---|---|---|---|---|---|---|---|---|---|---|---|
| Month | Jan | Feb | Mar | Apr | May | Jun | Jul | Aug | Sep | Oct | Nov | Dec | Year |
| Record high °C (°F) | 7.5 (45.5) |
7.8 (46.0) |
16.7 (62.1) |
30.0 (86.0) |
37.0 (98.6) |
37.0 (98.6) |
36.5 (97.7) |
36.1 (97.0) |
36.5 (97.7) |
28.5 (83.3) |
20.6 (69.1) |
9.5 (49.1) |
37.0 (98.6) |
| Mean daily maximum °C (°F) | −12.6 (9.3) |
−8.9 (16.0) |
−1.8 (28.8) |
9.1 (48.4) |
16.9 (62.4) |
21.9 (71.4) |
24.8 (76.6) |
24.0 (75.2) |
17.5 (63.5) |
9.1 (48.4) |
−1.6 (29.1) |
−9.9 (14.2) |
7.4 (45.3) |
| Daily mean °C (°F) | −18.3 (−0.9) |
−14.9 (5.2) |
−7.5 (18.5) |
3.0 (37.4) |
10.0 (50.0) |
15.8 (60.4) |
18.6 (65.5) |
17.5 (63.5) |
11.5 (52.7) |
3.9 (39.0) |
−6.0 (21.2) |
−14.8 (5.4) |
1.6 (34.9) |
| Mean daily minimum °C (°F) | −23.9 (−11.0) |
−20.8 (−5.4) |
−13.3 (8.1) |
−3.2 (26.2) |
3.2 (37.8) |
9.6 (49.3) |
12.3 (54.1) |
10.9 (51.6) |
5.4 (41.7) |
−1.3 (29.7) |
−10.3 (13.5) |
−19.7 (−3.5) |
−4.3 (24.3) |
| Record low °C (°F) | −45.6 (−50.1) |
−48.3 (−54.9) |
−42.2 (−44.0) |
−29.5 (−21.1) |
−14.0 (6.8) |
−5.0 (23.0) |
1.1 (34.0) |
−2.0 (28.4) |
−7.8 (18.0) |
−21.0 (−5.8) |
−40.0 (−40.0) |
−41.1 (−42.0) |
−48.3 (−54.9) |
| Average precipitation mm (inches) | 16.9 (0.67) |
12.4 (0.49) |
24.9 (0.98) |
25.9 (1.02) |
55.4 (2.18) |
80.9 (3.19) |
70.3 (2.77) |
68.9 (2.71) |
53.4 (2.10) |
43.9 (1.73) |
27.0 (1.06) |
19.7 (0.78) |
499.4 (19.66) |
| Average snowfall cm (inches) | 16.9 (6.7) |
10.1 (4.0) |
15.3 (6.0) |
7.8 (3.1) |
1.2 (0.5) |
0.0 (0.0) |
0.0 (0.0) |
0.0 (0.0) |
0.4 (0.2) |
6.9 (2.7) |
18.3 (7.2) |
18.7 (7.4) |
95.6 (37.6) |
| Source: Environment Canada[4] | |||||||||||||
| Climate data for Gimli, Manitoba | |||||||||||||
|---|---|---|---|---|---|---|---|---|---|---|---|---|---|
| Month | Jan | Feb | Mar | Apr | May | Jun | Jul | Aug | Sep | Oct | Nov | Dec | Year |
| Record high °C (°F) | 8.2 (46.8) |
8.1 (46.6) |
15.0 (59.0) |
29.2 (84.6) |
36.1 (97.0) |
36.7 (98.1) |
35.0 (95.0) |
37.5 (99.5) |
36.5 (97.7) |
26.1 (79.0) |
22.8 (73.0) |
6.3 (43.3) |
37.5 (99.5) |
| Mean daily maximum °C (°F) | −12.8 (9.0) |
−9.3 (15.3) |
−1.8 (28.8) |
8.2 (46.8) |
16.3 (61.3) |
21.6 (70.9) |
24.9 (76.8) |
23.2 (73.8) |
16.9 (62.4) |
9.5 (49.1) |
−1.1 (30.0) |
−10.5 (13.1) |
7.1 (44.8) |
| Daily mean °C (°F) | −18.2 (−0.8) |
−14.8 (5.4) |
−7.3 (18.9) |
2.7 (36.9) |
10.6 (51.1) |
16.1 (61.0) |
19.2 (66.6) |
17.5 (63.5) |
11.6 (52.9) |
4.8 (40.6) |
−5.2 (22.6) |
−15.4 (4.3) |
1.8 (35.2) |
| Mean daily minimum °C (°F) | −23.5 (−10.3) |
−20.3 (−4.5) |
−12.8 (9.0) |
−2.9 (26.8) |
4.7 (40.5) |
10.5 (50.9) |
13.5 (56.3) |
11.8 (53.2) |
6.3 (43.3) |
0.0 (32.0) |
−9.2 (15.4) |
−20.3 (−4.5) |
−3.5 (25.7) |
| Record low °C (°F) | −41.2 (−42.2) |
−39.4 (−38.9) |
−34.4 (−29.9) |
−25.6 (−14.1) |
−9.5 (14.9) |
−1.3 (29.7) |
2.8 (37.0) |
0.5 (32.9) |
−15.8 (3.6) |
−16.4 (2.5) |
−34.3 (−29.7) |
−39.4 (−38.9) |
−41.2 (−42.2) |
| Average precipitation mm (inches) | 22.2 (0.87) |
17.3 (0.68) |
30.0 (1.18) |
30.0 (1.18) |
49.8 (1.96) |
94.1 (3.70) |
69.7 (2.74) |
64.2 (2.53) |
66.7 (2.63) |
38.3 (1.51) |
27.6 (1.09) |
22.5 (0.89) |
532.5 (20.96) |
| Average rainfall mm (inches) | 0.3 (0.01) |
0.3 (0.01) |
8.8 (0.35) |
19.8 (0.78) |
47.6 (1.87) |
94.1 (3.70) |
69.7 (2.74) |
64.2 (2.53) |
65.6 (2.58) |
30.3 (1.19) |
5.3 (0.21) |
1.8 (0.07) |
407.8 (16.06) |
| Average snowfall cm (inches) | 27.6 (10.9) |
21.7 (8.5) |
24.1 (9.5) |
11.4 (4.5) |
2.2 (0.9) |
0 (0) |
0 (0) |
0 (0) |
1.1 (0.4) |
8.4 (3.3) |
26.6 (10.5) |
25.0 (9.8) |
148.1 (58.3) |
| Average precipitation days (≥ 0.2 mm) | 12.3 | 9.2 | 9.5 | 8.1 | 9.9 | 12.7 | 11.7 | 11.6 | 11.1 | 10.0 | 9.4 | 12.4 | 127.6 |
| Average rainy days (≥ 0.2 mm) | 0.30 | 0.35 | 2.5 | 5.6 | 9.5 | 12.7 | 11.7 | 11.6 | 10.9 | 8.2 | 2.3 | 0.53 | 76.1 |
| Average snowy days (≥ 0.2 cm) | 13.9 | 9.7 | 8.5 | 3.7 | 1.0 | 0.05 | 0 | 0 | 0.45 | 2.6 | 8.6 | 13.6 | 62.0 |
| Mean monthly sunshine hours | 119.3 | 141.2 | 190.3 | 247.5 | 284.4 | 289.6 | 319.1 | 271.8 | 174.8 | 141.1 | 94.9 | 102.4 | 2,376.4 |
| Source: Environment Canada[5] | |||||||||||||
Demographics edit
Major communities edit
| Name of Population Centre | Population (2021) |
|---|---|
| Arborg | 1,279 |
| Ashern | 616 |
| Eriksdale | 846 |
| Fisher Branch | 465 |
| Gimli | 2,345 |
| Riverton | 475 |
| Selkirk | 10,504 |
| Stonewall | 5,046 |
| Teulon | 1,201 |
| Winnipeg Beach | 1,145 |
Census subdivisions edit
The Interlake Economic Region is made of three subdivisions according to Statistics Canada which includes Divisions No. 13, No. 14, and No. 18.
| Division No. | Population (2021) | Area Km2 |
|---|---|---|
| No. 13 | 51,643 | 1,662.28 |
| No. 14 | 19,749 | 2,833.41 |
| No. 18 | 26,636 | 11,362.44 |
| Totals | 98,028 | 15,858.13 |
See also edit
- Interlake-Gimli — provincial electoral district
- Interlake — former provincial electoral district
- Selkirk-Interlake — federal electoral district
References edit
- Community Profile: Census Division No. 13, Manitoba; Statistics Canada
- Community Profile: Census Division No. 14, Manitoba; Statistics Canada
- Community Profile: Census Division No. 18, Manitoba; Statistics Canada
References edit
- ^ "Interlake economic region statistics". Statistics Canada. Retrieved March 24, 2023.
- ^ a b "Interlake Region Manitoba Canada". Eh Canada Travel. Retrieved March 24, 2023.
- ^ a b James Morton Richtik (October 1964). "A Historical Geography of the Interlake Area of Manitoba from 1871-1921". University of Manitoba. Retrieved March 24, 2023.
- ^ "Canadian Climate Normals 1981-2010". Environment Canada. Retrieved 13 June 2018.
- ^ "Canadian Climate Normals 1971–2000". Environment Canada. Retrieved March 19, 2012.
External links edit
- Interlake Regional Profile
50°50′N 97°40′W / 50.833°N 97.667°W