


Summary
Ipswich /ˈɪpswɪtʃ/ ⓘ is a constituency[n 1] represented in the House of Commons of the UK Parliament since December 2019 by Tom Hunt of the Conservative Party.[n 2]
| Ipswich | |
|---|---|
| Borough constituency for the House of Commons | |
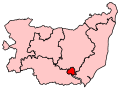 Boundary of Ipswich in Suffolk | |
 Location of Suffolk within England | |
| County | Suffolk |
| Electorate | 75,195 (December 2010)[1] |
| Major settlements | Ipswich |
| Current constituency | |
| Created | 1295 |
| Member of Parliament | Tom Hunt (Conservative) |
| Seats | One |
History edit
The constituency was created as Parliamentary Borough in the fourteenth century, returning two MPs to the House of Commons of England until 1707, then to the House of Commons of Great Britain until 1800, and from 1801 to the House of Commons of the United Kingdom. The constituency's parliamentary representation was reduced to a single seat with one MP under the Representation of the People Act 1918. Prior to the 1983 general election, when north-western areas were transferred to the Central Suffolk constituency, the Parliamentary and Municipal/County Boroughs were the same
Before the Reform Act 1832, the franchise in Ipswich was in the hands of the Ipswich Corporation and the Freemen. Ipswich was seen as a partisan seat with active Blue (Tory inclined) and Yellow (Whig inclined) factions dominating elections for both Parliament and the corporation and comparatively rare split tickets of one Whig and one Tory being returned to Parliament, although the identification of the local parties with national parties could at times be very blurred.[2] In the mid eighteenth century the constituency had an electorate of around 700, which was a middle sized borough by the standards of the time - and a reputation of a borough that was likely to offer stiff opposition to government favoured candidates.[3]
Ipswich is a marginal seat, having changed hands ten times since its creation as a single-member constituency in 1918. It has generally been favourable to candidates from the Labour Party, being won by Labour at every postwar general election since the end of World War II; except 1970, February 1974, 1987, 2010, 2015 and 2019. Despite this, it was traditionally won by the party by fairly small margins; however, from 1997 until being gained by the Conservative Party in 2010, Labour won the contests with safer margins, and after the Conservatives increased their majority in 2015, Labour regained the seat in 2017 only to lose it again in 2019 when the Conservative candidate got more than half the votes cast when there were more than two candidates for the first time since 1918.
Ipswich was the only seat won by a Labour candidate at the 2017 general election from a total of seven seats in Suffolk, the others being retained by Conservatives and more rural in comparison to Ipswich. Martin's 2017 election victory was one of thirty net gains made by the Labour Party.
Constituency profile edit
The constituency includes Ipswich town centre and docks, with its mix of historic buildings and modern developments. Ipswich is a bustling town that serves as a centre for the rest of Suffolk which is predominantly rural and remote, and has the only serious concentration of Labour voters in the county, other than in Lowestoft.
Portman Road Football Ground to the West of the centre, and the new university to the East are both in the seat, as is the vast Chantry council estate to the South.
Ipswich's Conservative-leaning suburbs, such as Castle Hill, Westerfield and Kesgrave, extend beyond the constituency's boundaries – the northernmost wards are in the Suffolk Central constituency, and several strong Conservative areas are just outside the borough's tightly drawn limits, making Ipswich a target seat for Labour.
Boundaries and boundary changes edit
1918–1983 edit
- The County Borough of Ipswich.[4]
1983–2010 edit
- The Borough of Ipswich wards of Bixley, Bridge, Chantry, Gainsborough, Priory Heath, Rushmere, St Clement's, St John's, St Margaret's, Sprites, Stoke Park, and Town.[5][6]
The Broomhill, Castle Hill, White House and Whitton wards were transferred to the new county constituency of Central Suffolk (Central Suffolk and North Ipswich from 1997).
- The Borough of Ipswich wards of Alexandra, Bixley, Bridge, Gainsborough, Gipping, Holywells, Priory Heath, Rushmere, St John's, St Margaret's, Sprites, Stoke Park, and Westgate.[7]
Following a revision of the Borough of Ipswich wards, the constituency gained a small area from Central Suffolk and North Ipswich.
The present-day constituency consists of most of the Borough of Ipswich, with the exception of the Castle Hill, Whitehouse and Whitton wards.
Proposed edit
Further to the 2023 Periodic Review of Westminster constituencies, enacted by the Parliamentary Constituencies Order 2023, the composition of the constituency from the next general election, due by January 2025, will be unchanged.[8]
Members of Parliament edit
Freemen belonging to the Ipswich Corporation were entitled to elect two burgesses to the Parliament of England from the fourteenth century which continued uninterrupted after the parliament united with Scotland and Ireland, only becoming a single member constituency in 1918.
MPs 1386–1660 edit
MPs 1660–1832 edit
MPs 1832–1918 edit
During the period between 1835 and 1842 there were five elections and all were found to have been corrupt. After the 1835 election, Dundas and Kelly were unseated on the charge of bribery. After the 1837 election, Tufnell was unseated on a scrutiny. Gibson, who was elected in 1838, resigned. Cochrane was elected in 1839, after which a petition was presented complaining of gross bribery – it was not progressed because a general election was expected. After the 1841 election, Wason and Rennie were unseated, being declared guilty of bribery by their agents.[29]
MPs 1918–present edit
Elections edit
Elections in the 2020s edit
| Party | Candidate | Votes | % | ±% | |
|---|---|---|---|---|---|
| Labour | Jack Abbott[30] | ||||
| Liberal Democrats | James Sandbach[31] | ||||
| Reform UK | Antony Love[32] | ||||
| Majority | |||||
| Turnout | |||||
Elections in the 2010s edit
| Party | Candidate | Votes | % | ±% | |
|---|---|---|---|---|---|
| Conservative | Tom Hunt | 24,952 | 50.3 | ||
| Labour | Sandy Martin | 19,473 | 39.3 | ||
| Liberal Democrats | Adrian Hyyrylainen-Trett | 2,439 | 4.9 | ||
| Brexit Party | Nicola Thomas | 1,432 | 2.9 | New | |
| Green | Barry Broom | 1,283 | 2.6 | ||
| Majority | 5,479 | 11.0 | N/A | ||
| Turnout | 49,579 | 65.6 | |||
| Conservative gain from Labour | Swing | ||||
| Party | Candidate | Votes | % | ±% | |
|---|---|---|---|---|---|
| Labour | Sandy Martin | 24,224 | 47.4 | ||
| Conservative | Ben Gummer | 23,393 | 45.7 | ||
| UKIP | Tony Gould | 1,372 | 2.7 | ||
| Liberal Democrats | Adrian Hyyrylainen-Trett | 1,187 | 2.3 | ||
| Green | Charlotte Armstrong | 840 | 1.6 | ||
| Independent | David Tabane | 121 | 0.2 | New | |
| Majority | 831 | 1.7 | N/A | ||
| Turnout | 51,137 | 67.6 | |||
| Labour gain from Conservative | Swing | ||||
| Party | Candidate | Votes | % | ±% | |
|---|---|---|---|---|---|
| Conservative | Ben Gummer | 21,794 | 44.8 | +5.7 | |
| Labour | David Ellesmere | 18,061 | 37.1 | +2.4 | |
| UKIP | Maria Vigneau | 5,703 | 11.7 | +8.8 | |
| Green | Barry Broom | 1,736 | 3.6 | +1.9 | |
| Liberal Democrats | Chika Akinwale | 1,400 | 2.9 | −15.3 | |
| Majority | 3,733 | 7.7 | +3.3 | ||
| Turnout | 48,694 | 65.4 | +5.5 | ||
| Conservative hold | Swing | +1.6 | |||
| Party | Candidate | Votes | % | ±% | |
|---|---|---|---|---|---|
| Conservative | Ben Gummer | 18,371 | 39.1 | +8.0 | |
| Labour | Chris Mole | 16,292 | 34.7 | −8.2 | |
| Liberal Democrats | Mark Dyson | 8,556 | 18.2 | −2.9 | |
| UKIP | Chris Streatfield | 1,365 | 2.9 | +0.2 | |
| BNP | Dennis Boater | 1,270 | 2.7 | New | |
| Green | Tim Glover | 775 | 1.7 | New | |
| Christian | Kim Christofi | 149 | 0.3 | New | |
| Independent | Peter Turtill | 93 | 0.2 | New | |
| Independent | Sally Wainman | 70 | 0.1 | New | |
| Majority | 2,079 | 4.4 | N/A | ||
| Turnout | 46,941 | 59.9 | −0.2 | ||
| Conservative gain from Labour | Swing | +8.1 | |||
Elections in the 2000s edit
| Party | Candidate | Votes | % | ±% | |
|---|---|---|---|---|---|
| Labour | Chris Mole | 18,336 | 43.8 | −7.5 | |
| Conservative | Paul West | 13,004 | 31.1 | +0.6 | |
| Liberal Democrats | Richard Atkins | 8,464 | 20.2 | +5.0 | |
| UKIP | Alison West | 1,134 | 2.7 | +1.1 | |
| English Democrat | Jervis Kay | 641 | 1.5 | New | |
| Independent | Sally Wainman | 299 | 0.7 | New | |
| Majority | 5,332 | 12.7 | −8.1 | ||
| Turnout | 41,878 | 60.8 | +3.8 | ||
| Labour hold | Swing | −4.0 | |||
Following the death of Jamie Cann on 15 October 2001, a by-election was held on 22 November 2001.
| Party | Candidate | Votes | % | ±% | |
|---|---|---|---|---|---|
| Labour | Chris Mole | 11,881 | 43.4 | −7.9 | |
| Conservative | Paul West | 7,794 | 28.4 | −2.1 | |
| Liberal Democrats | Tessa Munt | 6,146 | 22.4 | +7.2 | |
| CPA | David Coope | 581 | 2.1 | New | |
| UKIP | Jonathan Wright | 276 | 1.0 | −0.6 | |
| Green | Tony Slade | 255 | 0.9 | New | |
| Legalise Cannabis | John Ramirez | 236 | 0.9 | New | |
| Socialist Alliance | Peter Leech | 152 | 0.6 | 0.0 | |
| English Independence Party | Nicolas Winskill | 84 | 0.3 | New | |
| Majority | 4,087 | 15.0 | −5.8 | ||
| Turnout | 27,405 | 40.2 | −16.8 | ||
| Labour hold | Swing | −5.9 | |||
| Party | Candidate | Votes | % | ±% | |
|---|---|---|---|---|---|
| Labour | Jamie Cann | 19,952 | 51.3 | −1.4 | |
| Conservative | Edward Wild | 11,871 | 30.5 | −0.6 | |
| Liberal Democrats | Terence Gilbert | 5,904 | 15.2 | +3.0 | |
| UKIP | William Vinyard | 624 | 1.6 | +1.2 | |
| Socialist Alliance | Peter Leech | 305 | 0.8 | New | |
| Socialist Labour | Shaun Gratton | 217 | 0.6 | New | |
| Majority | 8,081 | 20.8 | −0.8 | ||
| Turnout | 38,873 | 57.0 | −15.2 | ||
| Labour hold | Swing | −0.8 | |||
Elections in the 1990s edit
| Party | Candidate | Votes | % | ±% | |
|---|---|---|---|---|---|
| Labour | Jamie Cann | 25,484 | 52.7 | +8.9 | |
| Conservative | Stephen Castle | 15,048 | 31.1 | −12.3 | |
| Liberal Democrats | Nigel Roberts | 5,881 | 12.2 | +0.8 | |
| Referendum | Theodore Agnew | 1,637 | 3.4 | New | |
| UKIP | William Vinyard | 208 | 0.4 | New | |
| Natural Law | Eric Kaplan | 107 | 0.2 | −0.1 | |
| Majority | 10,436 | 21.6 | +21.2 | ||
| Turnout | 48,365 | 72.2 | -8.1 | ||
| Labour hold | Swing | +10.5 | |||
| Party | Candidate | Votes | % | ±% | |
|---|---|---|---|---|---|
| Labour | Jamie Cann | 23,680 | 43.8 | +1.1 | |
| Conservative | Michael Irvine | 23,415 | 43.4 | −1.0 | |
| Liberal Democrats | Joseph White | 6159 | 11.4 | -1.1 | |
| Green | Jane Scott | 591 | 1.1 | New | |
| Natural Law | Eric Kaplan | 181 | 0.3 | New | |
| Majority | 265 | 0.4 | N/A | ||
| Turnout | 54,026 | 80.3 | +3.2 | ||
| Labour gain from Conservative | Swing | +1.1 | |||
Elections in the 1980s edit
| Party | Candidate | Votes | % | ±% | |
|---|---|---|---|---|---|
| Conservative | Michael Irvine | 23,328 | 44.4 | +2.8 | |
| Labour | Ken Weetch | 22,454 | 42.7 | -1.0 | |
| SDP | Hugh Nicholson | 6,596 | 12.5 | -1.7 | |
| Workers Revolutionary | David Lettice | 174 | 0.3 | New | |
| Majority | 874 | 1.7 | N/A | ||
| Turnout | 52,552 | 77.1 | +1.7 | ||
| Conservative gain from Labour | Swing | +1.9 | |||
| Party | Candidate | Votes | % | ±% | |
|---|---|---|---|---|---|
| Labour | Ken Weetch | 22,191 | 43.7 | ||
| Conservative | Elizabeth Cottrell | 21,114 | 41.6 | ||
| Liberal | Patricia Miernik | 7,220 | 14.2 | ||
| BNP | Albert Pearson | 235 | 0.5 | New | |
| Majority | 1,077 | 2.1 | |||
| Turnout | 50,760 | 75.4 | |||
| Labour hold | Swing | ||||
Elections in the 1970s edit
| Party | Candidate | Votes | % | ±% | |
|---|---|---|---|---|---|
| Labour | Ken Weetch | 34,444 | 48.2 | +2.9 | |
| Conservative | R. Erith | 30,703 | 42.9 | +0.1 | |
| Liberal | P. Keeling | 5,772 | 8.1 | -3.8 | |
| National Front | P. Robinson | 449 | 0.6 | New | |
| Workers Revolutionary | R. Hodge | 115 | 0.2 | New | |
| Majority | 3,741 | 5.3 | +2.8 | ||
| Turnout | 71,483 | 80.8 | +1.3 | ||
| Labour hold | Swing | +1.3 | |||
| Party | Candidate | Votes | % | ±% | |
|---|---|---|---|---|---|
| Labour | Ken Weetch | 31,566 | 45.3 | +4.5 | |
| Conservative | Ernle Money | 29,833 | 42.8 | +1.6 | |
| Liberal | R. B. Salt | 8,295 | 11.9 | -4.4 | |
| Majority | 1,733 | 2.5 | N/A | ||
| Turnout | 69,694 | 79.5 | -4.1 | ||
| Labour gain from Conservative | Swing | ||||
| Party | Candidate | Votes | % | ±% | |
|---|---|---|---|---|---|
| Conservative | Ernle Money | 29,893 | 41.2 | -2.9 | |
| Labour | Ken Weetch | 29,634 | 40.8 | -3.3 | |
| Liberal | Joan Ruby Knott | 11,857 | 16.3 | +8.1 | |
| National Democratic | David R. M. Brown | 1,161 | 1.6 | -2.1 | |
| Majority | 259 | 0.4 | +0.4 | ||
| Turnout | 72,545 | 83.6 | +10.9 | ||
| Conservative hold | Swing | ||||
| Party | Candidate | Votes | % | ±% | |
|---|---|---|---|---|---|
| Conservative | Ernle Money | 27,704 | 44.1 | +5.5 | |
| Labour | Dingle Foot | 27,691 | 44.1 | -5.8 | |
| Liberal | Neville S. Lewis | 5,147 | 8.2 | -2.0 | |
| National Democratic | David R. M. Brown | 2,322 | 3.7 | +2.4 | |
| Majority | 13 | 0.0 | N/A | ||
| Turnout | 62,864 | 72.7 | -4.8 | ||
| Conservative gain from Labour | Swing | ||||
Elections in the 1960s edit
| Party | Candidate | Votes | % | ±% | |
|---|---|---|---|---|---|
| Labour | Dingle Foot | 30,313 | 49.9 | +10.1 | |
| Conservative | Trevor A. Hagger | 23,440 | 38.6 | +2.8 | |
| Liberal | Stanley Rundle | 6,200 | 10.2 | -13.6 | |
| National Democratic | David R. M. Brown | 769 | 1.3 | +0.7 | |
| Majority | 6,873 | 11.3 | +9.4 | ||
| Turnout | 60,722 | 77.5 | -1.5 | ||
| Labour hold | Swing | ||||
| Party | Candidate | Votes | % | ±% | |
|---|---|---|---|---|---|
| Labour | Dingle Foot | 24,648 | 39.8 | −1.3 | |
| Conservative | Trevor A. Hagger | 22,216 | 35.8 | −0.2 | |
| Liberal | Manuela Sykes | 14,755 | 23.8 | +1.0 | |
| National Democratic | David R. M. Brown | 349 | 0.6 | New | |
| Majority | 2,432 | 3.9 | −1.2 | ||
| Turnout | 61,968 | 79.0 | −1.9 | ||
| Labour hold | Swing | −0.5 | |||
Elections in the 1950s edit
| Party | Candidate | Votes | % | ±% | |
|---|---|---|---|---|---|
| Labour | Dingle Foot | 25,858 | 41.1 | −4.7 | |
| Conservative | John C. Cobbold | 22,623 | 36.0 | +3.4 | |
| Liberal | Manuela Sykes | 14,359 | 22.8 | +1.4 | |
| Majority | 3,235 | 5.1 | −8.1 | ||
| Turnout | 62,840 | 80.9 | +0.4 | ||
| Labour hold | Swing | −4.0 | |||
| Party | Candidate | Votes | % | ±% | |
|---|---|---|---|---|---|
| Labour | Dingle Foot | 26,898 | 45.8 | −7.1 | |
| Conservative | John C. Cobbold | 19,161 | 32.6 | −14.5 | |
| Liberal | Manuela Sykes | 12,587 | 21.4 | New | |
| Majority | 7,737 | 13.2 | +7.4 | ||
| Turnout | 27,405 | ||||
| Labour hold | Swing | +3.7 | |||
| Party | Candidate | Votes | % | ±% | |
|---|---|---|---|---|---|
| Labour | Richard Stokes | 32,306 | 52.9 | -0.5 | |
| Conservative | John C. Cobbold | 28,724 | 47.1 | +0.5 | |
| Majority | 3,582 | 5.8 | -1.0 | ||
| Turnout | 61,030 | 80.5 | -4.7 | ||
| Labour hold | Swing | ||||
| Party | Candidate | Votes | % | ±% | |
|---|---|---|---|---|---|
| Labour | Richard Stokes | 33,463 | 53.4 | +6.5 | |
| Conservative | Albert E. Holdsworth | 29,227 | 46.6 | +6.8 | |
| Majority | 4,236 | 6.8 | -0.3 | ||
| Turnout | 62,690 | 85.2 | -1.6 | ||
| Labour hold | Swing | ||||
| Party | Candidate | Votes | % | ±% | |
|---|---|---|---|---|---|
| Labour | Richard Stokes | 29,386 | 46.9 | -2.4 | |
| Conservative | S. W. L. Ripley | 24,993 | 39.8 | +5.7 | |
| Liberal | J. C. Seward | 8,340 | 13.3 | -3.2 | |
| Majority | 4,393 | 7.1 | -8.1 | ||
| Turnout | 62,719 | 86.8 | +6.7 | ||
| Labour hold | Swing | ||||
Election in the 1940s edit
| Party | Candidate | Votes | % | ±% | |
|---|---|---|---|---|---|
| Labour | Richard Stokes | 26,296 | 49.3 | +6.6 | |
| Conservative | Frank Guy Clavering Fison | 18,177 | 34.1 | -23.2 | |
| Liberal | Duncan Mackay Mowat | 8,819 | 16.5 | New | |
| Majority | 8,119 | 15.2 | N/A | ||
| Turnout | 53,292 | 80.1 | -2.0 | ||
| Labour gain from Conservative | Swing | ||||
Elections in the 1930s edit
| Party | Candidate | Votes | % | ±% | |
|---|---|---|---|---|---|
| Labour | Richard Stokes | 27,604 | 53.0 | +10.3 | |
| Conservative | Henry Willink | 24,443 | 47.0 | -10.3 | |
| Majority | 3,161 | 6.0 | N/A | ||
| Turnout | 52,047 | ||||
| Labour gain from Conservative | Swing | ||||
| Party | Candidate | Votes | % | ±% | |
|---|---|---|---|---|---|
| Conservative | John Ganzoni | 28,528 | 57.3 | -5.7 | |
| Labour | Robert Jackson | 21,278 | 42.7 | +5.7 | |
| Majority | 7,250 | 14.6 | -11.4 | ||
| Turnout | 49,806 | 82.1 | -0.8 | ||
| Conservative hold | Swing | ||||
| Party | Candidate | Votes | % | ±% | |
|---|---|---|---|---|---|
| Conservative | John Ganzoni | 29,782 | 63.0 | +23.7 | |
| Labour | Robert Jackson | 17,490 | 37.0 | -0.7 | |
| Majority | 12,292 | 26.0 | +24.0 | ||
| Turnout | 47,272 | 82.9 | -2.8 | ||
| Conservative hold | Swing | ||||
Elections in the 1920s edit
| Party | Candidate | Votes | % | ±% | |
|---|---|---|---|---|---|
| Unionist | John Ganzoni | 18,527 | 39.7 | −15.7 | |
| Labour | Robert Jackson | 17,592 | 37.7 | −6.9 | |
| Liberal | Frank Ongley Darvall | 10,559 | 22.6 | New | |
| Majority | 935 | 2.0 | −8.8 | ||
| Turnout | 46,678 | 85.7 | −2.0 | ||
| Registered electors | 54,474 | ||||
| Unionist hold | Swing | −4.4 | |||
| Party | Candidate | Votes | % | ±% | |
|---|---|---|---|---|---|
| Unionist | John Ganzoni | 19,621 | 55.4 | +6.1 | |
| Labour | Robert Jackson | 15,791 | 44.6 | −6.1 | |
| Majority | 3,830 | 10.8 | N/A | ||
| Turnout | 35,412 | 87.7 | +9.0 | ||
| Registered electors | 40,379 | ||||
| Unionist gain from Labour | Swing | +6.1 | |||
| Party | Candidate | Votes | % | ±% | |
|---|---|---|---|---|---|
| Labour | Robert Jackson | 15,824 | 50.7 | +4.1 | |
| Unionist | John Ganzoni | 15,364 | 49.3 | −4.1 | |
| Majority | 460 | 1.4 | N/A | ||
| Turnout | 31,188 | 78.7 | −3.7 | ||
| Registered electors | 39,606 | ||||
| Labour gain from Unionist | Swing | +4.1 | |||
| Party | Candidate | Votes | % | ±% | |
|---|---|---|---|---|---|
| Unionist | John Ganzoni | 17,134 | 53.4 | −0.1 | |
| Labour | Robert Jackson | 14,924 | 46.6 | +14.5 | |
| Majority | 2,210 | 6.8 | −14.6 | ||
| Turnout | 32,058 | 82.4 | +14.5 | ||
| Registered electors | 38,924 | ||||
| Unionist hold | Swing | −7.3 | |||
Elections in the 1910s edit
| Party | Candidate | Votes | % | ±% | |
|---|---|---|---|---|---|
| C | Unionist | John Ganzoni | 13,553 | 53.5 | +5.4 |
| Labour | Robert Jackson | 8,143 | 32.1 | New | |
| Liberal | George Hay Morgan | 3,663 | 14.4 | −37.5 | |
| Majority | 5,410 | 21.4 | N/A | ||
| Turnout | 25,359 | 67.9 | −22.0 | ||
| Registered electors | 37,348 | ||||
| Unionist hold | Swing | ||||
| C indicates candidate endorsed by the coalition government. | |||||
- Change of vote share and swing calculated from the December 1910 party ticket vote.
General election 1914/15:
Another general election was required to take place before the end of 1915. The political parties had been making preparations for an election to take place and by July 1914, the following candidates had been selected;
- Unionist: John Ganzoni
- Liberal: Daniel Ford Goddard
- Independent Labour: Robert Jackson (not supported by Labour Party HQ)

| Party | Candidate | Votes | % | ±% | |
|---|---|---|---|---|---|
| Unionist | John Ganzoni | 6,406 | 50.6 | +2.5 | |
| Liberal | Charles Masterman | 5,874 | 46.3 | −5.6 | |
| Independent Labour | John Scurr | 395 | 3.1 | New | |
| Majority | 532 | 4.3 | N/A | ||
| Turnout | 12,675 | 91.4 | +1.5 | ||
| Registered electors | 13,870 | ||||
| Unionist gain from Liberal | Swing | +4.1 | |||

| Party | Candidate | Votes | % | ±% | |
|---|---|---|---|---|---|
| Liberal | Daniel Ford Goddard | 5,931 | 26.2 | +0.1 | |
| Liberal | Silvester Horne | 5,791 | 25.7 | +0.2 | |
| Conservative | Arthur Churchman | 5,447 | 24.1 | −0.2 | |
| Conservative | Bunnell Henry Burton | 5,409 | 24.0 | −0.1 | |
| Turnout | 22,578 | 89.9 | −3.4 | ||
| Registered electors | 12,641 | ||||
| Majority | 344 | 1.6 | +0.4 | ||
| Liberal hold | Swing | +0.2 | |||
| Liberal hold | Swing | +0.2 | |||

| Party | Candidate | Votes | % | ±% | |
|---|---|---|---|---|---|
| Liberal | Daniel Ford Goddard | 6,120 | 26.1 | −3.7 | |
| Liberal | Silvester Horne | 5,958 | 25.5 | −3.7 | |
| Conservative | Arthur Churchman | 5,690 | 24.3 | +3.0 | |
| Conservative | Bunnell Henry Burton | 5,645 | 24.1 | +4.4 | |
| Turnout | 23,413 | 93.3 | +3.9 | ||
| Registered electors | 12,641 | ||||
| Majority | 268 | 1.2 | −6.7 | ||
| Liberal hold | Swing | −3.4 | |||
| Liberal hold | Swing | −4.1 | |||
Elections in the 1900s edit

| Party | Candidate | Votes | % | ±% | |
|---|---|---|---|---|---|
| Liberal | Daniel Ford Goddard | 6,396 | 29.8 | +3.9 | |
| Liberal | Felix Cobbold | 6,290 | 29.2 | +3.8 | |
| Conservative | Charles Dalrymple | 4,591 | 21.3 | −4.5 | |
| Conservative | Samuel Hoare | 4,232 | 19.7 | −4.2 | |
| Majority | 1,699 | 7.9 | +5.9 | ||
| Turnout | 21,509 | 89.4 | +5.8 | ||
| Registered electors | 12,146 | ||||
| Liberal hold | Swing | +4.2 | |||
| Liberal gain from Conservative | Swing | +4.2 | |||
| Party | Candidate | Votes | % | ±% | |
|---|---|---|---|---|---|
| Liberal | Daniel Ford Goddard | 4,557 | 25.9 | +0.3 | |
| Conservative | Charles Dalrymple | 4,527 | 25.8 | +0.8 | |
| Liberal | Noel Buxton | 4,283 | 24.4 | −0.4 | |
| Conservative | J. F. P. Rawlinson | 4,207 | 23.9 | −0.7 | |
| Turnout | 17,574 | 83.6 | −6.8 | ||
| Registered electors | 10,646 | ||||
| Majority | 350 | 2.0 | +1.0 | ||
| Liberal hold | Swing | −0.5 | |||
| Majority | 244 | 1.4 | +1.2 | ||
| Conservative hold | Swing | +0.6 | |||
Elections in the 1890s edit
| Party | Candidate | Votes | % | ±% | |
|---|---|---|---|---|---|
| Liberal | Daniel Ford Goddard | 4,396 | 25.6 | +1.1 | |
| Conservative | Charles Dalrymple | 4,293 | 25.0 | −1.2 | |
| Liberal | Arthur Soames | 4,250 | 24.8 | +1.3 | |
| Conservative | Hugo Charteris | 4,219 | 24.6 | −1.2 | |
| Turnout | 8,696 (est.) | 90.4 | +0.7 | ||
| Registered electors | 9,619 | ||||
| Majority | 177 | 1.0 | N/A | ||
| Liberal gain from Conservative | Swing | +1.2 | |||
| Majority | 43 | 0.2 | −1.1 | ||
| Conservative hold | Swing | −1.3 | |||
| Party | Candidate | Votes | % | ±% | |
|---|---|---|---|---|---|
| Conservative | Charles Dalrymple | 4,350 | 26.2 | −0.4 | |
| Conservative | Hugo Charteris | 4,277 | 25.8 | −0.9 | |
| Liberal | Daniel Ford Goddard | 4,054 | 24.5 | +1.0 | |
| Liberal | Arthur Soames | 3,888 | 23.5 | +0.3 | |
| Turnout | 8,417 (est.) | 89.7 | +7.9 | ||
| Registered electors | 9,619 | ||||
| Majority | 223 | 1.3 | −1.8 | ||
| Conservative hold | Swing | −0.7 | |||
| Conservative hold | Swing | −0.6 | |||
Elections in the 1880s edit
| Party | Candidate | Votes | % | ±% | |
|---|---|---|---|---|---|
| Conservative | Hugo Charteris | 3,846 | 26.7 | +1.8 | |
| Conservative | Charles Dalrymple | 3,838 | 26.6 | +2.2 | |
| Liberal | Sydney Stern | 3,386 | 23.5 | −1.9 | |
| Liberal | Benjamin Thomas Lindsay Thomson[49] | 3,334 | 23.2 | −2.1 | |
| Turnout | 7,252 | 81.8 | −4.2 | ||
| Registered electors | 8,867 | ||||
| Majority | 452 | 3.1 | N/A | ||
| Conservative gain from Liberal | Swing | +1.9 | |||
| Conservative gain from Liberal | Swing | +2.2 | |||
| Party | Candidate | Votes | % | ±% | |
|---|---|---|---|---|---|
| Conservative | Charles Dalrymple | 3,687 | 25.2 | +0.3 | |
| Conservative | Hugo Charteris | 3,662 | 25.1 | +0.7 | |
| Liberal | Lord John Harvey | 3,635 | 24.9 | −0.5 | |
| Liberal | Horace Davey | 3,627 | 24.8 | −0.5 | |
| Turnout | 7,371 | 83.1 | −2.9 | ||
| Registered electors | 8,867 | ||||
| Majority | 27 | 0.2 | N/A | ||
| Conservative gain from Liberal | Swing | +0.4 | |||
| Conservative gain from Liberal | Swing | +0.6 | |||
- Caused by the 1885 election being declared void on account of bribery.[50]
| Party | Candidate | Votes | % | ±% | |
|---|---|---|---|---|---|
| Liberal | Henry Wyndham West | 3,795 | 25.4 | +0.6 | |
| Liberal | Jesse Collings | 3,777 | 25.3 | +0.1 | |
| Conservative | Edward Murray Ind[51] | 3,717 | 24.9 | −0.8 | |
| Conservative | William Thomas Charley | 3,649 | 24.4 | 0.0 | |
| Turnout | 7,623 | 86.0 | +3.5 (est.) | ||
| Registered electors | 8,867 | ||||
| Majority | 60 | 0.4 | −0.4 | ||
| Liberal hold | Swing | +0.7 | |||
| Liberal gain from Conservative | Swing | +0.1 | |||
| Party | Candidate | Votes | % | ±% | |
|---|---|---|---|---|---|
| Liberal | Henry Wyndham West | 3,266 | 53.7 | +3.7 | |
| Conservative | William Thomas Charley | 2,816 | 46.3 | −3.8 | |
| Majority | 450 | 7.4 | N/A | ||
| Turnout | 6,082 | 76.9 | −5.6 (est.) | ||
| Registered electors | 7,914 | ||||
| Liberal gain from Conservative | Swing | +3.8 | |||
- Caused by Cobbold's death.
| Party | Candidate | Votes | % | ±% | |
|---|---|---|---|---|---|
| Conservative | Thomas Cobbold | 3,142 | 25.7 | −2.9 | |
| Liberal | Jesse Collings | 3,074 | 25.2 | +1.8 | |
| Liberal | Henry Wyndham West | 3,025 | 24.8 | +3.1 | |
| Conservative | James Redfoord Bulwer | 2,979 | 24.4 | −2.0 | |
| Turnout | 6,110 (est.) | 82.5 (est.) | +1.6 | ||
| Registered electors | 7,406 | ||||
| Majority | 68 | 0.5 | −2.5 | ||
| Conservative hold | Swing | −3.0 | |||
| Majority | 95 | 0.8 | N/A | ||
| Liberal gain from Conservative | Swing | +1.9 | |||
Elections in the 1870s edit
| Party | Candidate | Votes | % | ±% | |
|---|---|---|---|---|---|
| Conservative | Thomas Cobbold | 2,213 | 57.9 | +2.9 | |
| Lib-Lab | William Newton | 1,607 | 42.1 | −3.0 | |
| Majority | 606 | 15.8 | +12.8 | ||
| Turnout | 3,820 | 51.6 | −29.3 | ||
| Registered electors | 7,406 | ||||
| Conservative hold | Swing | +3.0 | |||
- Caused by Cobbold's death.
| Party | Candidate | Votes | % | ±% | |
|---|---|---|---|---|---|
| Conservative | John Cobbold | 3,059 | 28.6 | +13.0 | |
| Conservative | James Redfoord Bulwer | 2,827 | 26.4 | +10.8 | |
| Liberal | Hugh Adair | 2,506 | 23.4 | −12.0 | |
| Liberal | Henry Wyndham West | 2,322 | 21.7 | −11.8 | |
| Majority | 321 | 3.0 | N/A | ||
| Turnout | 5,357 (est.) | 80.9 (est.) | +0.5 | ||
| Registered electors | 6,619 | ||||
| Conservative gain from Liberal | Swing | +12.5 | |||
| Conservative gain from Liberal | Swing | +11.3 | |||
Elections in the 1860s edit
| Party | Candidate | Votes | % | ±% | |
|---|---|---|---|---|---|
| Liberal | Hugh Adair | 2,321 | 35.4 | +7.7 | |
| Liberal | Henry Wyndham West | 2,195 | 33.5 | +8.2 | |
| Conservative | John Cobbold | 2,044 | 31.2 | −15.8 | |
| Majority | 151 | 2.3 | 0.0 | ||
| Turnout | 4,302 (est.) | 80.4 (est.) | −4.1 | ||
| Registered electors | 5,352 | ||||
| Liberal hold | Swing | +7.8 | |||
| Liberal gain from Conservative | Swing | +8.1 | |||
| Party | Candidate | Votes | % | ±% | |
|---|---|---|---|---|---|
| Liberal | Hugh Adair | 992 | 27.7 | −1.0 | |
| Conservative | John Cobbold | 910 | 25.4 | −5.1 | |
| Liberal | Henry Wyndham West | 904 | 25.3 | +12.4 | |
| Conservative | William Tidmas[53] | 774 | 21.6 | −6.4 | |
| Turnout | 1,790 (est.) | 84.5 (est.) | +5.8 | ||
| Registered electors | 2,118 | ||||
| Majority | 82 | 2.3 | +1.6 | ||
| Liberal hold | Swing | +3.4 | |||
| Majority | 6 | 0.1 | −1.7 | ||
| Conservative hold | Swing | −5.4 | |||
Elections in the 1850s edit
| Party | Candidate | Votes | % | ±% | |
|---|---|---|---|---|---|
| Conservative | John Cobbold | 918 | 30.5 | +4.4 | |
| Liberal | Hugh Adair | 864 | 28.7 | +3.3 | |
| Conservative | Henry Selwin | 842 | 28.0 | +4.3 | |
| Liberal | John King[54] | 388 | 12.9 | −11.8 | |
| Turnout | 1,506 (est.) | 78.7 (est.) | −0.3 | ||
| Registered electors | 1,914 | ||||
| Majority | 54 | 1.8 | +1.1 | ||
| Conservative hold | Swing | +4.3 | |||
| Majority | 22 | 0.7 | −1.0 | ||
| Liberal hold | Swing | −0.5 | |||
| Party | Candidate | Votes | % | ±% | |
|---|---|---|---|---|---|
| Conservative | John Cobbold | 780 | 26.1 | −0.5 | |
| Whig | Hugh Adair | 759 | 25.4 | −0.3 | |
| Whig | John Clark Marshman[55] | 738 | 24.7 | +0.9 | |
| Conservative | Henry Selwin | 709 | 23.7 | −0.1 | |
| Turnout | 1,493 (est.) | 79.0 (est.) | −3.7 | ||
| Registered electors | 1,891 | ||||
| Majority | 21 | 0.7 | −0.2 | ||
| Conservative hold | Swing | −0.4 | |||
| Majority | 50 | 1.7 | −0.2 | ||
| Whig hold | Swing | 0.0 | |||
| Party | Candidate | Votes | % | ±% | |
|---|---|---|---|---|---|
| Conservative | John Cobbold | 809 | 26.6 | −3.6 | |
| Whig | Hugh Adair | 782 | 25.7 | −0.1 | |
| Radical | Thomas Hobhouse[56][57][58][59] | 725 | 23.8 | N/A | |
| Conservative | Samuel Bateson[60] | 725 | 23.8 | −0.3 | |
| Turnout | 1,521 (est.) | 82.7 (est.) | +2.7 | ||
| Registered electors | 1,838 | ||||
| Majority | 27 | 0.9 | -3.5 | ||
| Conservative hold | Swing | −1.8 | |||
| Majority | 57 | 1.9 | +0.2 | ||
| Whig hold | Swing | +1.9 | |||
Elections in the 1840s edit
| Party | Candidate | Votes | % | ±% | |
|---|---|---|---|---|---|
| Conservative | John Cobbold | 829 | 30.2 | +6.1 | |
| Whig | Hugh Adair | 708 | 25.8 | −26.2 | |
| Conservative | John Neilson Gladstone | 661 | 24.1 | +0.2 | |
| Chartist | Henry Vincent | 546 | 19.9 | N/A | |
| Turnout | 1,372 (est.) | 80.0 (est.) | +0.3 | ||
| Registered electors | 1,714 | ||||
| Majority | 121 | 4.4 | N/A | ||
| Conservative gain from Whig | Swing | +9.6 | |||
| Majority | 47 | 1.7 | −0.2 | ||
| Whig hold | Swing | −16.3 | |||
| Party | Candidate | Votes | % | ±% | |
|---|---|---|---|---|---|
| Conservative | John Neilson Gladstone | 651 | 28.1 | +4.0 | |
| Conservative | Sackville Lane-Fox | 641 | 27.7 | +3.8 | |
| Whig | David Thornbury | 548 | 23.7 | −28.3 | |
| Chartist | Henry Vincent | 473 | 20.4 | New | |
| Radical | John Nicholson | 2 | 0.0 | N/A | |
| Majority | 93 | 4.0 | N/A | ||
| Turnout | 1,158 (est.) | 71.5 (est.) | −8.2 | ||
| Registered electors | 1,704 | ||||
| Conservative gain from Whig | Swing | +9.1 | |||
| Conservative gain from Whig | Swing | +9.0 | |||
- Caused by the earlier by-election being declared void on petition, due to bribery by Cuffe's and Gladstone's agents, on 30 July 1842.[61]
| Party | Candidate | Votes | % | ±% | |
|---|---|---|---|---|---|
| Conservative | John Cuffe | 680 | 27.9 | +3.8 | |
| Conservative | Thomas Gladstone | 673 | 27.6 | +3.7 | |
| Whig | Thomas Gisborne | 543 | 22.3 | −29.7 | |
| Radical | George Moffatt[62] | 541 | 22.2 | N/A | |
| Radical | John Nicholson | 3 | 0.1 | N/A | |
| Majority | 130 | 5.3 | N/A | ||
| Turnout | 1,220 (est.) | 75.4 (est.) | −4.3 | ||
| Registered electors | 1,619 | ||||
| Conservative gain from Whig | Swing | +9.3 | |||
| Conservative gain from Whig | Swing | +9.3 | |||
- Caused by the general election result being declared void on petition, due to bribery by Wason's and Rennie's agents, on 25 April 1842[63]
| Party | Candidate | Votes | % | ±% | |
|---|---|---|---|---|---|
| Whig | Rigby Wason | 659 | 26.0 | +1.1 | |
| Whig | George Rennie | 657 | 26.0 | +1.0 | |
| Conservative | Fitzroy Kelly | 611 | 24.1 | −0.8 | |
| Conservative | John Charles Herries | 604 | 23.9 | −1.3 | |
| Majority | 46 | 1.9 | +1.8 | ||
| Turnout | c. 1,266 | c. 79.7 | c. −9.3 | ||
| Registered electors | 1,587 | ||||
| Whig hold | Swing | +1.1 | |||
| Whig gain from Conservative | Swing | +1.0 | |||
Elections in the 1830s edit
| Party | Candidate | Votes | % | ±% | |
|---|---|---|---|---|---|
| Conservative | Thomas John Cochrane | 621 | 50.2 | +0.1 | |
| Whig | Thomas Milner Gibson | 615 | 49.8 | −0.1 | |
| Majority | 6 | 0.4 | +0.2 | ||
| Turnout | 1,236 | 87.2 | −1.8 | ||
| Registered electors | 1,418 | ||||
| Conservative hold | Swing | +0.1 | |||
- Caused by Gibson's defection to the Whigs.
| Party | Candidate | Votes | % | ±% | |
|---|---|---|---|---|---|
| Conservative | Thomas Milner Gibson | 601 | 25.2 | −0.5 | |
| Whig | Henry Tufnell | 595 | 25.0 | +1.1 | |
| Conservative | Fitzroy Kelly | 593 | 24.9 | −0.9 | |
| Whig | Rigby Wason | 593 | 24.9 | +0.3 | |
| Turnout | 1,262 | 89.0 | −1.2 | ||
| Registered electors | 1,418 | ||||
| Majority | 6 | 0.2 | −0.9 | ||
| Conservative hold | Swing | −0.6 | |||
| Majority | 2 | 0.1 | N/A | ||
| Whig gain from Conservative | Swing | +0.9 | |||
- Tufnell was later unseated on petition, and Kelly was returned in his place
| Party | Candidate | Votes | % | ±% | |
|---|---|---|---|---|---|
| Whig | James Morrison | 542 | 27.6 | +3.7 | |
| Whig | Rigby Wason | 533 | 27.2 | +2.6 | |
| Conservative | Horatio George Broke | 454 | 23.1 | −2.7 | |
| Conservative | William Holmes | 434 | 22.1 | −3.6 | |
| Majority | 79 | 4.1 | N/A | ||
| Turnout | 992 | 82.1 | −8.1 | ||
| Registered electors | 1,209 | ||||
| Whig gain from Conservative | Swing | +3.4 | |||
| Whig gain from Conservative | Swing | +2.9 | |||
- Caused by the 1835 election being declared void on petition
| Party | Candidate | Votes | % | ±% | |
|---|---|---|---|---|---|
| Conservative | Fitzroy Kelly | 557 | 25.8 | +11.4 | |
| Conservative | Robert Dundas | 555 | 25.7 | +4.3 | |
| Whig | Rigby Wason | 531 | 24.6 | −7.4 | |
| Whig | James Morrison | 516 | 23.9 | −8.4 | |
| Majority | 24 | 1.1 | N/A | ||
| Turnout | 1,090 | 90.2 | +12.0 | ||
| Registered electors | 1,209 | ||||
| Conservative gain from Whig | Swing | +9.7 | |||
| Conservative gain from Whig | Swing | +6.1 | |||
| Party | Candidate | Votes | % | ±% | |
|---|---|---|---|---|---|
| Whig | James Morrison | 599 | 32.3 | +2.7 | |
| Whig | Rigby Wason | 593 | 32.0 | +2.5 | |
| Tory | Edward Goulburn | 303 | 16.3 | N/A | |
| Tory | Fitzroy Kelly | 267 | 14.4 | N/A | |
| Tory | Charles Mackinnon | 94 | 5.1 | −15.3 | |
| Majority | 290 | 15.7 | +6.6 | ||
| Turnout | 953 | 78.2 | c. +8.8 | ||
| Registered electors | 1,219 | ||||
| Whig hold | Swing | +5.2 | |||
| Whig hold | Swing | +5.1 | |||
| Party | Candidate | Votes | % | ±% | |
|---|---|---|---|---|---|
| Whig | James Morrison | 468 | 29.6 | +21.8 | |
| Whig | Rigby Wason | 467 | 29.5 | +21.7 | |
| Tory | Charles Mackinnon | 323 | 20.4 | −21.8 | |
| Tory | Robert FitzRoy | 323 | 20.4 | −21.8 | |
| Majority | 144 | 9.1 | N/A | ||
| Turnout | 798 | c. 69.4 | c. +21.1 | ||
| Registered electors | c. 1,150 | ||||
| Whig gain from Tory | Swing | +21.8 | |||
| Whig gain from Tory | Swing | +21.8 | |||
| Party | Candidate | Votes | % | ±% | |
|---|---|---|---|---|---|
| Tory | Robert Dundas | 406 | 42.2 | ||
| Tory | Charles Mackinnon | 406 | 42.2 | ||
| Whig | John Disney | 150 | 15.6 | ||
| Majority | 256 | 26.6 | |||
| Turnout | 556 | c. 48.3 | |||
| Registered electors | c. 1,150 | ||||
| Tory gain from Whig | Swing | ||||
| Tory gain from Whig | Swing | ||||
Elections in the 1820s edit
| Party | Candidate | Votes | % | ±% | |
|---|---|---|---|---|---|
| Whig | William Haldimand | 496 | |||
| Whig | Robert Torrens | 495 | |||
| Tory | Robert Dundas | 488 | |||
| Tory | Charles Mackinnon | 488 | |||
| Majority | 7 | ||||
| Turnout | 1,003 | ||||
| Registered electors | |||||
| Whig hold | Swing | ||||
| Whig hold | Swing | ||||
- After a successful electoral petition, Dundas and Mackinnon were declared elected.[15]
| Party | Candidate | Votes | % | ±% | |
|---|---|---|---|---|---|
| Whig | William Haldimand | 483 / 428 | |||
| Whig | Thomas Barrett-Lennard | 482 / 427 | |||
| Tory | Robert Crickitt | 474 / 430 | |||
| Tory | Charles Mackinnon | 468 / 424 | |||
| Majority | 3 | ||||
| Turnout | 1,709 | ||||
| Registered electors | |||||
| Whig gain from Tory | Swing | ||||
| Whig gain from Tory | Swing | ||||
- Figures are shown pre and post scrutiny. After a successful electoral petition, Haldimand and Barrett-Lennard were declared elected.[15]
Elections in the 1810s edit
| Party | Candidate | Votes | % | ±% | |
|---|---|---|---|---|---|
| Tory | Robert Crickitt | 428 / 394 | |||
| Tory | William Newton | 422 / 387 | |||
| Whig | Henry Baring | 389 / 356 | |||
| Whig | William Bolton | 362 / 335 | |||
| Majority | 31 | ||||
| Turnout | 1,472 | ||||
| Registered electors | |||||
| Tory hold | |||||
| Tory hold | |||||
- Figures are shown pre and post scrutiny.[15]
| Party | Candidate | Votes | % | ±% | |
|---|---|---|---|---|---|
| Tory | Robert Crickitt | Unopposed | N/A | N/A | |
| Tory | John Round | Unopposed | N/A | N/A | |
| Registered electors | |||||
| Tory hold | |||||
| Tory hold | |||||
Elections in the 1800s edit
| Party | Candidate | Votes | % | ±% | |
|---|---|---|---|---|---|
| Tory | Home Riggs Popham | 397 | |||
| Tory | Robert Crickitt | 388 | |||
| Whig | Richard Wilson | 327 | |||
| Whig | R H A Bennett | 320 | |||
| Majority | 61 | ||||
| Turnout | 1,432 | ||||
| Registered electors | |||||
| Tory gain from Whig | Swing | ||||
| Tory gain from Whig | Swing | ||||
| Party | Candidate | Votes | % | ±% | |
|---|---|---|---|---|---|
| Whig | Richard Wilson | 367 | |||
| Whig | Robert Stopford | 358 | |||
| Tory | Robert Crickitt | 182 | |||
| Tory | John Gibbons | 176 | |||
| Majority | 176 | ||||
| Turnout | 1,083 | ||||
| Registered electors | |||||
| Whig gain from Tory | Swing | ||||
| Whig hold | Swing | ||||
| Party | Candidate | Votes | % | ±% | |
|---|---|---|---|---|---|
| William Middleton | Unopposed | N/A | N/A | ||
| Registered electors | |||||
- Caused by the death of Charles Crickitt
| Party | Candidate | Votes | % | ±% | |
|---|---|---|---|---|---|
| Tory | Andrew Hamond | Unopposed | N/A | N/A | |
| Tory | Charles Crickitt | Unopposed | N/A | N/A | |
| Registered electors | |||||
| Tory hold | |||||
| Tory hold | |||||
Elections in the 1790s edit
| Party | Candidate | Votes | % | ±% | |
|---|---|---|---|---|---|
| Tory | Andrew Hamond | 402 | |||
| Tory | Charles Crickitt | 382 | |||
| Whig | William Middleton | 311 | |||
| Majority | 71 | ||||
| Turnout | |||||
| Registered electors | |||||
| Tory gain from Whig | Swing | ||||
| Tory hold | Swing | ||||
| Party | Candidate | Votes | % | ±% | |
|---|---|---|---|---|---|
| Whig | John D'Oyly | 322 | |||
| Tory | Charles Crickitt | 313 | |||
| Tory | William Middleton | 299 | |||
| Whig | George Rochfort | 243 | |||
| Majority | 14 | ||||
| Turnout | |||||
| Registered electors | |||||
| Whig hold | Swing | ||||
| Tory hold | Swing | ||||
Elections in the 1780s edit
| Party | Candidate | Votes | % | ±% | |
|---|---|---|---|---|---|
| Tory | Charles Crickitt | 353 | |||
| Whig | Robert Thornton | 185 | |||
| Majority | 168 | ||||
| Turnout | 538 | ||||
| Registered electors | |||||
| Tory gain from Whig | Swing | ||||
- By election called after the election of John Cator was declared void
| Party | Candidate | Votes | % | ±% | |
|---|---|---|---|---|---|
| Tory | William Middleton | 460 | |||
| Whig | John Cator | 297 | |||
| Tory | Charles Crickitt | 7 | |||
| Majority | 290 | ||||
| Turnout | |||||
| Registered electors | |||||
| Tory gain from Whig | Swing | ||||
| Whig hold | Swing | ||||
| Party | Candidate | Votes | % | ±% | |
|---|---|---|---|---|---|
| Whig | William Wollaston | 346 | |||
| Whig | Thomas Staunton | 341 | |||
| Tory | Joshua Grigby | 253 | |||
| Tory | William Middleton | 247 | |||
| Majority | 92 | ||||
| Turnout | |||||
| Registered electors | |||||
| Whig hold | Swing | ||||
| Whig hold | Swing | ||||
Elections in the 1770s edit
| Party | Candidate | Votes | % | ±% | |
|---|---|---|---|---|---|
| Whig | William Wollaston | 357 | |||
| Whig | Thomas Staunton | 205 | |||
| Tory | Francis Vernon | 160 | |||
| Majority | 45 | ||||
| Turnout | |||||
| Registered electors | |||||
| Whig hold | Swing | ||||
| Whig hold | Swing | ||||
Elections in the 1760s edit
| Party | Candidate | Votes | % | ±% | |
|---|---|---|---|---|---|
| Whig | William Wollaston | 357 | |||
| Whig | Thomas Staunton | 357 | |||
| Tory | Wilbraham Tollemache | 289 | |||
| Tory | Edward Cruttenden | 287 | |||
| Majority | 68 | ||||
| Turnout | |||||
| Registered electors | |||||
| Whig hold | Swing | ||||
| Whig gain from Tory | Swing | ||||
| Party | Candidate | Votes | % | ±% | |
|---|---|---|---|---|---|
| Tory | Francis Vernon | Unopposed | |||
| Registered electors | |||||
| Tory hold | Swing | ||||
- Called when Vernon became a Commissioner for Trade and Plantations
| Party | Candidate | Votes | % | ±% | |
|---|---|---|---|---|---|
| Tory | Francis Vernon | Unopposed | |||
| Whig | Thomas Staunton | Unopposed | |||
| Registered electors | |||||
| Tory hold | Swing | ||||
| Whig hold | Swing | ||||
Elections in the 1750s edit
| Party | Candidate | Votes | % | ±% | |
|---|---|---|---|---|---|
| Whig | George Montgomerie | Unopposed | |||
| Registered electors | |||||
| Whig hold | Swing | ||||
- Called on the death of Samuel Kent
| Party | Candidate | Votes | % | ±% | |
|---|---|---|---|---|---|
| Whig | Thomas Staunton | Unopposed | |||
| Registered electors | |||||
| Whig gain from Tory | Swing | ||||
- Called on the death of Edward Vernon
| Party | Candidate | Votes | % | ±% | |
|---|---|---|---|---|---|
| Tory | Edward Vernon | Unopposed | |||
| Whig | Samuel Kent | Unopposed | |||
| Registered electors | |||||
| Tory hold | Swing | ||||
| Whig hold | Swing | ||||
- Unusually the Yellows supported in Edward Vernon[65] an identifiable Tory[14] and critic of the Whig government. The Blues meanwhile supported Samuel Kent and Richard Lloyd, both supporters of the Whig government. Although Lloyd would later withdraw[65] before that point it had proved an expensive contest for Vernon.[66]
Elections in the 1740s edit
| Party | Candidate | Votes | % | ±% | |
|---|---|---|---|---|---|
| Tory | Edward Vernon | Unopposed | |||
| Whig | Samuel Kent | Unopposed | |||
| Registered electors | |||||
| Tory hold | Swing | ||||
| Whig hold | Swing | ||||
| Party | Candidate | Votes | % | ±% | |
|---|---|---|---|---|---|
| Tory | Edward Vernon | 527 | |||
| Whig | Samuel Kent | 297 | |||
| Whig | Knox Ward | 224 | |||
| Majority | 73 | ||||
| Turnout | |||||
| Registered electors | |||||
| Tory gain from Whig | Swing | ||||
| Whig hold | Swing | ||||
Elections in the 1730s edit
| Party | Candidate | Votes | % | ±% | |
|---|---|---|---|---|---|
| Whig | Samuel Kent | 308 | |||
| Whig | William Wollaston | 296 | |||
| Tory | Edward Vernon | 215 | |||
| Tory | Philip Colman | 195 | |||
| Majority | 81 | ||||
| Turnout | |||||
| Registered electors | |||||
| Whig gain from Tory | Swing | ||||
| Whig hold | Swing | ||||
| Party | Candidate | Votes | % | ±% | |
|---|---|---|---|---|---|
| Whig | William Wollaston | Unopposed | |||
| Registered electors | |||||
| Whig hold | Swing | ||||
- Called on death of Francis Negus
| Party | Candidate | Votes | % | ±% | |
|---|---|---|---|---|---|
| Tory | Philip Broke | Unopposed | |||
| Registered electors | |||||
| Tory hold | Swing | ||||
- Called on William Thompson becoming a judge
Elections in the 1720s edit
| Party | Candidate | Votes | % | ±% | |
|---|---|---|---|---|---|
| Whig | Francis Negus | 438 | |||
| Whig | William Thompson | 396 | |||
| Tory | ? Crowley | 214 | |||
| Majority | 82 | ||||
| Turnout | |||||
| Registered electors | |||||
| Whig hold | Swing | ||||
| Whig hold | Swing | ||||
| Party | Candidate | Votes | % | ±% | |
|---|---|---|---|---|---|
| Whig | William Thompson | Unopposed | |||
| Registered electors | |||||
| Whig hold | Swing | ||||
- By-election called on William Thompson being made a Baron of the Exchequer
| Party | Candidate | Votes | % | ±% | |
|---|---|---|---|---|---|
| Whig | Francis Negus | Unopposed | |||
| Whig | William Thompson | Unopposed | |||
| Registered electors | |||||
| Whig hold | Swing | ||||
| Whig hold | Swing | ||||
Elections in the 1710s edit
| Party | Candidate | Votes | % | ±% | |
|---|---|---|---|---|---|
| Whig | Francis Negus | Unopposed | |||
| Registered electors | |||||
| Whig hold | Swing | ||||
- By-election called on William Churchill winning a government contract for stationary and resigning his seat as an office of profit to the crown. Instead of seeking re-election he stood in favour of his son in law Francis Negus.[68]
| Party | Candidate | Votes | % | ±% | |
|---|---|---|---|---|---|
| Whig | William Thompson | Unopposed | |||
| Registered electors | |||||
| Whig hold | Swing | ||||
- By-election called on William Thompson becoming Solicitor General
| Party | Candidate | Votes | % | ±% | |
|---|---|---|---|---|---|
| Whig | William Churchill | Unopposed | |||
| Whig | William Thompson | Unopposed | |||
| Registered electors | |||||
| Whig hold | Swing | ||||
| Whig hold | Swing | ||||
| Party | Candidate | Votes | % | ±% | |
|---|---|---|---|---|---|
| Whig | William Thompson | 270 | |||
| Whig | William Churchill | 265 | |||
| Tory | Orlando Bridgeman | 218 | |||
| Tory | Richard Richardson | 204 | |||
| Registered electors | |||||
| Whig gain from Tory | Swing | ||||
| Whig hold | Swing | ||||
- Successfully overturned through an electoral petition and Richardson and Bridgeman installed as MPs.
| Party | Candidate | Votes | % | ±% | |
|---|---|---|---|---|---|
| Tory | William Barker | 258 | |||
| Whig | William Churchill | 258 | |||
| Whig | William Thompson | 235 | |||
| Tory | Orlando Bridgeman | 172 | |||
| Registered electors | |||||
| Tory hold | Swing | ||||
| Whig hold | Swing | ||||
Elections in the 1700s edit
| Party | Candidate | Votes | % | ±% | |
|---|---|---|---|---|---|
| Whig | William Churchill | 303 | |||
| Tory | William Barker | 264 | |||
| Whig | Charles Whitaker | 157 | |||
| Registered electors | |||||
| Tory hold | Swing | ||||
| Whig hold | Swing | ||||
| Party | Candidate | Votes | % | ±% | |
|---|---|---|---|---|---|
| Whig | William Churchill | 188 | |||
| Tory | William Barker | 182 | |||
| Registered electors | |||||
| Whig hold | Swing | ||||
| Whig hold | Swing | ||||
- Called on the death of Henry Poley
| Party | Candidate | Votes | % | ±% | |
|---|---|---|---|---|---|
| Tory | John Bence | Unopposed | |||
| Tory | Henry Poley | Unopposed | |||
| Tory hold | Swing | ||||
| Tory gain from Whig | Swing | ||||
| Party | Candidate | Votes | % | ±% | |
|---|---|---|---|---|---|
| Tory | John Bence | ||||
| Whig | Charles Whitaker | ||||
| Tory | Richard Phillips | ||||
| Tory hold | Swing | ||||
| Tory gain from Whig | Swing | ||||
| Party | Candidate | Votes | % | ±% | |
|---|---|---|---|---|---|
| Whig | Charles Whitaker | 170 | |||
| Tory | Richard Phillips | 169 | |||
| Tory | John Bence | 126 | |||
| Tory hold | Swing | ||||
| Tory gain from Whig | Swing | ||||
| Party | Candidate | Votes | % | ±% | |
|---|---|---|---|---|---|
| Whig | Joseph Martin | 201 | |||
| Tory | Charles Duncombe | 185 | |||
| Tory | Richard Phillips | 94 | |||
| Whig hold | Swing | ||||
| Tory hold | Swing | ||||
Elections in the 1690s edit
| Party | Candidate | Votes | % | ±% | |
|---|---|---|---|---|---|
| Whig | Samuel Barnardiston | 149 | |||
| Tory | Richard Phillips | 147 | |||
| Whig | Charles Whitaker | 105 | |||
| Registered electors | |||||
| Whig hold | Swing | ||||
| Tory hold | Swing | ||||
| Party | Candidate | Votes | % | ±% | |
|---|---|---|---|---|---|
| Tory | Richard Phillips | Unopposed | |||
| Registered electors | |||||
| Tory hold | Swing | ||||
| Party | Candidate | Votes | % | ±% | |
|---|---|---|---|---|---|
| Tory | John Barker | ||||
| Whig | Charles Whitaker | ||||
| Tory | Charles Blois | ||||
| Whig | Samuel Barnardiston | ||||
| Registered electors | |||||
| Tory hold | Swing | ||||
| Tory hold | Swing | ||||
| Party | Candidate | Votes | % | ±% | |
|---|---|---|---|---|---|
| Tory | John Barker | 143 | |||
| Tory | Charles Blois | 110 | |||
| Whig | Charles Whitaker | 103 | |||
| Whig | John Hodges | 59 | |||
| Registered electors | |||||
| Tory hold | Swing | ||||
| Tory hold | Swing | ||||
Elections in the 1680s edit
| Party | Candidate | Votes | % | ±% | |
|---|---|---|---|---|---|
| Tory | Charles Blois | 111 | |||
| Whig | Samuel Barnardiston | 94 | |||
| Registered electors | |||||
| Tory gain from Whig | Swing | ||||
- Caused by Peyton Ventris becoming a Justice of the Common Pleas
| Party | Candidate | Votes | % | ±% | |
|---|---|---|---|---|---|
| Tory | John Barker | 170 | |||
| Whig | Peyton Ventris | 169 | |||
| Tory | Henry Felton | 58 | |||
| Registered electors | |||||
| Tory hold | Swing | ||||
| Whig gain from Tory | Swing | ||||
See also edit
Notes edit
- ^ A borough constituency (for the purposes of election expenses and type of returning officer).
- ^ As with all constituencies, the constituency elects one Member of Parliament (MP) by the first past the post system of election at least every five years.
References edit
- ^ "Electorate Figures – Boundary Commission for England". 2011 Electorate Figures. Boundary Commission for England. 4 March 2011. Archived from the original on 6 November 2010.
- ^ Winifred Stokes / R. G. Thorne (1986). "Ipswich". In Thorne, R. G. (ed.). The House of Commons 1790-1820. The History of Parliament Trust. Retrieved 25 November 2022.
- ^ Page 82,Lewis Namier, The Structure of Politics at the Accession of George III (2nd edition - London: St Martin's Press, 1957)
- ^ S., Craig, Fred W. (1972). Boundaries of parliamentary constituencies 1885-1972;. Chichester: Political Reference Publications. ISBN 0900178094. OCLC 539011.
{{cite book}}: CS1 maint: multiple names: authors list (link) - ^ "The Parliamentary Constituencies (England) Order 1983". www.legislation.gov.uk. Retrieved 21 March 2019.
- ^ "The Parliamentary Constituencies (England) Order 1995". www.legislation.gov.uk. Retrieved 21 March 2019.
- ^ "The Parliamentary Constituencies (England) Order 2007". www.legislation.gov.uk. Retrieved 21 March 2019.
- ^ "The Parliamentary Constituencies Order 2023". Schedule I Part 2 Eastern region.
- ^ a b c d e f g h i j k l m n o p q r s t u v w Clark, Linda; Rawcliffe, Carole; Roskell, J. S., eds. (1993). "Ipswich". The House of Commons 1386-1421. The History of Parliament Trust. Retrieved 24 November 2022.
- ^ a b c d e f g h i j k l m n o Bindoff, S. T., ed. (1982). "Ipswich". The House of Commons 1509-1558. The History of Parliament Trust. Retrieved 24 November 2022.
- ^ a b c d e f g h i j Hasler, P. W., ed. (1981). "Ipswich". The House of Commons 1558-1603. The History of Parliament Trust. Retrieved 22 November 2022.
- ^ a b c d e f John P Ferris (2010). "Ipswich". In Ferris, John P.; Thrush, Andrew (eds.). The House of Commons 1604-1629. The History of Parliament Trust. Retrieved 24 November 2022.
- ^ a b c d e Leigh Rayment's Historical List of MPs – Constituencies beginning with "I"
- ^ a b Chisholm, Hugh, ed. (1911). . Encyclopædia Britannica. Vol. 27 (11th ed.). Cambridge University Press.
- ^ a b c d e f g h i j k l m n o p q r s t u v w x y z aa ab ac ad ae af ag ah ai aj ak al am an ao ap aq ar as at au av aw ax ay az ba bb bc bd be bf bg bh bi bj bk bl bm bn bo bp Stooks Smith, Henry (1845). The Parliaments of England, from 1st George I., to the Present Time. Vol II: Oxfordshire to Wales Inclusive. London: Simpkin, Marshall, & Co. pp. 58–61.
- ^ Margaret Escott (2009). "BARRETT LENNARD, Thomas (1788–1856), of Belhus, Aveley, Essex and Hyde Park Terrace, Mdx.". In Fisher, David (ed.). The House of Commons 1820-1832. The History of Parliament Trust. Retrieved 24 November 2022.
- ^ David R Fisher (2009). "Maldon". In Fisher, David (ed.). The House of Commons 1820-1832. The History of Parliament Trust. Retrieved 24 November 2022.
- ^ Hall, Catherine; Draper, Nicholas; McClelland, Keith; Donington, Katie; Lang, Rachel (2014). "Appendix 4: MPs 1832-80 in the compensation records". Legacies of British Slave-ownership: Colonial Slavery and the Formation of Victorian Britain. Cambridge: Cambridge University Press. p. 292. ISBN 978-1-107-04005-2.
- ^ "Witham". Essex Standard. 6 August 1847. p. 2 – via British Newspaper Archive.
- ^ "Essex Elections". Morning Post. 26 December 1832. p. 2 – via British Newspaper Archive.
- ^ a b c d "Election Movements". John Bull. 28 June 1841. p. 10 – via British Newspaper Archive.
- ^ a b c d "Norfolk Chronicle". 26 June 1841. pp. 2–3 – via British Newspaper Archive.
- ^ "Postscript". The Spectator. 9 November 1839. p. 9.
- ^ The Spectator, Volume 14. F.C. Westley. 1841. p. 653.
- ^ Gash, Norman (2013). Politics in the Age of Peel: A Study in the Technique of Parliamentary Representation, 1830–1850. Faber & Faber. pp. 355, 440. ISBN 9780571302901.
- ^ "Ipswich". Leeds Times. 7 August 1847. p. 7 – via British Newspaper Archive.
- ^ "Ipswich". The Suffolk Chronicle; or Weekly General Advertiser & County Express. 17 July 1847. p. 1 – via British Newspaper Archive.
- ^ "The Elections". Norfolk Chronicle. 31 July 1847. p. 2 – via British Newspaper Archive.
- ^ "IPSWICH ELECTION WRIT". Parliamentary Debates (Hansard). 8 August 1842. Retrieved 17 January 2010.
During the last seven years, or little more, there had been five elections for the borough of Ipswich, and those five elections had produced five petitions
- ^ "Ipswich Labour candidate says Government's mistake could cost Suffolk schools £5m". Suffolk Live. Retrieved 9 December 2023.
- ^ "Another pair of Liberal Democrat selections". Mark Pack. Retrieved 22 December 2023.
- ^ "Find My PPC (Eastern England)" (PDF). Reform UK. Retrieved 15 December 2023.
- ^ "Ipswich Parliamentary constituency". BBC News. BBC. Retrieved 13 December 2019.
- ^ "Election 2017: Ipswich". BBC News. 9 June 2017. Archived from the original on 14 June 2017.
- ^ "Election Data 2015". Electoral Calculus. Archived from the original on 17 October 2015. Retrieved 17 October 2015.
- ^ "Election Data 2010". Electoral Calculus. Archived from the original on 26 July 2013. Retrieved 17 October 2015.
- ^ "Election Data 2005". Electoral Calculus. Archived from the original on 15 October 2011. Retrieved 18 October 2015.
- ^ "Election Data 2001". Electoral Calculus. Archived from the original on 15 October 2011. Retrieved 18 October 2015.
- ^ "Election Data 1997". Electoral Calculus. Archived from the original on 15 October 2011. Retrieved 18 October 2015.
- ^ "Election Data 1992". Electoral Calculus. Archived from the original on 15 October 2011. Retrieved 18 October 2015.
- ^ "UK General Election results April 1992". Richard Kimber's Political Science Resources. Politics Resources. 9 April 1992. Archived from the original on 8 May 2015. Retrieved 6 December 2010.
- ^ "Election Data 1987". Electoral Calculus. Archived from the original on 15 October 2011. Retrieved 18 October 2015.
- ^ "UK General Election results June 1987". Richard Kimber's Political Science Resources. Politics Resources. 11 June 1987. Archived from the original on 4 March 2016. Retrieved 19 December 2012.
- ^ "Election Data 1983". Electoral Calculus. Archived from the original on 15 October 2011. Retrieved 18 October 2015.
- ^ a b c d Craig, F. W. S. (1983). British parliamentary election results 1918–1949 (3 ed.). Chichester: Parliamentary Research Services. ISBN 0-900178-06-X.
- ^ a b c d e f g h i j Craig, F. W. S., ed. (1974). British Parliamentary Election Results: 1885-1918. London: Macmillan Press. ISBN 9781349022984.
- ^ Craig, F. W. S., British parliamentary election results 1885–1918
- ^ a b Debrett's House of Commons & Judicial Bench, 1916
- ^ "The General Election". Manchester Courier and Lancashire General Advertiser. 2 July 1886. pp. 5–6 – via British Newspaper Archive.
- ^ "Three Months for Receiving an Election Bribe". Dundee Evening Telegraph. 10 May 1886. p. 3 – via British Newspaper Archive.; see also report in Hansard
- ^ "Adoption of Mr. E. M. Ind As A Candidate for Ipswich". Chelmsford Chronicle. 16 May 1884. p. 5 – via British Newspaper Archive.
- ^ a b c d e f g h i j k l m n o p q r Craig, F. W. S., ed. (1977). British Parliamentary Election Results 1832-1885 (e-book) (1st ed.). London: Macmillan Press. ISBN 978-1-349-02349-3.
- ^ "Ipswich". Bury and Norwich Post. 15 November 1864. p. 5 – via British Newspaper Archive.
- ^ "Ipswich". Suffolk and Essex Free Press. 5 May 1859. p. 3 – via British Newspaper Archive.
- ^ "Ipswich". Cheltenham Mercury. 21 March 1857. pp. 2–3 – via British Newspaper Archive.
- ^ "Ipswich". Essex Standard. 9 July 1852. p. 2 – via British Newspaper Archive.
- ^ "General Elections". Berkshire Chronicle. 29 July 1837. p. 1 – via British Newspaper Archive.
- ^ "Domestic Intelligence". Dundee, Perth, and Cupar Advertiser. 21 March 1848. p. 1 – via British Newspaper Archive.
- ^ "Ipswich". Exeter and Plymouth Gazette. 10 July 1852. pp. 4, 7 – via British Newspaper Archive.
- ^ "The General Election". Norfolk Chronicle. 10 July 1852. p. 2 – via British Newspaper Archive.
- ^ "Miscellaneous News". Cambridge Independent Press. 6 August 1842. p. 4 – via British Newspaper Archive.
- ^ "The Suffolk Chronicle; or Weekly General Advertiser & County Express". 4 June 1842. pp. 3–4 – via British Newspaper Archive.
- ^ "Election Committee". Belfast Commercial Chronicle. 27 April 1842. p. 2 – via British Newspaper Archive.
- ^ a b Margaret Escott (2009). "Ipswich". In Fisher, David (ed.). The House of Commons 1820-1832. The History of Parliament Trust. Retrieved 24 November 2022.
- ^ a b c John Brooke (1964). "Ipswich". In Namier, Sir Lewis; Brooke, John (eds.). The House of Commons 1754-1790. The History of Parliament Trust. Retrieved 23 November 2022.
- ^ Sir Lewis Namier (1964). "VERNON, Edward (1684-1757), of Nacton, nr. Ipswich, Suff.". In Namier, Sir Lewis; Brooke, John (eds.). The House of Commons 1754-1790. The History of Parliament Trust. Retrieved 23 November 2022.
- ^ a b c d e f g h i j Romney Sedgwick (1970). "Ipswich". In Sedgwick, Romney (ed.). The House of Commons 1715-1754. The History of Parliament Trust. Retrieved 23 November 2022.
- ^ "Churchill, William (c.1657-1737), of Dallinghoo, Suff.". History of Parliament Online (1715-1754). Retrieved 2 September 2018.
- ^ a b c d e f g h i j k l D. W. Hayton (2002). "Ipswich". In Hayton, David; Cruickshanks, Eveline; Handley, Stuart (eds.). The House of Commons 1690-1715. The History of Parliament Trust. Retrieved 24 November 2022.
- ^ a b Paula Watson (1983). "Ipswich". In Henning, B. D. (ed.). The House of Commons 1660-1690. The History of Parliament Trust. Retrieved 24 November 2022.
52°04′N 1°10′E / 52.06°N 1.16°E