


Summary
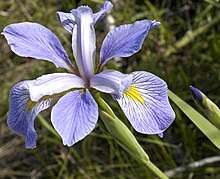
The Iris flower data set or Fisher's Iris data set is a multivariate data set used and made famous by the British statistician and biologist Ronald Fisher in his 1936 paper The use of multiple measurements in taxonomic problems as an example of linear discriminant analysis.[1] It is sometimes called Anderson's Iris data set because Edgar Anderson collected the data to quantify the morphologic variation of Iris flowers of three related species.[2] Two of the three species were collected in the Gaspé Peninsula "all from the same pasture, and picked on the same day and measured at the same time by the same person with the same apparatus".[3]
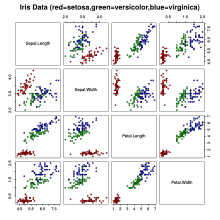
The data set consists of 50 samples from each of three species of Iris (Iris setosa, Iris virginica and Iris versicolor). Four features were measured from each sample: the length and the width of the sepals and petals, in centimeters. Based on the combination of these four features, Fisher developed a linear discriminant model to distinguish the species from each other. Fisher's paper was published in the Annals of Eugenics (today the Annals of Human Genetics).[1]
Use of the data set edit


Originally used as an example data set on which Fisher's linear discriminant analysis was applied, it became a typical test case for many statistical classification techniques in machine learning such as support vector machines.[5]
The use of this data set in cluster analysis however is not common, since the data set only contains two clusters with rather obvious separation. One of the clusters contains Iris setosa, while the other cluster contains both Iris virginica and Iris versicolor and is not separable without the species information Fisher used. This makes the data set a good example to explain the difference between supervised and unsupervised techniques in data mining: Fisher's linear discriminant model can only be obtained when the object species are known: class labels and clusters are not necessarily the same.[6]
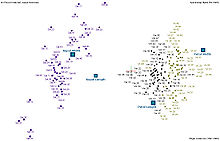
Nevertheless, all three species of Iris are separable in the projection on the nonlinear and branching principal component.[7] The data set is approximated by the closest tree with some penalty for the excessive number of nodes, bending and stretching. Then the so-called "metro map" is constructed.[4] The data points are projected into the closest node. For each node the pie diagram of the projected points is prepared. The area of the pie is proportional to the number of the projected points. It is clear from the diagram (left) that the absolute majority of the samples of the different Iris species belong to the different nodes. Only a small fraction of Iris-virginica is mixed with Iris-versicolor (the mixed blue-green nodes in the diagram). Therefore, the three species of Iris (Iris setosa, Iris virginica and Iris versicolor) are separable by the unsupervising procedures of nonlinear principal component analysis. To discriminate them, it is sufficient just to select the corresponding nodes on the principal tree.
Data set edit

The dataset contains a set of 150 records under five attributes: sepal length, sepal width, petal length, petal width and species.

| Dataset order | Sepal length | Sepal width | Petal length | Petal width | Species |
|---|---|---|---|---|---|
| 1 | 5.1 | 3.5 | 1.4 | 0.2 | I. setosa |
| 2 | 4.9 | 3.0 | 1.4 | 0.2 | I. setosa |
| 3 | 4.7 | 3.2 | 1.3 | 0.2 | I. setosa |
| 4 | 4.6 | 3.1 | 1.5 | 0.2 | I. setosa |
| 5 | 5.0 | 3.6 | 1.4 | 0.3 | I. setosa |
| 6 | 5.4 | 3.9 | 1.7 | 0.4 | I. setosa |
| 7 | 4.6 | 3.4 | 1.4 | 0.3 | I. setosa |
| 8 | 5.0 | 3.4 | 1.5 | 0.2 | I. setosa |
| 9 | 4.4 | 2.9 | 1.4 | 0.2 | I. setosa |
| 10 | 4.9 | 3.1 | 1.5 | 0.1 | I. setosa |
| 11 | 5.4 | 3.7 | 1.5 | 0.2 | I. setosa |
| 12 | 4.8 | 3.4 | 1.6 | 0.2 | I. setosa |
| 13 | 4.8 | 3.0 | 1.4 | 0.1 | I. setosa |
| 14 | 4.3 | 3.0 | 1.1 | 0.1 | I. setosa |
| 15 | 5.8 | 4.0 | 1.2 | 0.2 | I. setosa |
| 16 | 5.7 | 4.4 | 1.5 | 0.4 | I. setosa |
| 17 | 5.4 | 3.9 | 1.3 | 0.4 | I. setosa |
| 18 | 5.1 | 3.5 | 1.4 | 0.3 | I. setosa |
| 19 | 5.7 | 3.8 | 1.7 | 0.3 | I. setosa |
| 20 | 5.1 | 3.8 | 1.5 | 0.3 | I. setosa |
| 21 | 5.4 | 3.4 | 1.7 | 0.2 | I. setosa |
| 22 | 5.1 | 3.7 | 1.5 | 0.4 | I. setosa |
| 23 | 4.6 | 3.6 | 1.0 | 0.2 | I. setosa |
| 24 | 5.1 | 3.3 | 1.7 | 0.5 | I. setosa |
| 25 | 4.8 | 3.4 | 1.9 | 0.2 | I. setosa |
| 26 | 5.0 | 3.0 | 1.6 | 0.2 | I. setosa |
| 27 | 5.0 | 3.4 | 1.6 | 0.4 | I. setosa |
| 28 | 5.2 | 3.5 | 1.5 | 0.2 | I. setosa |
| 29 | 5.2 | 3.4 | 1.4 | 0.2 | I. setosa |
| 30 | 4.7 | 3.2 | 1.6 | 0.2 | I. setosa |
| 31 | 4.8 | 3.1 | 1.6 | 0.2 | I. setosa |
| 32 | 5.4 | 3.4 | 1.5 | 0.4 | I. setosa |
| 33 | 5.2 | 4.1 | 1.5 | 0.1 | I. setosa |
| 34 | 5.5 | 4.2 | 1.4 | 0.2 | I. setosa |
| 35 | 4.9 | 3.1 | 1.5 | 0.2 | I. setosa |
| 36 | 5.0 | 3.2 | 1.2 | 0.2 | I. setosa |
| 37 | 5.5 | 3.5 | 1.3 | 0.2 | I. setosa |
| 38 | 4.9 | 3.6 | 1.4 | 0.1 | I. setosa |
| 39 | 4.4 | 3.0 | 1.3 | 0.2 | I. setosa |
| 40 | 5.1 | 3.4 | 1.5 | 0.2 | I. setosa |
| 41 | 5.0 | 3.5 | 1.3 | 0.3 | I. setosa |
| 42 | 4.5 | 2.3 | 1.3 | 0.3 | I. setosa |
| 43 | 4.4 | 3.2 | 1.3 | 0.2 | I. setosa |
| 44 | 5.0 | 3.5 | 1.6 | 0.6 | I. setosa |
| 45 | 5.1 | 3.8 | 1.9 | 0.4 | I. setosa |
| 46 | 4.8 | 3.0 | 1.4 | 0.3 | I. setosa |
| 47 | 5.1 | 3.8 | 1.6 | 0.2 | I. setosa |
| 48 | 4.6 | 3.2 | 1.4 | 0.2 | I. setosa |
| 49 | 5.3 | 3.7 | 1.5 | 0.2 | I. setosa |
| 50 | 5.0 | 3.3 | 1.4 | 0.2 | I. setosa |
| 51 | 7.0 | 3.2 | 4.7 | 1.4 | I. versicolor |
| 52 | 6.4 | 3.2 | 4.5 | 1.5 | I. versicolor |
| 53 | 6.9 | 3.1 | 4.9 | 1.5 | I. versicolor |
| 54 | 5.5 | 2.3 | 4.0 | 1.3 | I. versicolor |
| 55 | 6.5 | 2.8 | 4.6 | 1.5 | I. versicolor |
| 56 | 5.7 | 2.8 | 4.5 | 1.3 | I. versicolor |
| 57 | 6.3 | 3.3 | 4.7 | 1.6 | I. versicolor |
| 58 | 4.9 | 2.4 | 3.3 | 1.0 | I. versicolor |
| 59 | 6.6 | 2.9 | 4.6 | 1.3 | I. versicolor |
| 60 | 5.2 | 2.7 | 3.9 | 1.4 | I. versicolor |
| 61 | 5.0 | 2.0 | 3.5 | 1.0 | I. versicolor |
| 62 | 5.9 | 3.0 | 4.2 | 1.5 | I. versicolor |
| 63 | 6.0 | 2.2 | 4.0 | 1.0 | I. versicolor |
| 64 | 6.1 | 2.9 | 4.7 | 1.4 | I. versicolor |
| 65 | 5.6 | 2.9 | 3.6 | 1.3 | I. versicolor |
| 66 | 6.7 | 3.1 | 4.4 | 1.4 | I. versicolor |
| 67 | 5.6 | 3.0 | 4.5 | 1.5 | I. versicolor |
| 68 | 5.8 | 2.7 | 4.1 | 1.0 | I. versicolor |
| 69 | 6.2 | 2.2 | 4.5 | 1.5 | I. versicolor |
| 70 | 5.6 | 2.5 | 3.9 | 1.1 | I. versicolor |
| 71 | 5.9 | 3.2 | 4.8 | 1.8 | I. versicolor |
| 72 | 6.1 | 2.8 | 4.0 | 1.3 | I. versicolor |
| 73 | 6.3 | 2.5 | 4.9 | 1.5 | I. versicolor |
| 74 | 6.1 | 2.8 | 4.7 | 1.2 | I. versicolor |
| 75 | 6.4 | 2.9 | 4.3 | 1.3 | I. versicolor |
| 76 | 6.6 | 3.0 | 4.4 | 1.4 | I. versicolor |
| 77 | 6.8 | 2.8 | 4.8 | 1.4 | I. versicolor |
| 78 | 6.7 | 3.0 | 5.0 | 1.7 | I. versicolor |
| 79 | 6.0 | 2.9 | 4.5 | 1.5 | I. versicolor |
| 80 | 5.7 | 2.6 | 3.5 | 1.0 | I. versicolor |
| 81 | 5.5 | 2.4 | 3.8 | 1.1 | I. versicolor |
| 82 | 5.5 | 2.4 | 3.7 | 1.0 | I. versicolor |
| 83 | 5.8 | 2.7 | 3.9 | 1.2 | I. versicolor |
| 84 | 6.0 | 2.7 | 5.1 | 1.6 | I. versicolor |
| 85 | 5.4 | 3.0 | 4.5 | 1.5 | I. versicolor |
| 86 | 6.0 | 3.4 | 4.5 | 1.6 | I. versicolor |
| 87 | 6.7 | 3.1 | 4.7 | 1.5 | I. versicolor |
| 88 | 6.3 | 2.3 | 4.4 | 1.3 | I. versicolor |
| 89 | 5.6 | 3.0 | 4.1 | 1.3 | I. versicolor |
| 90 | 5.5 | 2.5 | 4.0 | 1.3 | I. versicolor |
| 91 | 5.5 | 2.6 | 4.4 | 1.2 | I. versicolor |
| 92 | 6.1 | 3.0 | 4.6 | 1.4 | I. versicolor |
| 93 | 5.8 | 2.6 | 4.0 | 1.2 | I. versicolor |
| 94 | 5.0 | 2.3 | 3.3 | 1.0 | I. versicolor |
| 95 | 5.6 | 2.7 | 4.2 | 1.3 | I. versicolor |
| 96 | 5.7 | 3.0 | 4.2 | 1.2 | I. versicolor |
| 97 | 5.7 | 2.9 | 4.2 | 1.3 | I. versicolor |
| 98 | 6.2 | 2.9 | 4.3 | 1.3 | I. versicolor |
| 99 | 5.1 | 2.5 | 3.0 | 1.1 | I. versicolor |
| 100 | 5.7 | 2.8 | 4.1 | 1.3 | I. versicolor |
| 101 | 6.3 | 3.3 | 6.0 | 2.5 | I. virginica |
| 102 | 5.8 | 2.7 | 5.1 | 1.9 | I. virginica |
| 103 | 7.1 | 3.0 | 5.9 | 2.1 | I. virginica |
| 104 | 6.3 | 2.9 | 5.6 | 1.8 | I. virginica |
| 105 | 6.5 | 3.0 | 5.8 | 2.2 | I. virginica |
| 106 | 7.6 | 3.0 | 6.6 | 2.1 | I. virginica |
| 107 | 4.9 | 2.5 | 4.5 | 1.7 | I. virginica |
| 108 | 7.3 | 2.9 | 6.3 | 1.8 | I. virginica |
| 109 | 6.7 | 2.5 | 5.8 | 1.8 | I. virginica |
| 110 | 7.2 | 3.6 | 6.1 | 2.5 | I. virginica |
| 111 | 6.5 | 3.2 | 5.1 | 2.0 | I. virginica |
| 112 | 6.4 | 2.7 | 5.3 | 1.9 | I. virginica |
| 113 | 6.8 | 3.0 | 5.5 | 2.1 | I. virginica |
| 114 | 5.7 | 2.5 | 5.0 | 2.0 | I. virginica |
| 115 | 5.8 | 2.8 | 5.1 | 2.4 | I. virginica |
| 116 | 6.4 | 3.2 | 5.3 | 2.3 | I. virginica |
| 117 | 6.5 | 3.0 | 5.5 | 1.8 | I. virginica |
| 118 | 7.7 | 3.8 | 6.7 | 2.2 | I. virginica |
| 119 | 7.7 | 2.6 | 6.9 | 2.3 | I. virginica |
| 120 | 6.0 | 2.2 | 5.0 | 1.5 | I. virginica |
| 121 | 6.9 | 3.2 | 5.7 | 2.3 | I. virginica |
| 122 | 5.6 | 2.8 | 4.9 | 2.0 | I. virginica |
| 123 | 7.7 | 2.8 | 6.7 | 2.0 | I. virginica |
| 124 | 6.3 | 2.7 | 4.9 | 1.8 | I. virginica |
| 125 | 6.7 | 3.3 | 5.7 | 2.1 | I. virginica |
| 126 | 7.2 | 3.2 | 6.0 | 1.8 | I. virginica |
| 127 | 6.2 | 2.8 | 4.8 | 1.8 | I. virginica |
| 128 | 6.1 | 3.0 | 4.9 | 1.8 | I. virginica |
| 129 | 6.4 | 2.8 | 5.6 | 2.1 | I. virginica |
| 130 | 7.2 | 3.0 | 5.8 | 1.6 | I. virginica |
| 131 | 7.4 | 2.8 | 6.1 | 1.9 | I. virginica |
| 132 | 7.9 | 3.8 | 6.4 | 2.0 | I. virginica |
| 133 | 6.4 | 2.8 | 5.6 | 2.2 | I. virginica |
| 134 | 6.3 | 2.8 | 5.1 | 1.5 | I. virginica |
| 135 | 6.1 | 2.6 | 5.6 | 1.4 | I. virginica |
| 136 | 7.7 | 3.0 | 6.1 | 2.3 | I. virginica |
| 137 | 6.3 | 3.4 | 5.6 | 2.4 | I. virginica |
| 138 | 6.4 | 3.1 | 5.5 | 1.8 | I. virginica |
| 139 | 6.0 | 3.0 | 4.8 | 1.8 | I. virginica |
| 140 | 6.9 | 3.1 | 5.4 | 2.1 | I. virginica |
| 141 | 6.7 | 3.1 | 5.6 | 2.4 | I. virginica |
| 142 | 6.9 | 3.1 | 5.1 | 2.3 | I. virginica |
| 143 | 5.8 | 2.7 | 5.1 | 1.9 | I. virginica |
| 144 | 6.8 | 3.2 | 5.9 | 2.3 | I. virginica |
| 145 | 6.7 | 3.3 | 5.7 | 2.5 | I. virginica |
| 146 | 6.7 | 3.0 | 5.2 | 2.3 | I. virginica |
| 147 | 6.3 | 2.5 | 5.0 | 1.9 | I. virginica |
| 148 | 6.5 | 3.0 | 5.2 | 2.0 | I. virginica |
| 149 | 6.2 | 3.4 | 5.4 | 2.3 | I. virginica |
| 150 | 5.9 | 3.0 | 5.1 | 1.8 | I. virginica |
The iris data set is widely used as a beginner's dataset for machine learning purposes. The dataset is included in R base and Python in the machine learning library scikit-learn, so that users can access it without having to find a source for it.
Several versions of the dataset have been published.[8]
R code illustrating usage edit
The example R code shown below reproduce the scatterplot displayed at the top of this article:
# Show the dataset
iris
# Show the help page, with information about the dataset
?iris

# Create scatterplots of all pairwise combination of the 4 variables in the dataset
pairs(iris[1:4], main="Iris Data (red=setosa,green=versicolor,blue=virginica)",
      pch=21, bg=c("red","green3","blue")[unclass(iris$Species)])
Python code illustrating usage edit
from sklearn.datasets import load_iris

iris = load_iris()
iris
This code gives:
{'data': array([[5.1, 3.5, 1.4, 0.2],
                [4.9, 3., 1.4, 0.2],
                [4.7, 3.2, 1.3, 0.2],
                [4.6, 3.1, 1.5, 0.2],...
'target': array([0, 0, 0, ... 1, 1, 1, ... 2, 2, 2, ...
'target_names': array(['setosa', 'versicolor', 'virginica'], dtype='<U10'),
...}
See also edit
References edit
- ^ a b R. A. Fisher (1936). "The use of multiple measurements in taxonomic problems". Annals of Eugenics. 7 (2): 179–188. doi:10.1111/j.1469-1809.1936.tb02137.x. hdl:2440/15227.
- ^ Edgar Anderson (1936). "The species problem in Iris". Annals of the Missouri Botanical Garden. 23 (3): 457–509. doi:10.2307/2394164. JSTOR 2394164.
- ^ Edgar Anderson (1935). "The irises of the Gaspé Peninsula". Bulletin of the American Iris Society. 59: 2–5.
- ^ a b A. N. Gorban, A. Zinovyev. Principal manifolds and graphs in practice: from molecular biology to dynamical systems, International Journal of Neural Systems, Vol. 20, No. 3 (2010) 219–232.
- ^ "UCI Machine Learning Repository: Iris Data Set". archive.ics.uci.edu. Retrieved 2017-12-01.
- ^ Ines Färber; Stephan Günnemann; Hans-Peter Kriegel; Peer Kröger; Emmanuel Müller; Erich Schubert; Thomas Seidl; Arthur Zimek (2010). "On Using Class-Labels in Evaluation of Clusterings" (PDF). In Xiaoli Z. Fern; Ian Davidson; Jennifer Dy (eds.). MultiClust: Discovering, Summarizing, and Using Multiple Clusterings. ACM SIGKDD.
- ^ A.N. Gorban, N.R. Sumner, and A.Y. Zinovyev, Topological grammars for data approximation, Applied Mathematics Letters Volume 20, Issue 4 (2007), 382-386.
- ^ Bezdek, J.C.; Keller, J.M.; Krishnapuram, R.; Kuncheva, L.I.; Pal, N.R. (1999). "Will the real iris data please stand up?". IEEE Transactions on Fuzzy Systems. 7 (3): 368–369. doi:10.1109/91.771092.
Seliyana edit
- "Fisher's Iris Data". (Contains two errors which are documented). UCI Machine Learning Repository: Iris Data Set.