
KNOWPIA
WELCOME TO KNOWPIA

Jing'an County 
Summary
Jing'an County (simplified Chinese: 靖安县; traditional Chinese: 靖安縣; pinyin: Jìng'ān Xiàn) is a county in the northwest of Jiangxi province, People's Republic of China. It is under the jurisdiction of the prefecture-level city of Yichun.
Jing'an County
靖安县 Tsingan | |
|---|---|
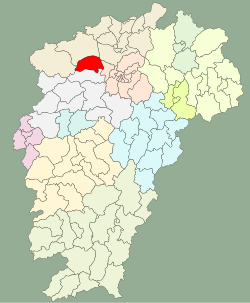 Location in Jiangxi | |
| Coordinates: 28°57′N 115°14′E / 28.950°N 115.233°E | |
| Country | People's Republic of China |
| Province | Jiangxi |
| Prefecture-level city | Yichun |
| Time zone | UTC+8 (China Standard) |
Administrative divisions edit
Jing'an County has 5 towns and 6 townships.[1]
- 5 towns
|
|
- 6 townships
|
|
Demographics edit
The population of the district was 137,407 in 1999.[2]
Climate edit
| Climate data for Jing'an (1991–2020 normals, extremes 1981–2010) | |||||||||||||
|---|---|---|---|---|---|---|---|---|---|---|---|---|---|
| Month | Jan | Feb | Mar | Apr | May | Jun | Jul | Aug | Sep | Oct | Nov | Dec | Year |
| Record high °C (°F) | 24.2 (75.6) |
28.1 (82.6) |
32.7 (90.9) |
34.1 (93.4) |
35.7 (96.3) |
37.2 (99.0) |
39.0 (102.2) |
39.9 (103.8) |
37.4 (99.3) |
34.8 (94.6) |
30.8 (87.4) |
23.5 (74.3) |
39.9 (103.8) |
| Mean daily maximum °C (°F) | 9.7 (49.5) |
12.4 (54.3) |
16.4 (61.5) |
22.8 (73.0) |
27.1 (80.8) |
29.6 (85.3) |
33.2 (91.8) |
33.0 (91.4) |
29.7 (85.5) |
24.9 (76.8) |
18.7 (65.7) |
12.6 (54.7) |
22.5 (72.5) |
| Daily mean °C (°F) | 5.6 (42.1) |
8.0 (46.4) |
11.9 (53.4) |
17.7 (63.9) |
22.4 (72.3) |
25.4 (77.7) |
28.4 (83.1) |
28.0 (82.4) |
24.5 (76.1) |
19.3 (66.7) |
13.4 (56.1) |
7.7 (45.9) |
17.7 (63.8) |
| Mean daily minimum °C (°F) | 2.8 (37.0) |
5.0 (41.0) |
8.6 (47.5) |
14.1 (57.4) |
18.8 (65.8) |
22.3 (72.1) |
24.8 (76.6) |
24.5 (76.1) |
21.0 (69.8) |
15.6 (60.1) |
9.9 (49.8) |
4.3 (39.7) |
14.3 (57.7) |
| Record low °C (°F) | −6.4 (20.5) |
−4.8 (23.4) |
−3.5 (25.7) |
1.6 (34.9) |
8.9 (48.0) |
14.2 (57.6) |
18.0 (64.4) |
18.8 (65.8) |
12.6 (54.7) |
3.0 (37.4) |
−1.6 (29.1) |
−11.0 (12.2) |
−11.0 (12.2) |
| Average precipitation mm (inches) | 79.2 (3.12) |
93.0 (3.66) |
176.0 (6.93) |
214.9 (8.46) |
235.1 (9.26) |
326.1 (12.84) |
214.3 (8.44) |
142.5 (5.61) |
81.5 (3.21) |
51.0 (2.01) |
80.2 (3.16) |
54.9 (2.16) |
1,748.7 (68.86) |
| Average precipitation days (≥ 0.1 mm) | 13.4 | 13.0 | 17.5 | 16.9 | 16.1 | 17.8 | 13.6 | 12.4 | 8.5 | 7.5 | 10.0 | 10.0 | 156.7 |
| Average snowy days | 2.8 | 1.2 | 0.4 | 0 | 0 | 0 | 0 | 0 | 0 | 0 | 0 | 0.9 | 5.3 |
| Average relative humidity (%) | 78 | 78 | 79 | 78 | 79 | 84 | 80 | 79 | 77 | 73 | 75 | 75 | 78 |
| Mean monthly sunshine hours | 83.2 | 82.3 | 93.8 | 118.4 | 134.8 | 120.9 | 196.2 | 196.1 | 168.8 | 157.5 | 131.5 | 121.2 | 1,604.7 |
| Percent possible sunshine | 25 | 26 | 25 | 31 | 32 | 29 | 46 | 49 | 46 | 45 | 41 | 38 | 36 |
| Source: China Meteorological Administration[3][4] | |||||||||||||
Notes and references edit
- ^ "南京市-行政区划网 www.xzqh.org" (in Chinese). XZQH. Retrieved 2012-05-24.
- ^ (in English) National Population Statistics Materials by County and City - 1999 Period, in China County & City Population 1999, Harvard China Historical GIS
- ^ 中国气象数据网 – WeatherBk Data (in Simplified Chinese). China Meteorological Administration. Retrieved 28 June 2023.
- ^ 中国气象数据网 (in Simplified Chinese). China Meteorological Administration. Retrieved 28 June 2023.
External links edit
- (in Chinese) Government site - Google translation