
KNOWPIA
WELCOME TO KNOWPIA

Kroppen 
Summary
Kroppen is a municipality in the Oberspreewald-Lausitz district, in Upper Lusatia, Brandenburg, Germany.
Kroppen | |
|---|---|
Location of Kroppen within Oberspreewald-Lausitz district 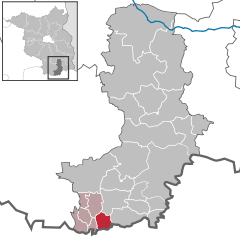 | |
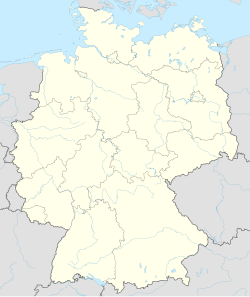 Kroppen 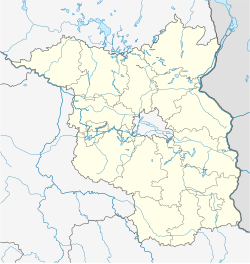 Kroppen | |
| Coordinates: 51°22′59″N 13°48′00″E / 51.38306°N 13.80000°E | |
| Country | Germany |
| State | Brandenburg |
| District | Oberspreewald-Lausitz |
| Municipal assoc. | Ortrand |
| Subdivisions | 2 Ortsteile |
| Government | |
| • Mayor (2019–24) | Reiner Krämer[1] |
| Area | |
| • Total | 15.16 km2 (5.85 sq mi) |
| Elevation | 112 m (367 ft) |
| Population (2022-12-31)[2] | |
| • Total | 720 |
| • Density | 47/km2 (120/sq mi) |
| Time zone | UTC+01:00 (CET) |
| • Summer (DST) | UTC+02:00 (CEST) |
| Postal codes | 01945 |
| Dialling codes | 035755 |
| Vehicle registration | OSL |
| Website | www.kroppen-osl.de |
History edit
From 1815 to 1825, Kroppen was part of the Prussian Province of Brandenburg, from 1825 to 1919 of the Province of Silesia, from 1919 to 1938 of the Province of Lower Silesia, again from 1938 to 1941 of the Province of Silesia and again from 1941 to 1945 of the Province of Lower Silesia. From 1945 to 1952 it was part of Saxony and from 1952 to 1990 of the Bezirk Cottbus of East Germany.
Demography edit

|
|
References edit
- ^ Landkreis Oberspreewald-Lausitz Wahl der Bürgermeisterin / des Bürgermeisters, accessed 2 July 2021.
- ^ "Bevölkerungsentwicklung und Bevölkerungsstandim Land Brandenburg Dezember 2022" (PDF). Amt für Statistik Berlin-Brandenburg (in German). June 2023.
- ^ Detailed data sources are to be found in the Wikimedia Commons.Population Projection Brandenburg at Wikimedia Commons