


Summary
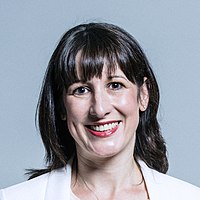
Leeds West is a borough constituency in the city of Leeds, West Yorkshire which is represented in the House of Commons of the Parliament of the United Kingdom. It elects one Member of Parliament (MP) by the first-past-the-post system of election. The current MP is Rachel Reeves of the Labour Party. With the exception of the Parliament of 1983–87, the seat has been held by Labour since 1945.
| Leeds West | |
|---|---|
| Borough constituency for the House of Commons | |
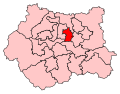 Boundary of Leeds West in West Yorkshire | |
 Location of West Yorkshire within England | |
| County | West Yorkshire (West Riding of Yorkshire until 1974) |
| Electorate | 67,727 (December 2019)[1] |
| Current constituency | |
| Created | 1885 |
| Member of Parliament | Rachel Reeves (Labour) |
| Seats | One |
| Created from | Leeds |
| Replaced by | Leeds South West and Morley, & Leeds West and Pudsey |
The seat is due to be abolished for the next general election.[2]
Boundaries edit

1885–1918: The Municipal Borough of Leeds wards of Armley and Wortley, Holbeck, and New Wortley, and part of Bramley ward.
1918–1950: The County Borough of Leeds wards of Armley and Wortley, and Bramley, and part of New Wortley ward.
1950–1951: The County Borough of Leeds wards of Bramley, Farnley and Wortley, and Upper Armley.
1951–1955: The County Borough of Leeds wards of Armley, Bramley, Stanningley, and Wortley.[3]
1955–1974: The County Borough of Leeds wards of Armley, Bramley, Stanningley, Wellington, and Wortley.
1974–1983: The County Borough wards of Armley and Castleton, Bramley, Stanningley, and Wortley.
1980–1983: The City of Leeds wards of Armley, Bramley, and Wortley.
1983–2010: The City of Leeds wards of Armley, Bramley, Kirkstall, and Wortley.
2010–present: The City of Leeds wards of Armley, Bramley and Stanningley, Farnley and Wortley, and Kirkstall. Unusually for a Parliamentary seat, the boundaries do not correspond exactly to the wards' boundaries. The seat includes small areas of the wards for Calverley and Farsley, and Morley North, but also excludes a very small area of Farnley and Wortley, which falls under Leeds Central.[4]
The constituency covers the western part of the city of Leeds in West Yorkshire.
History edit
The constituency was created in 1885 by the Redistribution of Seats Act 1885, and was first used in the general election of that year. Leeds had previously been represented by two MPs (1832–1868) and three MPs (1868–1885). From 1885 it was represented by five single-member constituencies: Leeds Central, Leeds East, Leeds North, Leeds South and Leeds West. The constituencies of Morley, Otley and Pudsey were also created in 1885.
Proposed abolition edit
Further to the completion of the 2023 Periodic Review of Westminster constituencies, the seat will be abolished for the next general election, with its contents distributed to three new constituencies:[2]
Members of Parliament edit
Elections edit
Elections in the 2010s edit
| Party | Candidate | Votes | % | ±% | |
|---|---|---|---|---|---|
| Labour | Rachel Reeves | 22,186 | 55.1 | -8.8 | |
| Conservative | Mark Dormer | 11,622 | 28.9 | +2.7 | |
| Brexit Party | Philip Mars | 2,685 | 6.7 | New | |
| Liberal Democrats | Dan Walker | 1,787 | 4.4 | +2.2 | |
| Green | Victoria Smith | 1,274 | 3.2 | +0.8 | |
| Yorkshire | Ian Cowling | 650 | 1.6 | +0.7 | |
| SDP | Daniel Whetstone | 46 | 0.1 | New | |
| Alliance for Green Socialism | Mike Davies | 31 | 0.1 | 0.0 | |
| Majority | 10,564 | 26.2 | -11.5 | ||
| Turnout | 40,281 | 59.5 | -2.6 | ||
| Labour hold | Swing | -5.8 | |||
| Party | Candidate | Votes | % | ±% | |
|---|---|---|---|---|---|
| Labour | Rachel Reeves | 27,013 | 63.9 | +15.9 | |
| Conservative | Zoë Metcalfe | 11,048 | 26.2 | +6.1 | |
| UKIP | Mark Thackray | 1,815 | 4.3 | -14.2 | |
| Green | Andrew Pointon | 1,023 | 2.4 | -6.0 | |
| Liberal Democrats | Alasdair McGregor | 905 | 2.2 | -1.7 | |
| Yorkshire | Ed Jones | 378 | 0.9 | New | |
| Alliance for Green Socialism | Mike Davies | 37 | 0.1 | New | |
| Majority | 15,965 | 37.7 | +9.8 | ||
| Turnout | 42,301 | 62.1 | +2.9 | ||
| Labour hold | Swing | +5.0 | |||
| Party | Candidate | Votes | % | ±% | |
|---|---|---|---|---|---|
| Labour | Rachel Reeves | 18,456 | 48.0 | +5.7 | |
| Conservative | Alex Pierre-Traves | 7,729 | 20.1 | +0.4 | |
| UKIP | Anne Murgatroyd | 7,104 | 18.5 | +15.6 | |
| Green | Andrew Pointon | 3,217 | 8.4 | +3.7 | |
| Liberal Democrats | Laura Coyle | 1,495 | 3.9 | −20.3 | |
| CISTA | Matthew West | 217 | 0.6 | New | |
| TUSC | Ben Mayor | 205 | 0.5 | New | |
| Majority | 10,727 | 27.9 | +9.8 | ||
| Turnout | 38,423 | 59.2 | +1.7 | ||
| Labour hold | Swing | +2.65 | |||
| Party | Candidate | Votes | % | ±% | |
|---|---|---|---|---|---|
| Labour | Rachel Reeves | 16,389 | 42.3 | −13.9 | |
| Liberal Democrats | Ruth Coleman | 9,373 | 24.2 | +6.8 | |
| Conservative | Joe Marjoram | 7,641 | 19.7 | +5.6 | |
| BNP | Joanna Beverley | 2,377 | 6.1 | +2.8 | |
| Green | David Blackburn | 1,832 | 4.7 | −2.5 | |
| UKIP | Jeff Miles | 1,140 | 2.9 | +1.1 | |
| Majority | 7,016 | 18.1 | −20.7 | ||
| Turnout | 38,752 | 57.5 | +4.7 | ||
| Labour hold | Swing | −10.3 | |||
Elections in the 2000s edit
| Party | Candidate | Votes | % | ±% | |
|---|---|---|---|---|---|
| Labour | John Battle | 18,704 | 55.5 | −6.6 | |
| Liberal Democrats | Darren Finlay | 5,894 | 17.5 | +7.1 | |
| Conservative | Tim Metcalfe | 4,807 | 14.3 | −1.3 | |
| Green | David Blackburn | 2,519 | 7.5 | −0.5 | |
| BNP | Julie Day | 1,166 | 3.5 | New | |
| UKIP | David Sewards | 628 | 1.9 | −0.5 | |
| Majority | 12,810 | 38.0 | −8.5 | ||
| Turnout | 33,719 | 53.6 | +3.6 | ||
| Labour hold | Swing | ||||
| Party | Candidate | Votes | % | ±% | |
|---|---|---|---|---|---|
| Labour | John Battle | 19,943 | 62.1 | −4.6 | |
| Conservative | Kris Hopkins | 5,008 | 15.6 | −1.9 | |
| Liberal Democrats | Darren Finlay | 3,350 | 10.4 | +1.4 | |
| Green | David Blackburn | 2,573 | 8.0 | +5.8 | |
| UKIP | Bill Finley | 758 | 2.4 | New | |
| Liberal | Noel Nowosielski | 462 | 1.4 | −0.2 | |
| Majority | 14,935 | 46.5 | -2.7 | ||
| Turnout | 32,094 | 50.0 | −12.7 | ||
| Labour hold | Swing | ||||
Elections in the 1990s edit
| Party | Candidate | Votes | % | ±% | |
|---|---|---|---|---|---|
| Labour | John Battle | 26,819 | 66.7 | +11.6 | |
| Conservative | John Whelan | 7,048 | 17.5 | −8.7 | |
| Liberal Democrats | Nigel Amor | 3,622 | 9.0 | +0.1 | |
| Referendum | Bill Finley | 1,210 | 3.0 | 0.0 | |
| Green | David Blackburn | 896 | 2.2 | +1.0 | |
| Liberal | Noel Nowosielski | 625 | 1.6 | −6.7 | |
| Majority | 19,771 | 49.2 | +20.2 | ||
| Turnout | 40,220 | 62.9 | −8,2 | ||
| Labour hold | Swing | ||||
| Party | Candidate | Votes | % | ±% | |
|---|---|---|---|---|---|
| Labour | John Battle | 26,310 | 55.1 | +11.9 | |
| Conservative | Paul Bartlett | 12,482 | 26.2 | +3.0 | |
| Liberal Democrats | George Howard | 4,252 | 8.9 | −24.7 | |
| Liberal | Michael Meadowcroft | 3,980 | 8.3 | New | |
| Green | Alison M. Mander | 569 | 1.2 | New | |
| National Front | Robert I. Tenney | 132 | 0.3 | New | |
| Majority | 13,828 | 29.0 | +19.4 | ||
| Turnout | 47,725 | 71.2 | −2.1 | ||
| Labour hold | Swing | +4.5 | |||
Elections in the 1980s edit
| Party | Candidate | Votes | % | ±% | |
|---|---|---|---|---|---|
| Labour | John Battle | 21,032 | 43.2 | +9.2 | |
| Liberal | Michael Meadowcroft | 16,340 | 33.6 | −4.8 | |
| Conservative | Philip Allott | 11,276 | 23.2 | −3.7 | |
| Majority | 4,692 | 9.6 | N/A | ||
| Turnout | 48,648 | 73.3 | +4.3 | ||
| Labour gain from Liberal | Swing | +7.0 | |||
| Party | Candidate | Votes | % | ±% | |
|---|---|---|---|---|---|
| Liberal | Michael Meadowcroft | 17,908 | 38.4 | ||
| Labour | Joseph Dean | 15,860 | 34.0 | ||
| Conservative | Jocelyn Keeble | 12,515 | 26.9 | ||
| BNP | A. Braithwaite | 334 | 0.7 | New | |
| Majority | 2,048 | 4.4 | N/A | ||
| Turnout | 46,617 | 69.0 | |||
| Liberal gain from Labour | Swing | ||||
Elections in the 1970s edit
| Party | Candidate | Votes | % | ±% | |
|---|---|---|---|---|---|
| Labour | Joseph Dean | 21,290 | 49.38 | ||
| Conservative | H. Simmonds | 11,626 | 26.96 | ||
| Liberal | C. Greenfield | 9,734 | 22.58 | ||
| National Front | J. Duckenfield | 466 | 1.08 | New | |
| Majority | 9,664 | 22.42 | |||
| Turnout | 43,116 | 73.33 | |||
| Labour hold | Swing | ||||
| Party | Candidate | Votes | % | ±% | |
|---|---|---|---|---|---|
| Labour | Joseph Dean | 20,669 | 49.64 | ||
| Liberal | Michael Meadowcroft | 13,062 | 31.37 | ||
| Conservative | D. Hall | 7,907 | 18.99 | ||
| Majority | 7,607 | 18.27 | |||
| Turnout | 41,638 | 68.93 | |||
| Labour hold | Swing | ||||
| Party | Candidate | Votes | % | ±% | |
|---|---|---|---|---|---|
| Labour | Joseph Dean | 19,436 | 42.13 | ||
| Liberal | Michael Meadowcroft | 15,451 | 33.49 | ||
| Conservative | D. Hall | 11,246 | 24.38 | ||
| Majority | 3,985 | 8.64 | |||
| Turnout | 46,133 | 77.03 | |||
| Labour hold | Swing | ||||
| Party | Candidate | Votes | % | ±% | |
|---|---|---|---|---|---|
| Labour | Charles Pannell | 21,618 | 51.83 | ||
| Conservative | Alexander Leitch | 14,749 | 35.36 | ||
| Liberal | Patricia Armitage | 5,341 | 12.81 | ||
| Majority | 6,869 | 16.47 | |||
| Turnout | 41,708 | 65.69 | |||
| Labour hold | Swing | ||||
Elections in the 1960s edit
| Party | Candidate | Votes | % | ±% | |
|---|---|---|---|---|---|
| Labour | Charles Pannell | 24,391 | 56.28 | ||
| Conservative | Michael Glover | 13,883 | 32.04 | ||
| Liberal | Denis Pedder | 5,062 | 11.68 | ||
| Majority | 10,508 | 24.24 | |||
| Turnout | 43,336 | 72.02 | |||
| Labour hold | Swing | ||||
| Party | Candidate | Votes | % | ±% | |
|---|---|---|---|---|---|
| Labour | Charles Pannell | 22,968 | 50.53 | ||
| Conservative | Michael Glover | 15,697 | 34.54 | ||
| Liberal | Denis Pedder | 6,787 | 14.93 | New | |
| Majority | 7,271 | 15.99 | |||
| Turnout | 45,452 | 74.54 | |||
| Labour hold | Swing | ||||
Elections in the 1950s edit
| Party | Candidate | Votes | % | ±% | |
|---|---|---|---|---|---|
| Labour | Charles Pannell | 25,878 | 54.87 | ||
| Conservative | David Crouch | 21,285 | 45.13 | ||
| Majority | 4,593 | 9.74 | |||
| Turnout | 47,163 | 78.25 | |||
| Labour hold | Swing | ||||
| Party | Candidate | Votes | % | ±% | |
|---|---|---|---|---|---|
| Labour | Charles Pannell | 24,576 | 52.75 | ||
| Conservative | Joseph Hiley | 18,312 | 39.31 | ||
| Liberal | Harold Hudson | 3,699 | 7.94 | New | |
| Majority | 6,264 | 13.44 | |||
| Turnout | 46,587 | 77.38 | |||
| Labour hold | Swing | ||||
| Party | Candidate | Votes | % | ±% | |
|---|---|---|---|---|---|
| Labour | Charles Pannell | 22,357 | 54.11 | ||
| Conservative | Bertrand Mather | 18,957 | 45.89 | ||
| Majority | 3,400 | 8.22 | |||
| Turnout | 41,314 | 85.92 | |||
| Labour hold | Swing | ||||
| Party | Candidate | Votes | % | ±% | |
|---|---|---|---|---|---|
| Labour | Charles Pannell | 21,339 | 51.58 | ||
| Conservative | Bertrand Mather | 16,824 | 40.67 | ||
| Liberal | Cecil Rhodes | 3,209 | 7.76 | ||
| Majority | 4,515 | 10.91 | |||
| Turnout | 41,372 | 86.42 | |||
| Labour hold | Swing | ||||
Elections in the 1940s edit
| Party | Candidate | Votes | % | ±% | |
|---|---|---|---|---|---|
| Labour | Charles Pannell | 21,935 | 55.2 | -3.8 | |
| Conservative | Bernard Mather | 17,826 | 44.8 | +17.1 | |
| Majority | 4,109 | 10.4 | -21.0 | ||
| Turnout | 39,761 | ||||
| Labour hold | Swing | ||||
| Party | Candidate | Votes | % | ±% | |
|---|---|---|---|---|---|
| Labour | Thomas Stamford | 26,593 | 59.0 | +14.3 | |
| Conservative | Vyvyan Adams | 12,457 | 27.7 | -26.6 | |
| Liberal | James Booth | 6,008 | 13.3 | New | |
| Majority | 14,136 | 31.3 | N/A | ||
| Turnout | 45,058 | 76.1 | +5.6 | ||
| Labour gain from Conservative | Swing | ||||
Elections in the 1930s edit
| Party | Candidate | Votes | % | ±% | |
|---|---|---|---|---|---|
| Conservative | Vyvyan Adams | 20,545 | 54.27 | ||
| Labour | Thomas Stamford | 17,311 | 45.73 | ||
| Majority | 3,234 | 8.54 | |||
| Turnout | 37,856 | 70.46 | |||
| Conservative hold | Swing | ||||
| Party | Candidate | Votes | % | ±% | |
|---|---|---|---|---|---|
| Conservative | Vyvyan Adams | 24,701 | 63.25 | ||
| Labour | Thomas Stamford | 14,354 | 36.75 | ||
| Majority | 10,347 | 26.50 | N/A | ||
| Turnout | 39,055 | 76.72 | |||
| Conservative gain from Labour | Swing | ||||
Elections in the 1920s edit
| Party | Candidate | Votes | % | ±% | |
|---|---|---|---|---|---|
| Labour | Thomas Stamford | 18,765 | 47.2 | +4.7 | |
| Unionist | George William Martin | 13,129 | 33.0 | −9.5 | |
| Liberal | Ralph Cleworth | 7,894 | 19.8 | +4.8 | |
| Majority | 5,636 | 14.2 | +14.2 | ||
| Turnout | 39,788 | 79.4 | +1.9 | ||
| Registered electors | 50,107 | ||||
| Labour hold | Swing | +7.1 | |||
| Party | Candidate | Votes | % | ±% | |
|---|---|---|---|---|---|
| Labour | Thomas Stamford | 13,057 | 42.5 | +1.8 | |
| Unionist | Alexander Frederick Gordon Renton | 13,054 | 42.5 | +8.9 | |
| Liberal | Herbert Brown | 4,597 | 15.0 | −10.7 | |
| Majority | 3 | 0.0 | −7.1 | ||
| Turnout | 30,708 | 77.5 | +5.9 | ||
| Registered electors | 39,644 | ||||
| Labour hold | Swing | −3.6 | |||
| Party | Candidate | Votes | % | ±% | |
|---|---|---|---|---|---|
| Labour | Thomas Stamford | 11,434 | 40.7 | −7.6 | |
| Unionist | Alexander Frederick Gordon Renton | 9,432 | 33.6 | New | |
| Liberal | John Murray | 7,200 | 25.7 | −26.0 | |
| Majority | 2,002 | 7.1 | N/A | ||
| Turnout | 28,066 | 71.6 | +4.0 | ||
| Registered electors | 39,175 | ||||
| Labour gain from Liberal | Swing | +9.2 | |||
| Party | Candidate | Votes | % | ±% | |
|---|---|---|---|---|---|
| Liberal | John Murray | 13,391 | 51.7 | −10.2 | |
| Labour | Thomas Stamford | 12,487 | 48.3 | +18.8 | |
| Majority | 904 | 3.4 | −29.0 | ||
| Turnout | 25,878 | 67.6 | +14.9 | ||
| Registered electors | 38,259 | ||||
| Liberal hold | Swing | −14.5 | |||
Elections in the 1910s edit
| Party | Candidate | Votes | % | ±% | |
|---|---|---|---|---|---|
| C | Liberal | John Murray | 12,642 | 61.9 | −4.3 |
| Labour | John Arnott | 6,020 | 29.5 | New | |
| Independent | Joseph Henry Chapman* | 1,138 | 5.6 | New | |
| Independent Liberal | David Thomas Barnes | 619 | 3.0 | New | |
| Majority | 6,622 | 32.4 | 0.0 | ||
| Turnout | 20,419 | 52.7 | −17.0 | ||
| Registered electors | 38,766 | ||||
| Liberal hold | Swing | N/A | |||
| C indicates candidate endorsed by the coalition government. | |||||
* Chapman was supported by the three local branches of National Association of Discharged Sailors and Soldiers, National Federation of Discharged and Demobilized Sailors and Soldiers and Comrades of the Great War.
General Election 1914–15:
Another General Election was required to take place before the end of 1915. The political parties had been making preparations for an election to take place and by the July 1914, the following candidates had been selected;
- Liberal: Edmund Harvey
- Unionist:
| Party | Candidate | Votes | % | ±% | |
|---|---|---|---|---|---|
| Liberal | Edmund Harvey | 8,715 | 66.2 | +6.2 | |
| Conservative | George Jones | 4,445 | 33.8 | -6.2 | |
| Majority | 4,270 | 32.4 | +12.4 | ||
| Turnout | 13,160 | 69.7 | -18.4 | ||
| Liberal hold | Swing | +6.2 | |||
| Party | Candidate | Votes | % | ±% | |
|---|---|---|---|---|---|
| Liberal | Edmund Harvey | 9,969 | 60.0 | -6.6 | |
| Conservative | Samuel Samuel | 6,654 | 40.0 | +6.6 | |
| Majority | 3,315 | 20.0 | -13.2 | ||
| Turnout | 16,623 | 88.1 | +13.0 | ||
| Liberal hold | Swing | -6.6 | |||
Elections in the 1900s edit
| Party | Candidate | Votes | % | ±% | |
|---|---|---|---|---|---|
| Liberal | Herbert Gladstone | 9,258 | 66.6 | +14.7 | |
| Conservative | Samuel Samuel | 4,650 | 33.4 | -14.7 | |
| Majority | 4,608 | 33.2 | +29.4 | ||
| Turnout | 13,908 | 75.1 | -5.3 | ||
| Registered electors | 18,518 | ||||
| Liberal hold | Swing | +14.7 | |||
| Party | Candidate | Votes | % | ±% | |
|---|---|---|---|---|---|
| Liberal | Herbert Gladstone | 7,043 | 51.9 | +1.5 | |
| Liberal Unionist | Walter Harding | 6,522 | 48.1 | -1.5 | |
| Majority | 521 | 3.8 | +3.0 | ||
| Turnout | 13,565 | 80.4 | -6.9 | ||
| Registered electors | 16,867 | ||||
| Liberal hold | Swing | +1.5 | |||
Elections in the 1890s edit

| Party | Candidate | Votes | % | ±% | |
|---|---|---|---|---|---|
| Liberal | Herbert Gladstone | 6,314 | 50.4 | -1.1 | |
| Conservative | John Thomas North | 6,218 | 49.6 | +1.1 | |
| Majority | 96 | 0.8 | -2.2 | ||
| Turnout | 12,532 | 87.3 | +1.5 | ||
| Registered electors | 14,358 | ||||
| Liberal hold | Swing | -1.1 | |||
| Party | Candidate | Votes | % | ±% | |
|---|---|---|---|---|---|
| Liberal | Herbert Gladstone | Unopposed | |||
| Liberal hold | |||||
Gladstone is appointed First Commissioner of Works, requiring a by-election.
| Party | Candidate | Votes | % | ±% | |
|---|---|---|---|---|---|
| Liberal | Herbert Gladstone | 5,974 | 51.5 | -12.3 | |
| Conservative | Arthur Greenwood[32] | 5,621 | 48.5 | +12.3 | |
| Majority | 353 | 3.0 | -24.6 | ||
| Turnout | 11,595 | 85.8 | +17.8 | ||
| Registered electors | 13,510 | ||||
| Liberal hold | Swing | -12.3 | |||
Elections in the 1880s edit
| Party | Candidate | Votes | % | ±% | |
|---|---|---|---|---|---|
| Liberal | Herbert Gladstone | 5,226 | 63.8 | +2.1 | |
| Conservative | Charles Williams | 2,970 | 36.2 | -2.1 | |
| Majority | 2,256 | 27.6 | +4.2 | ||
| Turnout | 8,196 | 68.0 | -14.4 | ||
| Registered electors | 12,058 | ||||
| Liberal hold | Swing | +1.6 | |||
| Party | Candidate | Votes | % | ±% | |
|---|---|---|---|---|---|
| Liberal | Herbert Gladstone | 6,130 | 61.7 | ||
| Conservative | William Wheelhouse | 3,804 | 38.3 | ||
| Majority | 2,326 | 23.4 | |||
| Turnout | 9,934 | 82.4 | |||
| Registered electors | 12,058 | ||||
| Liberal win (new seat) | |||||
See also edit
References edit
- ^ "Leeds West Parliamentary constituency". BBC. 12 December 2019. Retrieved 4 January 2020.
- ^ a b "The 2023 Review of Parliamentary Constituency Boundaries in England – Volume one: Report – Yorkshire and the Humber | Boundary Commission for England". boundarycommissionforengland.independent.gov.uk. Retrieved 22 July 2023.
- ^ "The House of Commons (Redistribution of Seats) Order 1951. SI 1951/320". Statutory Instruments 1951. Vol. II. London: Her Majesty's Stationery Office. 1952. pp. 410–412.
- ^ "Election Maps". Ordnance Survey. Retrieved 3 May 2021.
- ^ Leigh Rayment's Historical List of MPs – Constituencies beginning with "L" (part 1)
- ^ "Leeds West Constituency". Leeds City Council. Retrieved 25 November 2019.
- ^ "General election candidates announced for Leeds West and Pudsey constituencies - West Leeds Dispatch". 11 May 2017.
- ^ "Election Data 2015". Electoral Calculus. Archived from the original on 17 October 2015. Retrieved 17 October 2015.
- ^ "Leeds West". BBC News. Retrieved 13 May 2015.
- ^ "Election Data 2010". Electoral Calculus. Archived from the original on 26 July 2013. Retrieved 17 October 2015.
- ^ "UK > England > Yorkshire & the Humber > Leeds West". Election 2010. BBC. 7 May 2010. Retrieved 11 May 2010.
- ^ "Election Data 2005". Electoral Calculus. Archived from the original on 15 October 2011. Retrieved 18 October 2015.
- ^ "Election Data 2001". Electoral Calculus. Archived from the original on 15 October 2011. Retrieved 18 October 2015.
- ^ "Election Data 1997". Electoral Calculus. Archived from the original on 15 October 2011. Retrieved 18 October 2015.
- ^ "Election Data 1992". Electoral Calculus. Archived from the original on 15 October 2011. Retrieved 18 October 2015.
- ^ "Politics Resources". Election 1992. Politics Resources. 9 April 1992. Archived from the original on 24 July 2011. Retrieved 6 December 2010.
- ^ "Election Data 1987". Electoral Calculus. Archived from the original on 15 October 2011. Retrieved 18 October 2015.
- ^ "Politics Resources". Election 1987. Politics Resources. 11 June 1987. Archived from the original on 4 March 2016. Retrieved 17 October 2011.
- ^ "Election Data 1983". Electoral Calculus. Archived from the original on 15 October 2011. Retrieved 18 October 2015.
- ^ "Politics Resources". Election 1983. Politics Resources. 9 June 1983. Archived from the original on 4 March 2016. Retrieved 17 October 2011.
- ^ The Times' Guide to the House of Commons. 1970.
- ^ The Times' Guide to the House of Commons. 1966.
- ^ The Times' Guide to the House of Commons. 1964.
- ^ The Times' Guide to the House of Commons. 1959.
- ^ The Times' Guide to the House of Commons. 1955.
- ^ The Times' Guide to the House of Commons. 1951.
- ^ "By-election Blog". Election 1945. Blogspot. 21 July 1949. Archived from the original on 19 April 2013. Retrieved 8 November 2011.
- ^ "Politics Resources". Election 1945. Politics Resources. 5 July 1945. Archived from the original on 24 September 2015. Retrieved 8 November 2011.
- ^ British Parliamentary Election Results 1918-1949, FWS Craig
- ^ a b c d Craig, F. W. S. (1983). British parliamentary election results 1918-1949 (3 ed.). Chichester: Parliamentary Research Services. ISBN 0-900178-06-X.
- ^ a b c d e f g h i British Parliamentary Election Results 1885-1918, FWS Craig
- ^ "The Representation of West Leeds: Adoption of Mr Arthur Greenwood". Yorkshire Post and Leeds Intelligencer. 30 July 1890. p. 6. Retrieved 22 November 2017.
53°47′53″N 1°34′34″W / 53.798°N 1.576°W