
KNOWPIA
WELCOME TO KNOWPIA

List of German states by life expectancy 
Summary
The official statistics of Germany, available on the Destatis website, do not include total life expectancy for the population as a whole. For a more correct comparison of regions with various differences in life expectancy for men and women, a column with the arithmetic mean of these indicators was added to the tables.
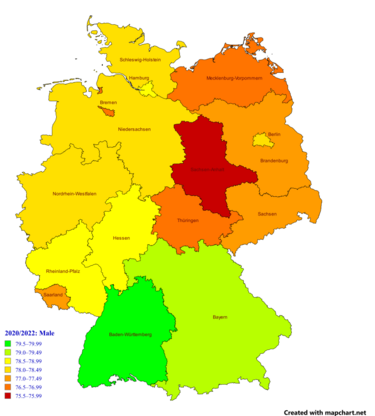
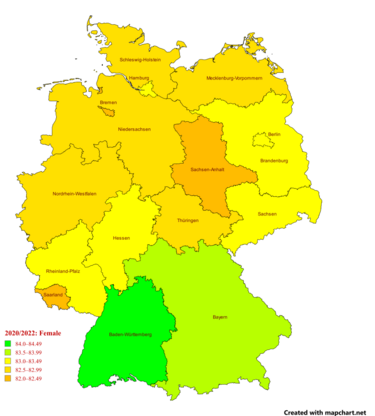
Destatis (2020/2022) edit
| state | male | female | sex gap | arith. mean |
|---|---|---|---|---|
| Germany on average | 78.33 | 83.18 | 4.85 | 80.76 |
| Baden-Württemberg | 79.72 | 84.11 | 4.39 | 81.91 |
| Bavaria | 79.11 | 83.64 | 4.53 | 81.38 |
| Hesse | 78.87 | 83.33 | 4.46 | 81.10 |
| Hamburg | 78.57 | 83.23 | 4.66 | 80.90 |
| Rhineland-Palatinate | 78.54 | 83.01 | 4.47 | 80.78 |
| Berlin | 78.11 | 83.29 | 5.18 | 80.70 |
| Schleswig-Holstein | 78.41 | 82.91 | 4.50 | 80.66 |
| Lower Saxony | 78.05 | 82.93 | 4.88 | 80.49 |
| North Rhine-Westphalia | 78.10 | 82.66 | 4.56 | 80.38 |
| Saxony | 77.27 | 83.49 | 6.22 | 80.38 |
| Brandenburg | 77.24 | 83.19 | 5.95 | 80.22 |
| Thuringia | 76.94 | 82.72 | 5.78 | 79.83 |
| Mecklenburg-Vorpommern | 76.68 | 82.79 | 6.11 | 79.74 |
| Saarland | 77.22 | 82.06 | 4.84 | 79.64 |
| Bremen | 76.93 | 82.30 | 5.37 | 79.62 |
| Saxony-Anhalt | 75.78 | 82.28 | 6.50 | 79.03 |
Destatis (2016/2018) edit
This is a list of German states by life expectancy at birth (average of 2016 to 2018) according to the Federal Statistical Office of Germany.[4]
| Rank | State | Life expectancy in years (mean of both) |
Life expectancy in years (men) |
Life expectancy in years (women) |
|---|---|---|---|---|
| 1 | 81.88 | 79.66 | 84.10 | |
| 2 | 81.56 | 79.33 | 83.56 | |
| 3 | 81.32 | 79.15 | 83.48 | |
| 4 | 80.95 | 78.53 | 83.37 | |
| 5 | 80.94 | 77.97 | 83.91 | |
| 6 | 80.84 | 78.62 | 83.06 | |
| 7 | 80.75 | 78.30 | 83.19 | |
| 8 | 80.51 | 77.76 | 83.26 | |
| 9 | 80.48 | 78.18 | 82.78 | |
| 10 | 80.47 | 78.11 | 82.82 | |
| 10 | 80.47 | 78.17 | 82.76 | |
| 12 | 80.23 | 77.44 | 83.02 | |
| 13 | 79.95 | 76.76 | 83.14 | |
| 14 | 79.88 | 77.62 | 82.14 | |
| 15 | 79.83 | 77.18 | 82.47 | |
| 16 | 79.46 | 76.28 | 82.63 | |
| 80.88 | 78.48 | 83.27 |
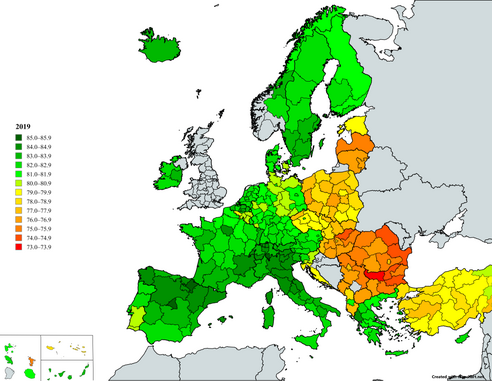
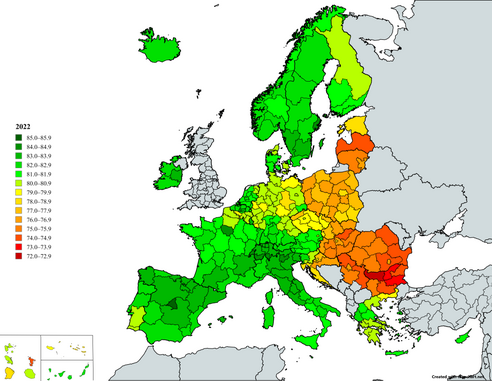
Eurostat (2019—2022) edit
By default the table is sorted by 2022.
| code | region | 2019 | 2019 →2021 |
2021 | 2021 →2022 |
2022 | 2019 →2022 | ||||||
|---|---|---|---|---|---|---|---|---|---|---|---|---|---|
| overall | male | female | F Δ M | overall | overall | male | female | F Δ M | |||||
| DE21 | Upper Bavaria | 82.8 | 80.9 | 84.7 | 3.8 | −0.4 | 82.4 | −0.1 | 82.3 | 80.2 | 84.4 | 4.2 | −0.5 |
| DE14 | Tübingen | 82.4 | 80.3 | 84.6 | 4.3 | 0.0 | 82.4 | −0.3 | 82.1 | 80.0 | 84.2 | 4.2 | −0.3 |
| DE11 | Stuttgart | 82.6 | 80.4 | 84.7 | 4.3 | −0.3 | 82.3 | −0.3 | 82.0 | 79.9 | 84.0 | 4.1 | −0.6 |
| DE13 | Freiburg | 82.3 | 80.2 | 84.4 | 4.2 | −0.2 | 82.1 | −0.1 | 82.0 | 79.8 | 84.1 | 4.3 | −0.3 |
| DE12 | Karlsruhe | 81.8 | 79.6 | 84.0 | 4.4 | −0.1 | 81.7 | −0.1 | 81.6 | 79.5 | 83.7 | 4.2 | −0.2 |
| DE27 | Swabia | 82.1 | 80.0 | 84.2 | 4.2 | −0.5 | 81.6 | −0.1 | 81.5 | 79.4 | 83.7 | 4.3 | −0.6 |
| DED2 | Dresden | 81.9 | 79.1 | 84.8 | 5.7 | −1.4 | 80.5 | 1.0 | 81.5 | 78.6 | 84.5 | 5.9 | −0.4 |
| DE26 | Lower Franconia | 82.1 | 80.0 | 84.3 | 4.3 | −0.5 | 81.6 | −0.2 | 81.4 | 79.2 | 83.6 | 4.4 | −0.7 |
| DE71 | Darmstadt | 82.1 | 80.1 | 84.0 | 3.9 | −0.5 | 81.6 | −0.3 | 81.3 | 79.3 | 83.3 | 4.0 | −0.8 |
| DEA2 | Cologne | 81.3 | 79.2 | 83.4 | 4.2 | −0.1 | 81.2 | −0.3 | 80.9 | 78.7 | 83.0 | 4.3 | −0.4 |
| DE22 | Lower Bavaria | 81.4 | 79.4 | 83.5 | 4.1 | −0.8 | 80.6 | 0.3 | 80.9 | 78.5 | 83.3 | 4.8 | −0.5 |
| DE30 | Berlin | 81.5 | 79.1 | 83.9 | 4.8 | −0.5 | 81.0 | −0.1 | 80.9 | 78.3 | 83.4 | 5.1 | −0.6 |
| DEB3 | Rheinhessen-Pfalz | 81.3 | 79.2 | 83.4 | 4.2 | −0.2 | 81.1 | −0.3 | 80.8 | 78.6 | 82.9 | 4.3 | −0.5 |
| DE60 | Hamburg | 81.5 | 79.2 | 83.8 | 4.6 | −0.4 | 81.1 | −0.3 | 80.8 | 78.5 | 83.1 | 4.6 | −0.7 |
| DE25 | Middle Franconia | 81.3 | 79.0 | 83.4 | 4.4 | −0.6 | 80.7 | 0.1 | 80.8 | 78.5 | 83.0 | 4.5 | −0.5 |
| DEB2 | Trier | 81.7 | 79.6 | 83.7 | 4.1 | −0.1 | 81.6 | −1.0 | 80.6 | 78.4 | 82.9 | 4.5 | −1.1 |
| DEA4 | Detmold | 81.6 | 79.2 | 83.9 | 4.7 | −0.3 | 81.3 | −0.7 | 80.6 | 78.3 | 83.0 | 4.7 | −1.0 |
| DED5 | Leipzig | 81.0 | 78.1 | 84.0 | 5.9 | −0.7 | 80.3 | 0.3 | 80.6 | 77.6 | 83.7 | 6.1 | −0.4 |
| DE23 | Upper Palatinate | 81.3 | 79.1 | 83.4 | 4.3 | −0.7 | 80.6 | −0.1 | 80.5 | 78.2 | 82.8 | 4.6 | −0.8 |
| DE73 | Kassel | 81.3 | 79.0 | 83.6 | 4.6 | −0.7 | 80.6 | −0.2 | 80.4 | 78.2 | 82.7 | 4.5 | −0.9 |
| DEF0 | Schleswig-Holstein | 80.9 | 78.6 | 83.3 | 4.7 | 0.1 | 81.0 | −0.6 | 80.4 | 78.2 | 82.5 | 4.3 | −0.5 |
| DEB1 | Koblenz | 81.1 | 79.0 | 83.1 | 4.1 | −0.5 | 80.6 | −0.3 | 80.3 | 78.2 | 82.5 | 4.3 | −0.8 |
| DE72 | Giessen | 81.0 | 78.8 | 83.2 | 4.4 | −0.4 | 80.6 | −0.3 | 80.3 | 78.0 | 82.7 | 4.7 | −0.7 |
| DE94 | Weser-Ems | 81.0 | 78.6 | 83.4 | 4.8 | −0.1 | 80.9 | −0.6 | 80.3 | 78.0 | 82.7 | 4.7 | −0.7 |
| DE40 | Brandenburg | 81.2 | 78.4 | 84.0 | 5.6 | −1.2 | 80.0 | 0.3 | 80.3 | 77.4 | 83.2 | 5.8 | −0.9 |
| DED4 | Chemnitz | 80.8 | 77.8 | 83.9 | 6.1 | −1.8 | 79.0 | 1.3 | 80.3 | 77.3 | 83.3 | 6.0 | −0.5 |
| DE93 | Lüneburg | 80.9 | 78.5 | 83.2 | 4.7 | −0.2 | 80.7 | −0.5 | 80.2 | 78.0 | 82.5 | 4.5 | −0.7 |
| DEA3 | Münster | 81.1 | 78.7 | 83.4 | 4.7 | −0.6 | 80.5 | −0.3 | 80.2 | 78.0 | 82.4 | 4.4 | −0.9 |
| DE92 | Hanover | 81.0 | 78.4 | 83.5 | 5.1 | −0.3 | 80.7 | −0.6 | 80.1 | 77.7 | 82.7 | 5.0 | −0.9 |
| DE91 | Braunschweig | 80.6 | 78.4 | 82.9 | 4.5 | −0.2 | 80.4 | −0.4 | 80.0 | 77.7 | 82.3 | 4.6 | −0.6 |
| DE24 | Upper Franconia | 81.2 | 78.7 | 83.6 | 4.9 | −0.9 | 80.3 | −0.3 | 80.0 | 77.4 | 82.6 | 5.2 | −1.2 |
| DEA1 | Düsseldorf | 80.7 | 78.4 | 82.9 | 4.5 | −0.3 | 80.4 | −0.5 | 79.9 | 77.6 | 82.1 | 4.5 | −0.8 |
| DEG0 | Thuringia | 80.7 | 78.0 | 83.5 | 5.5 | −1.6 | 79.1 | 0.7 | 79.8 | 77.0 | 82.6 | 5.6 | −0.9 |
| DEA5 | Arnsberg | 80.4 | 78.0 | 82.7 | 4.7 | −0.5 | 79.9 | −0.2 | 79.7 | 77.4 | 81.9 | 4.5 | −0.7 |
| DE80 | Mecklenburg-Vorpommern | 80.3 | 77.3 | 83.5 | 6.2 | −0.6 | 79.7 | −0.1 | 79.6 | 76.6 | 82.7 | 6.1 | −0.7 |
| DEC0 | Saarland | 80.2 | 77.9 | 82.5 | 4.6 | −0.4 | 79.8 | −0.6 | 79.2 | 76.8 | 81.8 | 5.0 | −1.0 |
| DE50 | Bremen | 80.7 | 78.0 | 83.3 | 5.3 | −0.5 | 80.2 | −1.0 | 79.2 | 76.6 | 81.8 | 5.2 | −1.5 |
| DEE0 | Saxony-Anhalt | 80.0 | 77.0 | 83.1 | 6.1 | −1.4 | 78.6 | 0.2 | 78.8 | 75.7 | 82.1 | 6.4 | −1.2 |
Charts edit
-
![Development of life expectancy in Germany according to estimation of the World Bank Group[7]](//upload.wikimedia.org/wikipedia/commons/thumb/b/bc/Life_expectancy_by_WBG_-Germany.png/431px-Life_expectancy_by_WBG_-Germany.png) Development of life expectancy in Germany according to estimation of the World Bank Group[7]
Development of life expectancy in Germany according to estimation of the World Bank Group[7] -
![Life expectancy with calculated sex gap[7]](//upload.wikimedia.org/wikipedia/commons/thumb/b/bc/Life_expectancy_by_WBG_-Germany_-diff.png/360px-Life_expectancy_by_WBG_-Germany_-diff.png) Life expectancy with calculated sex gap[7]
Life expectancy with calculated sex gap[7] -
![Life expectancy in Germany according to estimation of Our World in Data[8]](//upload.wikimedia.org/wikipedia/commons/thumb/4/44/Life_expectancy_in_Germany.svg/319px-Life_expectancy_in_Germany.svg.png) Life expectancy in Germany according to estimation of Our World in Data[8]
Life expectancy in Germany according to estimation of Our World in Data[8] -
![Development of life expectancy in Germany in comparison to some big countries of the world[7]](//upload.wikimedia.org/wikipedia/commons/thumb/f/f5/Life_expectancy_in_some_big_countries.png/355px-Life_expectancy_in_some_big_countries.png) Development of life expectancy in Germany in comparison to some big countries of the world[7]
Development of life expectancy in Germany in comparison to some big countries of the world[7] -
![Development of life expectancy in Germany in comparison to the largest by population European countries[7]](//upload.wikimedia.org/wikipedia/commons/thumb/2/24/Life_expectancy_in_the_largest_European_countries.png/355px-Life_expectancy_in_the_largest_European_countries.png) Development of life expectancy in Germany in comparison to the largest by population European countries[7]
Development of life expectancy in Germany in comparison to the largest by population European countries[7]
![Development of life expectancy in Germany according to estimation of the World Bank Group[7]](http://upload.wikimedia.org/wikipedia/commons/thumb/b/bc/Life_expectancy_by_WBG_-Germany.png/431px-Life_expectancy_by_WBG_-Germany.png)
![Life expectancy with calculated sex gap[7]](http://upload.wikimedia.org/wikipedia/commons/thumb/b/bc/Life_expectancy_by_WBG_-Germany_-diff.png/360px-Life_expectancy_by_WBG_-Germany_-diff.png)
![Life expectancy in Germany according to estimation of Our World in Data[8]](http://upload.wikimedia.org/wikipedia/commons/thumb/4/44/Life_expectancy_in_Germany.svg/319px-Life_expectancy_in_Germany.svg.png)
![Development of life expectancy in Germany in comparison to some big countries of the world[7]](http://upload.wikimedia.org/wikipedia/commons/thumb/f/f5/Life_expectancy_in_some_big_countries.png/355px-Life_expectancy_in_some_big_countries.png)
![Development of life expectancy in Germany in comparison to the largest by population European countries[7]](http://upload.wikimedia.org/wikipedia/commons/thumb/2/24/Life_expectancy_in_the_largest_European_countries.png/355px-Life_expectancy_in_the_largest_European_countries.png)
-
![Life expectancy and healthy life expectancy in Germany on the background of other countries of the world in 2019[9]](//upload.wikimedia.org/wikipedia/commons/thumb/c/c2/Healthy_life_expectancy_bar_chart_-world.png/529px-Healthy_life_expectancy_bar_chart_-world.png) Life expectancy and healthy life expectancy in Germany on the background of other countries of the world in 2019[9]
Life expectancy and healthy life expectancy in Germany on the background of other countries of the world in 2019[9] -
![Life expectancy and healthy life expectancy for males and females separately[9]](//upload.wikimedia.org/wikipedia/commons/thumb/d/d0/Healthy_life_expectancy_bar_chart_-world_-sex.png/529px-Healthy_life_expectancy_bar_chart_-world_-sex.png) Life expectancy and healthy life expectancy for males and females separately[9]
Life expectancy and healthy life expectancy for males and females separately[9]
![Life expectancy and healthy life expectancy in Germany on the background of other countries of the world in 2019[9]](http://upload.wikimedia.org/wikipedia/commons/thumb/c/c2/Healthy_life_expectancy_bar_chart_-world.png/529px-Healthy_life_expectancy_bar_chart_-world.png)
![Life expectancy and healthy life expectancy for males and females separately[9]](http://upload.wikimedia.org/wikipedia/commons/thumb/d/d0/Healthy_life_expectancy_bar_chart_-world_-sex.png/529px-Healthy_life_expectancy_bar_chart_-world_-sex.png)
-
![Life expectancy and healthy life expectancy in Germany on the background of other countries of Europe in 2019[9]](//upload.wikimedia.org/wikipedia/commons/thumb/9/93/Healthy_life_expectancy_bar_chart_-Europe.png/530px-Healthy_life_expectancy_bar_chart_-Europe.png) Life expectancy and healthy life expectancy in Germany on the background of other countries of Europe in 2019[9]
Life expectancy and healthy life expectancy in Germany on the background of other countries of Europe in 2019[9] -
![Life expectancy and healthy life expectancy for males and females separately[9]](//upload.wikimedia.org/wikipedia/commons/thumb/1/13/Healthy_life_expectancy_bar_chart_-Europe_-sex.png/530px-Healthy_life_expectancy_bar_chart_-Europe_-sex.png) Life expectancy and healthy life expectancy for males and females separately[9]
Life expectancy and healthy life expectancy for males and females separately[9]
![Life expectancy and healthy life expectancy in Germany on the background of other countries of Europe in 2019[9]](http://upload.wikimedia.org/wikipedia/commons/thumb/9/93/Healthy_life_expectancy_bar_chart_-Europe.png/530px-Healthy_life_expectancy_bar_chart_-Europe.png)
![Life expectancy and healthy life expectancy for males and females separately[9]](http://upload.wikimedia.org/wikipedia/commons/thumb/1/13/Healthy_life_expectancy_bar_chart_-Europe_-sex.png/530px-Healthy_life_expectancy_bar_chart_-Europe_-sex.png)
See also edit
Wikimedia Commons has media related to Life expectancy charts for Germany.
References edit
- ^ a b c "Deaths, life expectancy: Life expectancy by sex and state". Federal Statistical Office of Germany. Retrieved 3 February 2024.
- ^ a b "Sterbefälle und Lebenserwartung: Durchschnittliche fernere Lebenserwartung (Periodensterbetafel) in den Bundesländern für Männer". Federal Statistical Office of Germany (in German). Retrieved 3 February 2024.
- ^ a b "Sterbefälle und Lebenserwartung: Durchschnittliche fernere Lebenserwartung (Periodensterbetafel) in den Bundesländern für Frauen". Federal Statistical Office of Germany (in German). Retrieved 3 February 2024.
- ^ "Lebenserwartung in Deutschland nach Bundesländern und Geschlecht 2015/2017 | Statistik". Statista (in German). Retrieved 2018-12-10.
- ^ a b "Life expectancy at birth by sex and NUTS 2 region". Eurostat. 14 March 2024. Retrieved 28 March 2024. — Dataset
- ^ a b "Life expectancy at birth by sex and NUTS 2 region". Eurostat. 14 March 2024. Retrieved 28 March 2024. — Table. For visualization use tab "Map"
- ^ a b c d "Life expectancy at birth, total - Germany". World Bank Group.
- ^ "Life expectancy at birth: Germany". Our World in Data.
- ^ a b c d "Life expectancy and Healthy life expectancy, data by country". World Health Organization. 2020. Retrieved 1 February 2024.
External links edit
- Federal Statistical Office