


Summary
These Solar System minor planets are the furthest from the Sun as of December 2021[update]. The objects have been categorized by their approximate current distance from the Sun, and not by the calculated aphelion of their orbit. The list changes over time because the objects are moving in their orbits. Some objects are inbound and some are outbound. It would be difficult to detect long-distance comets if it were not for their comas, which become visible when heated by the Sun. Distances are measured in astronomical units (AU, Sun–Earth distances). The distances are not the minimum (perihelion) or the maximum (aphelion) that may be achieved by these objects in the future.

Sun
Jupiter trojans (6,178)
Scattered disc (>300) Giant planets: J · S · U · N
Centaurs (44,000)
Kuiper belt (>1,000)
(scale in AU; epoch as of January 2015; # of objects in parentheses)
This list does not include near-parabolic comets of which many are known to be currently more than 100 AU (15 billion km) from the Sun, but are currently too far away to be observed by telescope. Trans-Neptunian objects are typically announced publicly months or years after their discovery, so as to make sure the orbit is correct before announcing it. Due to their greater distance from the Sun and slow movement across the sky, trans-Neptunian objects with observation arcs less than several years often have poorly constrained orbits. Particularly distant objects take several years of observations to establish a crude orbit solution before being announced. For instance, the most distant known trans-Neptunian object 2018 AG37 was discovered by Scott Sheppard in January 2018 but was announced three years later in February 2021.[1]
Noted objects edit
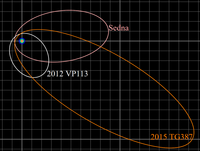
One particularly distant body is 90377 Sedna, which was discovered in November 2003. It has an extremely eccentric orbit that takes it to an aphelion of 937 AU.[2] It takes over 10,000 years to orbit, and during the next 50 years it will slowly move closer to the Sun as it comes to perihelion at a distance of 76 AU from the Sun.[3] Sedna is the largest known sednoid, a class of objects that play an important role in the Planet Nine hypothesis.
Pluto (30–49 AU, about 34 AU in 2015) was the first Kuiper belt object to be discovered (1930) and is the largest known dwarf planet.
Gallery edit
- Notable trans-Neptunian objects
-
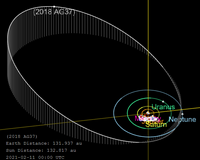 Orbit diagram of 2018 AG37, the furthest known Solar System object from the Sun as of 2022
 -
-

-
 Sedna viewed with Hubble Space Telescope, 2004


Known distant objects edit
This is a list of known objects at heliocentric distances of more than 65 AU. In theory, the Oort cloud could extend over 120,000 AU (2 ly) from the Sun.
| Object name | Distance from the Sun (AU) | Radial velocity (AU/yr)[a] |
Perihelion | Aphelion | Semimajor axis |
Apparent magnitude |
Absolute magnitude (H) |
Important dates | ||||||||||||||||||||||||||||||||||||||||||||||||||||||||||||||||||||||||||||||||||||||||||
|---|---|---|---|---|---|---|---|---|---|---|---|---|---|---|---|---|---|---|---|---|---|---|---|---|---|---|---|---|---|---|---|---|---|---|---|---|---|---|---|---|---|---|---|---|---|---|---|---|---|---|---|---|---|---|---|---|---|---|---|---|---|---|---|---|---|---|---|---|---|---|---|---|---|---|---|---|---|---|---|---|---|---|---|---|---|---|---|---|---|---|---|---|---|---|---|---|---|---|
| December 2021 | December 2015 | Discovered | Announced | |||||||||||||||||||||||||||||||||||||||||||||||||||||||||||||||||||||||||||||||||||||||||||||||
| Great Comet of 1680 (for comparison) |
258.0[5] | 255.4[5] | +0.47[5] | 0.006 | 889 | 444 | Unknown | Unknown | 1680-11-14 | — | ||||||||||||||||||||||||||||||||||||||||||||||||||||||||||||||||||||||||||||||||||||||||
| Voyager 1 (for comparison) |
152.9[5] | 133.3[5] | +3.57[5] | 8.90 | ∞ Hyperbolic |
−3.2[6] | ~50 | ~28 | — | — | ||||||||||||||||||||||||||||||||||||||||||||||||||||||||||||||||||||||||||||||||||||||||
| 2018 AG37 | 132.9±1.8 | 131.9±10.7 | ±0.2(?) | 27.1 | 145.0 | 86.0 | 25.4 | 4.2 | 2018-01-15 | 2021-02-10 | ||||||||||||||||||||||||||||||||||||||||||||||||||||||||||||||||||||||||||||||||||||||||
| Voyager 2 (for comparison) |
129.4[5] | 109.7[5] | +3.17[5] | 21.2 | ∞ Hyperbolic |
−4.0[6] | ~48 | ~28 | — | — | ||||||||||||||||||||||||||||||||||||||||||||||||||||||||||||||||||||||||||||||||||||||||
| Pioneer 10 (for comparison) |
128.9[5] | 114.8[5] | +2.51[5] | 4.94 | ∞ Hyperbolic |
~49 | ~29 | — | — | |||||||||||||||||||||||||||||||||||||||||||||||||||||||||||||||||||||||||||||||||||||||||
| 2018 VG18 | 123.6 | 123.2 | +0.06 | 37.8 | 123.9 | 81.3 | 24.6 | 3.7 | 2018-11-10 | 2018-12-17 | ||||||||||||||||||||||||||||||||||||||||||||||||||||||||||||||||||||||||||||||||||||||||
| 2020 BE102 | 110.9 | 111.7 | 32.9 | 116.9 | 74.9 | 25.6 | 5.1 | 2020-01-24 | 2022-05-31 | |||||||||||||||||||||||||||||||||||||||||||||||||||||||||||||||||||||||||||||||||||||||||
| Pioneer 11 (for comparison) |
107.7[5] | 92.5[5] | +2.35[5] | 9.45 | ∞ Hyperbolic |
~48 | ~29 | — | — | |||||||||||||||||||||||||||||||||||||||||||||||||||||||||||||||||||||||||||||||||||||||||
| 2020 FY30 | 98.9 | 99.9 | –0.17 | 35.6 | 107.7 | 71.6 | 24.8 | 4.7 | 2020-03-24 | 2021-02-14 | ||||||||||||||||||||||||||||||||||||||||||||||||||||||||||||||||||||||||||||||||||||||||
| 2020 FA31 | 97.3 | 96.5 | +0.14 | 39.5 | 102.4 | 71.0 | 25.4 | 5.4 | 2020-03-24 | 2021-02-14 | ||||||||||||||||||||||||||||||||||||||||||||||||||||||||||||||||||||||||||||||||||||||||
| Eris 136199 |
95.9 | 96.3 | −0.07 | 38.3 | 97.5 | 67.9 | 18.8 | −1.21 | 2003-10-21 | 2005-07-29 | ||||||||||||||||||||||||||||||||||||||||||||||||||||||||||||||||||||||||||||||||||||||||
| 2020 FQ40 | 92.4 | 92.7 | –0.05 | 38.2 | 93.1 | 65.6 | 25.7 | 6.1 | 2020-03-24 | 2022-05-31 | ||||||||||||||||||||||||||||||||||||||||||||||||||||||||||||||||||||||||||||||||||||||||
| 2015 TH367[b] | 90.3 | 88.2 | +0.42 | 28.9 | 136.4 | 82.6 | 26.3 | 6.6 | 2015-10-13 | 2018-03-13 | ||||||||||||||||||||||||||||||||||||||||||||||||||||||||||||||||||||||||||||||||||||||||
| 2021 DR15 | 89.6 | 88.6 | +0.17(?) | 37.8 | 96.5 | 67.2 | 23.1 | 3.6 | 2021-02-17 | 2021-12-17 | ||||||||||||||||||||||||||||||||||||||||||||||||||||||||||||||||||||||||||||||||||||||||
| 2014 UZ224 | 89.5 | 92.0 | −0.45 | 38.3 | 177.0 | 107.6 | 23.2 | 3.4 | 2014-10-21 | 2016-08-28 | ||||||||||||||||||||||||||||||||||||||||||||||||||||||||||||||||||||||||||||||||||||||||
| Gonggong 225088 |
88.7 | 87.4 | +0.23 | 33.7 | 101.2 | 67.5 | 21.5 | 1.6 | 2007-07-17 | 2009-01-07 | ||||||||||||||||||||||||||||||||||||||||||||||||||||||||||||||||||||||||||||||||||||||||
| 2015 FG415 | 87.2 | 87.9 | −0.14 | 36.2 | 92.1 | 64.1 | 25.5 | 6.0 | 2015-03-17 | 2019-03-27 | ||||||||||||||||||||||||||||||||||||||||||||||||||||||||||||||||||||||||||||||||||||||||
| 2014 FC69 | 85.5 | 84.1 | +0.26 | 40.4 | 104.4 | 72.4 | 24.2 | 4.6 | 2014-03-25 | 2015-02-11 | ||||||||||||||||||||||||||||||||||||||||||||||||||||||||||||||||||||||||||||||||||||||||
| 2006 QH181 | 84.6 | 83.3 | +0.22 | 37.5 | 96.7 | 67.1 | 23.7 | 4.3 | 2006-08-21 | 2006-11-05 | ||||||||||||||||||||||||||||||||||||||||||||||||||||||||||||||||||||||||||||||||||||||||
| Sedna 90377 |
84.2 | 85.8 | −0.29 | 76.3 | 892.6 | 484.4 | 21.0 | 1.3 | 2003-11-14 | 2004-03-15 | ||||||||||||||||||||||||||||||||||||||||||||||||||||||||||||||||||||||||||||||||||||||||
| 2015 VO166 | 84.3 | 82.5 | +0.32 | 38.3 | 113.2 | 75.8 | 25.5 | 5.9 | 2015-11-06 | 2018-10-02 | ||||||||||||||||||||||||||||||||||||||||||||||||||||||||||||||||||||||||||||||||||||||||
| 2012 VP113 | 84.2 | 83.3 | +0.16 | 80.4 | 442.6 | 261.5 | 23.5 | 4.0 | 2012-11-05 | 2014-03-26 | ||||||||||||||||||||||||||||||||||||||||||||||||||||||||||||||||||||||||||||||||||||||||
| 2013 FS28 | 83.5 | 85.9 | −0.62 | 34.2 | 358.2 | 196.2 | 24.3 | 4.9 | 2013-03-16 | 2016-08-29 | ||||||||||||||||||||||||||||||||||||||||||||||||||||||||||||||||||||||||||||||||||||||||
| 2017 SN132 | 82.8 | 80.4 | +0.44 | 42.0 | 110.0 | 76.0 | 25.2 | 5.8 | 2017-09-16 | 2019-02-10 | ||||||||||||||||||||||||||||||||||||||||||||||||||||||||||||||||||||||||||||||||||||||||
| 2019 EU5 | 81.7 | 85.5 | 46.5 | 2310 | 1178 | 25.6 | 6.4 | 2019-03-05 | 2021-12-17 | |||||||||||||||||||||||||||||||||||||||||||||||||||||||||||||||||||||||||||||||||||||||||
| 2015 UH87[b] | 81.3 | 82.3 | −0.19 | 34.3 | 90.0 | 62.2 | 25.2 | 6.0 | 2015-10-16 | 2018-03-12 | ||||||||||||||||||||||||||||||||||||||||||||||||||||||||||||||||||||||||||||||||||||||||
| 2013 FY27 532037 |
79.7 | 80.3 | −0.10 | 35.2 | 82.1 | 58.7 | 22.2 | 3.2 | 2013-03-17 | 2014-03-31 | ||||||||||||||||||||||||||||||||||||||||||||||||||||||||||||||||||||||||||||||||||||||||
| 2021 DP15 | 79.7 | 76.2 | 29.1 | 204.1 | 116.6 | 25.4 | 6.2 | 2021-02-16 | 2021-12-17 | |||||||||||||||||||||||||||||||||||||||||||||||||||||||||||||||||||||||||||||||||||||||||
| 2015 TJ367[b] | 79.4 | 77.1 | +0.42 | 33.6 | 128.1 | 80.9 | 25.8 | 6.7 | 2015-10-13 | 2018-03-13 | ||||||||||||||||||||||||||||||||||||||||||||||||||||||||||||||||||||||||||||||||||||||||
| 2017 FO161 | 78.1 | 79.1 | −0.18 | 34.1 | 85.5 | 59.8 | 23.3 | 4.3 | 2017-03-23 | 2018-04-02 | ||||||||||||||||||||||||||||||||||||||||||||||||||||||||||||||||||||||||||||||||||||||||
| Leleākūhonua 541132 |
77.6 | 79.8 | −0.40 | 65.2 | 2,106 | 1,085 | 24.6 | 5.5 | 2015-10-13 | 2018-10-01 | ||||||||||||||||||||||||||||||||||||||||||||||||||||||||||||||||||||||||||||||||||||||||
| 2018 AD39 | 77.2 | 74.1 | –0.58 | 38.4 | 287.9 | 163.2 | 25.0 | 6.2 | 2018-01-15 | 2021-02-13 | ||||||||||||||||||||||||||||||||||||||||||||||||||||||||||||||||||||||||||||||||||||||||
| 2020 FB31 | 75.8 | 76.8 | –0.19 | 34.4 | 83.3 | 59.1 | 24.5 | 5.6 | 2020-03-24 | 2021-02-14 | ||||||||||||||||||||||||||||||||||||||||||||||||||||||||||||||||||||||||||||||||||||||||
| 2018 AK39 | 75.3 | 75.4 | –0.01 | 27.3 | 75.4 | 51.4 | 25.3 | 6.5 | 2018-01-18 | 2021-02-18 | ||||||||||||||||||||||||||||||||||||||||||||||||||||||||||||||||||||||||||||||||||||||||
| 2021 LL37 | 73.9 | 74.2 | –0.05 | 36.1 | 74.6 | 55.4 | 22.7 | 4.0 | 2021-06-02 | 2022-05-31 | ||||||||||||||||||||||||||||||||||||||||||||||||||||||||||||||||||||||||||||||||||||||||
| 2010 GB174 | 73.6 | 70.7 | +0.54 | 48.7 | 630.7 | 339.7 | 25.3 | 6.5 | 2010-04-12 | 2013-04-30 | ||||||||||||||||||||||||||||||||||||||||||||||||||||||||||||||||||||||||||||||||||||||||
| 2015 VJ168 | 73.4 | 72.4 | +0.19 | 37.6 | 81.5 | 59.5 | 24.8 | 5.8 | 2015-11-06 | 2018-10-03 | ||||||||||||||||||||||||||||||||||||||||||||||||||||||||||||||||||||||||||||||||||||||||
| 2015 DU249 | 73.1 | 72.7 | +0.06 | 34.7 | 73.7 | 54.2 | 23.9 | 5.2 | 2015-02-17 | 2018-07-23 | ||||||||||||||||||||||||||||||||||||||||||||||||||||||||||||||||||||||||||||||||||||||||
| 2014 FJ72 | 72.6 | 70.1 | +0.46 | 38.4 | 148.2 | 93.3 | 24.4 | 5.6 | 2014-03-24 | 2016-08-31 | ||||||||||||||||||||||||||||||||||||||||||||||||||||||||||||||||||||||||||||||||||||||||
| 2016 TS97[b] | 71.2 | 71.5 | −0.04 | 36.2 | 71.7 | 54.0 | 24.9 | 6.1 | 2016-10-06 | 2018-04-02 | ||||||||||||||||||||||||||||||||||||||||||||||||||||||||||||||||||||||||||||||||||||||||
| 2015 GN55 | 71.0 | 72.1 | −0.19 | 32.5 | 78.4 | 55.5 | 24.6 | 5.8 | 2015-04-13 | 2018-09-02 | ||||||||||||||||||||||||||||||||||||||||||||||||||||||||||||||||||||||||||||||||||||||||
| 2015 VL168 | 69.7 | 72.1 | –0.44 | 37.7 | 136.0 | 86.8 | 24.7 | 6.1 | 2015-11-07 | 2018-10-03 | ||||||||||||||||||||||||||||||||||||||||||||||||||||||||||||||||||||||||||||||||||||||||
| 2020 BA95 | 69.6 | 68.4 | +0.20 | 35.9 | 76.5 | 56.2 | 24.3 | 5.8 | 2020-01-25 | 2021-12-17 | ||||||||||||||||||||||||||||||||||||||||||||||||||||||||||||||||||||||||||||||||||||||||
| 2015 RZ277 | 69.3 | 67.5 | +0.32 | 34.7 | 90.5 | 62.6 | 25.6 | 6.8 | 2015-09-08 | 2018-10-01 | ||||||||||||||||||||||||||||||||||||||||||||||||||||||||||||||||||||||||||||||||||||||||
| 2021 DJ17 | 69.0 | 69.2 | 40.4 | 69.4 | 54.9 | 23.2 | 6.7 | 2021-02-17 | 2022-05-31 | |||||||||||||||||||||||||||||||||||||||||||||||||||||||||||||||||||||||||||||||||||||||||
| 2012 FH84 | 68.8 | 68.4 | +0.07 | 41.9 | 70.1 | 56.0 | 25.8 | 7.2 | 2012-03-25 | 2016-06-07 | ||||||||||||||||||||||||||||||||||||||||||||||||||||||||||||||||||||||||||||||||||||||||
| 2019 AC77 | 68.7 | 69.9 | –0.21 | 35.0 | 79.0 | 57.0 | 25.0 | 6.6 | 2019-01-11 | 2021-02-14 | ||||||||||||||||||||||||||||||||||||||||||||||||||||||||||||||||||||||||||||||||||||||||
| 2015 GR50 | 68.6 | 68.2 | +0.07 | 38.2 | 69.7 | 54.0 | 25.2 | 6.6 | 2015-04-13 | 2016-08-31 | ||||||||||||||||||||||||||||||||||||||||||||||||||||||||||||||||||||||||||||||||||||||||
| 2013 FQ28 | 68.4 | 67.3 | +0.19 | 45.6 | 80.0 | 62.7 | 24.5 | 6.0 | 2013-03-17 | 2016-06-07 | ||||||||||||||||||||||||||||||||||||||||||||||||||||||||||||||||||||||||||||||||||||||||
| 2011 GM89 | 68.3 | 68.5 | –0.24 | 36.5 | 68.8 | 52.7 | 25.7 | 7.1 | 2011-04-04 | 2016-08-31 | ||||||||||||||||||||||||||||||||||||||||||||||||||||||||||||||||||||||||||||||||||||||||
| 2021 DQ15 | 68.3 | 71.4 | 27.8 | 130.9 | 79.3 | 24.7 | 6.3 | 2021-02-16 | 2021-12-17 | |||||||||||||||||||||||||||||||||||||||||||||||||||||||||||||||||||||||||||||||||||||||||
| 2021 DG17 | 67.6 | 66.7 | +0.15 | 47.5 | 75.8 | 61.7 | 23.2 | 5.0 | 2021-02-17 | 2022-05-31 | ||||||||||||||||||||||||||||||||||||||||||||||||||||||||||||||||||||||||||||||||||||||||
| 2015 GP50 | 67.5 | 68.1 | –0.10 | 40.4 | 70.0 | 55.2 | 25.0 | 6.5 | 2015-04-14 | 2016-06-07 | ||||||||||||||||||||||||||||||||||||||||||||||||||||||||||||||||||||||||||||||||||||||||
| 2016 CD289 | 67.2 | 66.2 | +0.18 | 37.5 | 74.0 | 55.8 | 25.7 | 7.3 | 2016-02-05 | 2018-03-13 | ||||||||||||||||||||||||||||||||||||||||||||||||||||||||||||||||||||||||||||||||||||||||
| 2018 VJ137 | 67.2 | 69.7 | –0.42 | 37.8 | 139.3 | 88.5 | 25.2 | 6.9 | 2018-01-15 | 2021-02-13 | ||||||||||||||||||||||||||||||||||||||||||||||||||||||||||||||||||||||||||||||||||||||||
| 2020 KV11 | 67.1 | 64.1 | +0.50 | 35.0 | 155.0 | 95.6 | 25.6 | 7.3 | 2020-05-29 | 2022-11-02 | ||||||||||||||||||||||||||||||||||||||||||||||||||||||||||||||||||||||||||||||||||||||||
| 2014 UD228 | 66.7 | 65.7 | +0.18 | 36.7 | 73.3 | 55.0 | 24.5 | 6.1 | 2014-10-22 | 2017-12-07 | ||||||||||||||||||||||||||||||||||||||||||||||||||||||||||||||||||||||||||||||||||||||||
| 2016 GB277 | 66.2 | 68.3 | –0.39 | 40.0 | 119.4 | 79.7 | 25.6 | 7.3 | 2016-04-10 | 2020-06-04 | ||||||||||||||||||||||||||||||||||||||||||||||||||||||||||||||||||||||||||||||||||||||||
| 2016 GZ276 | 66.1 | 69.2 | –0.56 | 38.6 | 253.6 | 146.1 | 25.3 | 7.0 | 2016-04-10 | 2020-06-03 | ||||||||||||||||||||||||||||||||||||||||||||||||||||||||||||||||||||||||||||||||||||||||
| 2014 FL72 | 66.1 | 63.3 | +0.47 | 38.0 | 167.1 | 102.5 | 25.1 | 6.8 | 2014-03-26 | 2016-08-31 | ||||||||||||||||||||||||||||||||||||||||||||||||||||||||||||||||||||||||||||||||||||||||
| 2016 TQ120[b] | 65.8 | 63.7 | +0.37 | 42.3 | 114.3 | 78.3 | 25.0 | 6.7 | 2016-10-06 | 2020-06-04 | ||||||||||||||||||||||||||||||||||||||||||||||||||||||||||||||||||||||||||||||||||||||||
| 2015 RQ281 | 65.7 | 62.7 | +0.56 | 36.9 | 210.6 | 123.8 | 25.1 | 6.8 | 2015-09-05 | 2019-03-27 | ||||||||||||||||||||||||||||||||||||||||||||||||||||||||||||||||||||||||||||||||||||||||
| 2020 BS60[b] | 65.7 | 68.0 | –0.42 | 31.0 | 104.1 | 67.6 | 24.6 | 6.5 | 2020-01-26 | 2021-02-23 | ||||||||||||||||||||||||||||||||||||||||||||||||||||||||||||||||||||||||||||||||||||||||
| 2013 UJ15 | 65.4 | 64.8 | +0.11 | 37.2 | 67.4 | 52.3 | 25.4 | 7.0 | 2013-10-28 | 2016-08-31 | ||||||||||||||||||||||||||||||||||||||||||||||||||||||||||||||||||||||||||||||||||||||||
| 2019 EV5 | 65.3 | 63.5 | +0.30 | 32.0 | 79.8 | 55.9 | 25.8 | 7.6 | 2020-03-05 | 2021-12-17 | ||||||||||||||||||||||||||||||||||||||||||||||||||||||||||||||||||||||||||||||||||||||||
| 2014 FD70 | 65.2 | 63.8 | +0.26 | 35.9 | 78.6 | 57.3 | 25.1 | 6.9 | 2014-03-25 | 2018-04-02 | ||||||||||||||||||||||||||||||||||||||||||||||||||||||||||||||||||||||||||||||||||||||||
| 2018 AZ18 | 65.1 | 65.9 | –0.15 | 39.1 | 70.5 | 54.8 | 26.0 | 7.7 | 2018-01-15 | 2019-03-27 | ||||||||||||||||||||||||||||||||||||||||||||||||||||||||||||||||||||||||||||||||||||||||
| 2015 KV167 | 65.0 | 65.2 | –0.03 | 38.0 | 65.3 | 51.6 | 25.6 | 7.2 | 2015-05-18 | 2018-03-13 | ||||||||||||||||||||||||||||||||||||||||||||||||||||||||||||||||||||||||||||||||||||||||
| 2018 VO35 | 65.0 | 67.8 | –0.51 | 35.2 | 152.2 | 93.7 | 24.9 | 6.8 | 2018-11-10 | 2019-02-10 | ||||||||||||||||||||||||||||||||||||||||||||||||||||||||||||||||||||||||||||||||||||||||
| 2020 KX11[b] | 65.0 | 65.0 | –0.01 | 64.6 | 67.1 | 65.9 | 26.4 | 8.2 | 2020-05-29 | 2020-09-25 | ||||||||||||||||||||||||||||||||||||||||||||||||||||||||||||||||||||||||||||||||||||||||
| This table includes all observable objects currently located at least 65 AU from the Sun.[4] | ||||||||||||||||||||||||||||||||||||||||||||||||||||||||||||||||||||||||||||||||||||||||||||||||||
See also edit
References edit
- ^ "MPEC 2021-C187 : 2018 AG37". Minor Planet Electronic Circular. Minor Planet Center. 10 February 2021. Retrieved 10 February 2021.
- ^ Horizons output. "Barycentric Osculating Orbital Elements for 90377 Sedna (2003 VB12)". Retrieved 18 September 2021. (Solution using the Solar System barycenter. Select Ephemeris Type:Elements and Center:@0) (Saved Horizons output file 2011-Feb-04 "Barycentric Osculating Orbital Elements for 90377 Sedna". Archived from the original on 19 November 2012.) In the second pane "PR=" can be found, which gives the orbital period in days (4.160E+06, which is 11,390 Julian years).
- ^ Most Distant Object In Solar System Discovered; NASA.gov; (2004)
- ^ a b "AstDyS-2, Asteroids – Dynamic Site". Retrieved 17 December 2021.
Objects with distance from Sun over 65 AU
- ^ a b c d e f g h i j k l m n o JPL Horizons On-Line Ephemeris System. "JPL Horizons On-Line Ephemeris". Retrieved 10 February 2021.
Ephemeris Type: Vector; Observer Location: @sun; Time Span: Start=2015-12-01, Stop=2021-06-01, Intervals=1; Table Settings: quantities code=6 - ^ a b "Voyager - Hyperbolic Orbital Elements".