
KNOWPIA
WELCOME TO KNOWPIA

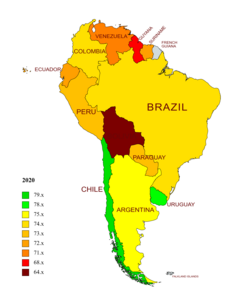
List of South American countries by life expectancy 
Summary
This is a list of South American countries by life expectancy at birth.
World Bank Group (2021) edit
Estimation of the World Bank Group for 2021.[1][2][3] The data is filtered according to the list of countries in South America. The values in the World Bank Group tables are rounded. All calculations are based on raw data, so due to the nuances of rounding, in some places illusory inconsistencies of indicators arose, with a size of 0.01 year.
| Countries | 2021 | Historical data | COVID-19 impact | |||||||||||||
|---|---|---|---|---|---|---|---|---|---|---|---|---|---|---|---|---|
| All | Male | Female | Sex gap | 2000 | 2000 →2014 |
2014 | 2014 →2019 |
2019 | 2019 →2020 |
2020 | 2020 →2021 |
2021 | 2019 →2021 |
2014 →2021 | ||
| 78.94 | 76.47 | 81.44 | 4.97 | 76.87 | 2.60 | 79.47 | 0.85 | 80.33 | −0.95 | 79.38 | −0.43 | 78.94 | −1.38 | −0.53 | ||
| 77.25 | 73.66 | 80.06 | 6.40 | 69.74 | 4.57 | 74.31 | 1.03 | 76.34 | −1.33 | 74.01 | -0,1 | 77.25 | −0.10 | −1.56 | ||
| 75.44 | 71.65 | 79.26 | 7.60 | 75.03 | 2.34 | 77.37 | 0.14 | 77.51 | 0.92 | 78.43 | −2.99 | 75.44 | −2.07 | −1.93 | ||
| 75.39 | 72.18 | 78.65 | 6.47 | 73.93 | 2.83 | 76.75 | 0.53 | 77.28 | −1.39 | 75.89 | −0.50 | 75.39 | −1.89 | −1.36 | ||
| 73.67 | 70.26 | 77.46 | 7.20 | 72.84 | 3.78 | 76.62 | 0.67 | 77.30 | −5.14 | 72.15 | 1.52 | 73.67 | −3.63 | −2.95 | ||
| 72.83 | 69.40 | 76.44 | 7.04 | 71.32 | 4.72 | 76.04 | 0.71 | 76.75 | −1.98 | 74.77 | −1.94 | 72.83 | −3.92 | −3.21 | ||
| 72.38 | 70.12 | 74.75 | 4.62 | 70.42 | 4.91 | 75.33 | 0.82 | 76.16 | −2.49 | 73.67 | −1.29 | 72.38 | −3.78 | −2.96 | ||
| World | 71.33 | 68.89 | 73.95 | 5.06 | 67.70 | 4.18 | 71.88 | 1.10 | 72.98 | −0.74 | 72.24 | −0.92 | 71.33 | −1.65 | −0.55 | |
| 70.55 | 66.26 | 75.21 | 8.95 | 72.48 | 0.38 | 72.85 | −0.69 | 72.16 | −1.07 | 71.09 | −0.54 | 70.55 | −1.61 | −2.30 | ||
| 70.27 | 67.21 | 73.55 | 6.34 | 65.51 | 4.27 | 69.78 | 2.46 | 72.24 | 0.32 | 72.56 | −2.29 | 70.27 | −1.97 | 0.49 | ||
| 70.26 | 67.43 | 73.39 | 5.95 | 69.75 | 3.13 | 72.88 | 0.74 | 73.62 | −0.44 | 73.18 | −2.92 | 70.26 | −3.36 | −2.62 | ||
| 65.67 | 62.48 | 69.10 | 6.62 | 64.48 | 3.40 | 67.88 | 1.24 | 69.12 | −0.64 | 68.49 | −2.81 | 65.67 | −3.45 | −2.21 | ||
| 63.63 | 60.88 | 66.80 | 5.92 | 62.35 | 4.82 | 67.16 | 0.68 | 67.84 | −3.37 | 64.47 | −0.84 | 63.63 | −4.21 | −3.53 | ||


Change in life expectancy in South America from 2019 to 2021[1]
United Nations (2022) edit
Estimation of the analytical agency of the UN.[4][5][6] By default, the list is sorted by 2022.
| Countries & territories |
2019 | 2019 →2021 |
2021 | 2021 →2022 |
2022 | 2019 →2022 |
||||||||||
|---|---|---|---|---|---|---|---|---|---|---|---|---|---|---|---|---|
| overall | male | female | F Δ M | overall | male | female | F Δ M | overall | male | female | F Δ M | |||||
| 80.2 | 77.8 | 82.4 | 4.6 | −1.3 | 78.9 | 76.5 | 81.4 | 4.9 | 0.6 | 79.5 | 77.2 | 81.9 | 4.7 | −0.7 | ||
| 77.9 | 74.1 | 81.5 | 7.4 | −2.5 | 75.4 | 71.7 | 79.3 | 7.6 | 2.6 | 78.0 | 74.1 | 81.7 | 7.6 | 0.1 | ||
| 77.0 | 74.3 | 79.8 | 5.5 | −3.3 | 73.7 | 70.3 | 77.5 | 7.2 | 4.2 | 77.9 | 75.3 | 80.5 | 5.2 | 0.9 | ||
| 76.7 | 73.2 | 80.0 | 6.8 | −1.3 | 75.4 | 72.2 | 78.6 | 6.4 | 0.7 | 76.1 | 72.9 | 79.3 | 6.4 | −0.6 | ||
| 77.3 | 74.5 | 80.0 | 5.5 | −4.5 | 72.8 | 69.4 | 76.4 | 7.0 | 0.9 | 73.7 | 70.3 | 77.1 | 6.8 | −3.6 | ||
| 76.7 | 74.1 | 79.5 | 5.4 | −4.3 | 72.4 | 70.1 | 74.7 | 4.6 | 1.0 | 73.4 | 71.3 | 75.5 | 4.2 | −3.3 | ||
| 75.9 | 72.2 | 79.6 | 7.4 | −3.1 | 72.8 | 69.6 | 76.0 | 6.4 | 0.6 | 73.4 | 70.3 | 76.6 | 6.3 | −2.5 | ||
| World | 72.8 | 70.6 | 75.0 | 4.4 | −1.4 | 71.4 | 68.9 | 74.0 | 5.1 | 0.6 | 72.0 | 69.6 | 74.5 | 4.9 | −0.8 | |
| 72.1 | 68.3 | 76.0 | 7.7 | −1.5 | 70.6 | 66.3 | 75.2 | 8.9 | 0.5 | 71.1 | 66.9 | 75.7 | 8.8 | −1.0 | ||
| 74.3 | 72.3 | 76.4 | 4.1 | −4.0 | 70.3 | 67.4 | 73.4 | 6.0 | 0.2 | 70.5 | 67.6 | 73.6 | 6.0 | −3.8 | ||
| 71.7 | 68.5 | 75.1 | 6.6 | −1.4 | 70.3 | 67.2 | 73.6 | 6.4 | 0.0 | 70.3 | 67.2 | 73.6 | 6.4 | −1.4 | ||
| 69.9 | 66.9 | 73.1 | 6.2 | −4.2 | 65.7 | 62.5 | 69.1 | 6.6 | 0.3 | 66.0 | 62.8 | 69.4 | 6.6 | −3.9 | ||
| 71.5 | 68.7 | 74.5 | 5.8 | −7.9 | 63.6 | 60.9 | 66.8 | 5.9 | 1.3 | 64.9 | 62.3 | 67.9 | 5.6 | −6.6 | ||
WHO (2019) edit
Estimation of the World Health Organization for 2019.[7][8]
| Countries | Life expectancy at birth | HALE at birth | Life expectancy at age 60 | HALE at age 60 | |||||||||||||||||
|---|---|---|---|---|---|---|---|---|---|---|---|---|---|---|---|---|---|---|---|---|---|
| All | M | F | FΔM | Δ 2000 |
All | M | F | FΔM | Δ 2000 |
All | M | F | FΔM | Δ 2000 |
All | M | F | FΔM | Δ 2000 | ||
| 80.7 | 78.1 | 83.2 | 5.1 | 3.9 | 70.0 | 69.0 | 71.1 | 2.1 | 3.0 | 24.3 | 22.4 | 25.9 | 3.5 | 3.0 | 18.4 | 17.3 | 19.3 | 2.0 | 2.0 | ||
| 79.9 | 78.5 | 81.3 | 2.8 | 5.5 | 69.5 | 69.2 | 69.8 | 0.6 | 4.6 | 24.4 | 23.7 | 25.1 | 1.4 | 2.1 | 18.5 | 18.3 | 18.7 | 0.4 | 1.5 | ||
| 79.3 | 76.7 | 81.9 | 5.2 | 5.6 | 69.0 | 67.4 | 70.5 | 3.1 | 4.9 | 24.0 | 22.5 | 25.3 | 2.8 | 2.3 | 18.1 | 17.1 | 18.9 | 1.8 | 1.8 | ||
| 78.4 | 76.4 | 80.5 | 4.1 | 3.9 | 68.5 | 67.7 | 69.3 | 1.6 | 3.3 | 23.2 | 22.0 | 24.3 | 2.3 | 1.3 | 17.6 | 17.0 | 18.2 | 1.2 | 0.8 | ||
| Americas[9] | 77.2 | 74.5 | 79.8 | 5.3 | 3.1 | 66.2 | 64.8 | 67.5 | 2.7 | 2.1 | 22.7 | 21.2 | 24.0 | 2.8 | 1.6 | 16.6 | 15.7 | 17.4 | 1.7 | 0.9 | |
| 77.1 | 73.5 | 80.6 | 7.1 | 2.3 | 67.5 | 65.4 | 69.5 | 4.1 | 1.6 | 21.7 | 19.0 | 24.0 | 5.0 | 1.1 | 16.6 | 14.9 | 18.2 | 3.3 | 0.6 | ||
| 76.6 | 73.5 | 79.5 | 6.0 | 2.5 | 67.1 | 65.4 | 68.8 | 3.4 | 2.0 | 21.1 | 18.8 | 23.1 | 4.3 | 0.9 | 16.3 | 14.8 | 17.6 | 2.8 | 0.7 | ||
| 75.9 | 72.4 | 79.4 | 7.0 | 4.4 | 65.4 | 63.4 | 67.4 | 4.0 | 3.7 | 21.9 | 20.1 | 23.5 | 3.4 | 2.2 | 16.4 | 15.2 | 17.4 | 2.2 | 1.6 | ||
| 75.8 | 73.1 | 78.8 | 5.7 | 1.0 | 65.8 | 64.5 | 67.3 | 2.8 | 0.8 | 21.8 | 20.2 | 23.5 | 3.3 | −0.2 | 16.5 | 15.4 | 17.6 | 2.2 | −0.3 | ||
| 73.9 | 69.9 | 78.2 | 8.3 | −0.2 | 64.4 | 61.9 | 67.1 | 5.2 | −0.3 | 21.7 | 19.7 | 23.6 | 3.9 | 0.4 | 16.3 | 15.0 | 17.5 | 2.5 | 0.3 | ||
| World | 73.3 | 70.8 | 75.9 | 5.1 | 6.5 | 63.7 | 62.5 | 64.9 | 2.4 | 5.4 | 21.1 | 19.5 | 22.7 | 3.2 | 2.3 | 15.8 | 14.8 | 16.6 | 1.8 | 1.7 | |
| 72.1 | 71.1 | 73.1 | 2.0 | 6.1 | 63.3 | 63.2 | 63.3 | 0.1 | 5.4 | 18.6 | 18.0 | 19.1 | 1.1 | 0.8 | 14.2 | 14.0 | 14.4 | 0.4 | 0.6 | ||
| 71.5 | 68.5 | 74.6 | 6.1 | 1.6 | 62.4 | 60.7 | 64.2 | 3.5 | 1.1 | 18.5 | 16.4 | 20.5 | 4.1 | −0.4 | 14.1 | 12.6 | 15.4 | 2.8 | −0.4 | ||
| 65.7 | 62.5 | 69.4 | 6.9 | 2.7 | 57.2 | 55.1 | 59.7 | 4.6 | 2.2 | 16.6 | 15.1 | 18.1 | 3.0 | 0.7 | 12.5 | 11.5 | 13.6 | 2.1 | 0.4 | ||
![Life expectancy and HALE in countries of America in 2019[7]](http://upload.wikimedia.org/wikipedia/commons/thumb/3/3d/Healthy_life_expectancy_bar_chart_-America.png/660px-Healthy_life_expectancy_bar_chart_-America.png)
![Elaboration by sex[7]](http://upload.wikimedia.org/wikipedia/commons/thumb/f/fc/Healthy_life_expectancy_bar_chart_-America_-sex.png/660px-Healthy_life_expectancy_bar_chart_-America_-sex.png)

Charts edit
-
![Comparison of life expectancy in some countries of South America[1]](//upload.wikimedia.org/wikipedia/commons/thumb/5/53/Life_expectancy_in_countries_of_South_America.png/449px-Life_expectancy_in_countries_of_South_America.png) Comparison of life expectancy in some countries of South America[1]
Comparison of life expectancy in some countries of South America[1]
![Comparison of life expectancy in some countries of South America[1]](http://upload.wikimedia.org/wikipedia/commons/thumb/5/53/Life_expectancy_in_countries_of_South_America.png/449px-Life_expectancy_in_countries_of_South_America.png)
See also edit
References edit
- ^ a b c "Life expectancy at birth, total". The World Bank Group. 29 June 2023. Retrieved 6 July 2023.
- ^ "Life expectancy at birth, male". The World Bank Group. 29 June 2023. Retrieved 6 July 2023.
- ^ "Life expectancy at birth, female". The World Bank Group. 29 June 2023. Retrieved 6 July 2023.
- ^ "Human Development Report 2020 (tables 1 and 4)" (PDF). UN Development Programme. Archived from the original (PDF) on 15 December 2020. Retrieved 28 February 2021.
- ^ "Human Development Report 2021/2022 (tables 1 and 4)" (PDF). UN Development Programme. Retrieved 28 June 2023.
- ^ "Human Development Report 2023/2024 (tables 1 and 4)" (PDF). UN Development Programme. 13 March 2024. Retrieved 4 April 2024.
- ^ a b c d "Life expectancy and Healthy life expectancy, data by country". World Health Organization. 4 December 2022.
- ^ "Life expectancy and Healthy life expectancy, data by WHO region". World Health Organization. 7 December 2022.
- ^ "WHO: PAHO: Countries and Centers". World Health Organization. Retrieved 7 May 2022.