


Summary
A high risk severe weather event is the greatest threat level issued by the Storm Prediction Center (SPC) for convective weather events in the United States. On the scale from one to five, a high risk is a level five; thus, high risks are issued only when forecasters at the SPC are confident of a major severe weather outbreak. This is usually for major tornado outbreaks with numerous strong to violent tornadoes expected, and occasionally derechos with widespread destructive wind gusts, and these outlooks are typically reserved for the most extreme events.[1] They are generally only issued on the day of the event. However, there have been two occurrences (April 7, 2006, and April 14, 2012) of a high risk being issued for Day 2 of the outlook period (with the event occurring the following day). Under the official protocol, a high risk cannot be issued for Day 3 of the outlook period.[2]

High risk days edit
1982–1989 edit
Thirty-four high risks were issued in the 1980s.
| Storm Prediction Center High Risk Events – 1982–1989[nb 1] | ||||||||
|---|---|---|---|---|---|---|---|---|
| Date | Year | Region | Tornadoes | Max rating | Peak gust | Fatalities | Outlook | Notes |
| April 2 | 1982 | Midwest, Southern U.S.[3][4] | 63 | F5
|
27 | 
|
Tornado outbreak of April 2–3, 1982 – Sixty-three tornadoes were confirmed; one was rated F5. The first ever PDS Tornado Watch was issued on this date. | |
| December 24 | 1982 | Southern U.S. | 26 | F4
|
3 | 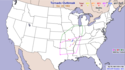
|
Twenty-six tornadoes were confirmed; one was rated F4. | |
| April 1 | 1983 | Midwest, Southern U.S. | 13 | F4
|
2 | 
|
Thirteen tornadoes were confirmed; one was rated F4. | |
| July 2 | 1983 | Midwest[5] | 3 | F1
|
0 | 
|
Only three weak tornadoes were confirmed; one was rated F1 | |
| March 27 | 1984 | Southern U.S.[6] | 11 | F1
|
0 | 
|
Eleven weak tornadoes were confirmed; six were rated F1.[7] | |
| March 28 | 1984 | Southern U.S.[8][9] | 24 | F4
|
57 | 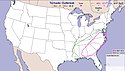
|
1984 Carolinas tornado outbreak – Twenty-four tornadoes were confirmed; seven were rated F4. In addition to the 57 tornadic deaths, 1,249 people were injured.[10] | |
| April 26 | 1984 | Great Plains[11] | 33 | F4
|
12 | 
|
Thirty-three tornadoes were confirmed; one was rated F4.[12] | |
| April 29 | 1984 | Midwest, Southern U.S.[13] | 42 | F4
|
1 | 
|
Forty-two tornadoes were confirmed; one was rated F4.[14] | |
| May 3 | 1984 | Southern U.S.[15][16] | 38 | F3
|
5 | Thirty-eight tornadoes were confirmed; one was rated F3.[17] | ||
| October 18 | 1984 | Midwest, Southern U.S.[18] | 8 | F3
|
2 | Eight tornadoes were confirmed; one was rated F3.[19] | ||
| April 21 | 1985 | Upper Midwest[20] | 22 | F3
|
3 | Twenty-two tornadoes were confirmed; one was rated F3.[21] | ||
| April 22 | 1985 | Southern U.S.[22] | 11 | F2
|
0 | Eleven tornadoes were confirmed; two were rated F2. | ||
| May 11 | 1985 | Midwest, Southern U.S.[23] | 24 | F1
|
0 | Twenty-four weak tornadoes were confirmed; three were rated F1.[24] | ||
| May 13 | 1985 | Midwest, Southern U.S.[25] | 14 | F2
|
0 | Fourteen tornadoes were confirmed; three were rated F2.[26] | ||
| May 30 | 1985 | Midwest[27] | 17 | F3
|
2 | 
|
Seventeen tornadoes were confirmed; one was rated F3.[28] | |
| July 4 | 1985 | Midwest[29] | 3 | F1
|
0 | Mainly a wind and hail event.[30] Three weak tornadoes were confirmed; two were rated F1.[31] | ||
| March 11 | 1986 | Southern U.S.[32] | 4 | F2
|
0 | Tornado outbreak of March 10–12, 1986 – Four tornadoes were confirmed; one was rated F2.[33] | ||
| April 19 | 1986 | Southern U.S.[34] | 13 | F3
|
1 | Fourteen tornadoes were confirmed; one was rated F3.[35] | ||
| March 22 | 1987 | Oklahoma, Texas[36] | 9 | F3
|
0 | 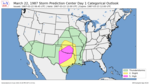
|
Nine tornadoes were confirmed; one was rated F3.[37] | |
| May 28 | 1987 | Texas[38] | 7 | F2
|
0 | 
|
Seven tornadoes were confirmed; one was rated F2.[39] | |
| July 20 | 1987 | Michigan[40] | 4 | F0
|
0 | 
|
Produced a derecho with damaging downburst winds.[41] Four weak tornadoes were confirmed.[42] | |
| November 16 | 1987 | Alabama, Louisiana, Mississippi[43] | 28 | F2
|
0 | 
|
Twenty-eight tornadoes were confirmed; six were rated F2.[44] | |
| December 14 | 1987 | Southern U.S.[45] | 5 | F3
|
6 | 
|
Five tornadoes were confirmed; one was rated F3. The F3 tornado struck the northern portions of the Memphis metropolitan area.[46] | |
| January 19 | 1988 | Alabama, Louisiana, Mississippi, Tennessee[47] | 14 | F4
|
5 | 
|
Earliest date that a high risk was issued. Fourteen tornadoes were confirmed; one was rated F4.[48] | |
| March 24 | 1988 | Midwest, Southern U.S.[49] | 10 | F2
|
0 | 
|
Damaging squall line with tornadoes.[50] Ten tornadoes were confirmed; three were rated F2.[51] | |
| November 4 | 1988 | Southern U.S.[52] | 18 | F3
|
0 | 
|
Eighteen tornadoes were confirmed; four were rated F3.[53] | |
| November 15 | 1988 | Midwest[54] | 44 | F3
|
7 | 
|
Late season tornado outbreak. Forty-four tornadoes were confirmed; three were rated F3.[55] | |
| November 26 | 1988 | Southern U.S.[56] | 8 | F2
|
0 | 
|
Nine tornadoes were confirmed; two were rated F2.[57] | |
| March 5 | 1989 | Alabama, Georgia, Tennessee[58] | 9 | F3
|
1 | 
|
Nine tornadoes were confirmed; one was rated F3.[59] | |
| May 16 | 1989 | Oklahoma, Texas, New Mexico[60][61] | 20 | F4
|
1 | 
|
Only high risk ever issued for New Mexico.[citation needed] Twenty tornadoes were confirmed; one was rated F4.[62] | |
| May 17 | 1989 | Louisiana, Texas[63] | 19 | F3
|
1 | 
|
Nineteen tornadoes were confirmed; one was rated F3.[64] | |
| May 24 | 1989 | Midwest[65] | 31 | F4
|
0 | 
|
Thirty-one tornadoes were confirmed; two were rated F4.[66] | |
| June 13 | 1989 | Louisiana, Texas[67] | 1 | F1
|
0 | 
|
Only one tornado were confirmed.[68] The high risk was issued in the 1300 UTC outlook and removed from all subsequent outlooks. | |
| November 15 | 1989 | Southern U.S.[69] | 17 | F4
|
21 | 
|
November 1989 tornado outbreak – Seventeen tornadoes were confirmed; one was rated F4.[70] | |
1990–1999 edit
Sixty high risks were issued in the 1990s.
| Storm Prediction Center High Risk Events – 1990–1999[nb 1] | ||||||||
|---|---|---|---|---|---|---|---|---|
| Date | Year | Region | Tornadoes | Max rating | Peak gust | Fatalities | Outlook | Notes |
| February 1 | 1990 | Arkansas, Louisiana, Oklahoma, Texas[71] | 1 | F1
|
0 | 
|
One weak tornado was confirmed.[72] Only the 1200 UTC outlook included a high risk. | |
| March 14 | 1990 | Southern U.S.[73] | 11 | F3
|
1 | 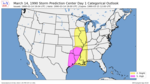
|
Eleven tornadoes were confirmed; one was rated F3.[74] | |
| May 9 | 1990 | Midwest[75] | 4 | F2
|
0 | 
|
Four tornadoes were confirmed; two were rated F2.[76] Only the 1200 UTC outlook included a high risk. | |
| May 15 | 1990 | Arkansas, Illinois, Indiana, Kansas, Kentucky, Missouri, Tennessee, Oklahoma[77] | 17 | F3
|
1 | 
|
Seventeen tornadoes were confirmed; one was rated F3.[78] | |
| May 20 | 1990 | Arkansas, Kansas, Oklahoma[79] | 10 | F2
|
0 | 
|
Ten tornadoes were confirmed; one was rated F2.[80] Only the 1900 UTC outlook included a high risk. | |
| May 29 | 1990 | Kansas, Oklahoma, Texas[81] | 9 | F2
|
0 | 
|
Mainly a damaging wind threat.[82] Nine tornadoes were confirmed; one was rated F2.[83] Only the 1900 UTC outlook included a high risk. | |
| June 1 | 1990 | Great Plains[84] | 21 | F4
|
2 | 
|
Twenty-one tornadoes were confirmed; one was rated F4.[85] | |
| June 2 | 1990 | Ohio Valley[69] | 68 | F4
|
9 | 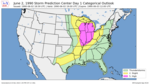
|
June 1990 Lower Ohio Valley tornado outbreak – Sixty-eight tornadoes were confirmed; seven were rated F4.[86] | |
| March 22 | 1991 | Midwest, Southern U.S.[87] | 23 | F3
|
6 | 
|
Twenty-three tornadoes were confirmed; three were rated F3.[87] | |
| March 26 | 1991 | Kansas, Missouri, Oklahoma[88] | 21 | F4
|
0 | 
|
Twenty-one tornadoes were confirmed; one was rated F4.[89] Only the 1900 UTC outlook included a high risk. | |
| March 27 | 1991 | Midwest[90] | 29 | F3
|
2 | 
|
Twenty-nine tornadoes were confirmed; six were rated F3.[91] | |
| March 28 | 1991 | Indiana, Michigan, Ohio[92] | 2 | F0
|
0 | 
|
Two weak tornadoes were confirmed. Only the 0100 UTC outlook had a high risk.[93] | |
| March 29 | 1991 | Alabama, Florida, Georgia, North Carolina, South Carolina, Virginia[94] | 21 | F3
|
0 | 
|
First and only occurrence of four consecutive high risk days. Twenty-one tornadoes were confirmed; one was rated F3.[95] | |
| April 11 | 1991 | Oklahoma, Kansas, Texas[96] | 7 | F3
|
0 | 
|
Severe weather outbreak did not consolidate due to a lack of moisture and instability anticipated to develop.[69] Seven tornadoes were confirmed; one was rated F3.[97] | |
| April 12 | 1991 | Oklahoma, Kansas, Texas[69] | 24 | F3
|
0 | 
|
Twenty-four tornadoes were confirmed; two were rated F3.[98] | |
| April 26 | 1991 | Central U.S.[69] | 55 | F5
|
21 | 
|
Tornado outbreak of April 26, 1991 – Fifty-five tornadoes were confirmed; one was rated F5.[99] | |
| April 28 | 1991 | Eastern Oklahoma and Kansas[69] | 13 | F2
|
0 | 
|
Thunderstorm complex early in the day prevented significant moisture from moving into the region and ultimately limited severe weather activity.[100] Thirteen tornadoes were confirmed; two were rated F2.[101] | |
| April 19 | 1992 | Arkansas, Louisiana, Oklahoma, Texas[102] | 4 | F1
|
0 | 
|
Four weak tornadoes were confirmed; three were rated F1.[103] | |
| June 16 | 1992 | Midwest[104] | 65 | F5
|
1 | 
|
Mid-June 1992 tornado outbreak – Sixty-five tornadoes were confirmed; one was rated F5.[105] | |
| June 17 | 1992 | Great Lakes[106] | 28 | F3
|
0 | 
|
Mid-June 1992 tornado outbreak – Twenty-eight tornadoes were confirmed; one was rated F3.[107] | |
| June 19 | 1992 | Arkansas, Kansas, Louisiana, Oklahoma, Texas[108] | 17 | F1
|
0 | 
|
Seventeen tornadoes were confirmed; three were rated F1.[109] Only the 1900 UTC outlook included a high risk. | |
| July 2 | 1992 | Arkansas, Illinois, Iowa, Kansas, Missouri, Oklahoma, Wisconsin[110] | 16 | F3
|
0 | 
|
Sixteen tornadoes were confirmed; one was rated F3.[111] | |
| September 9 | 1992 | Illinois, Indiana, Kansas, Missouri[112] | 4 | F1
|
0 | 
|
Only high risk ever issued in September. Squall line with damaging winds and some large hail.[113] Four weak tornadoes were confirmed; one was rated F1.[114] | |
| April 19 | 1993 | Arkansas, Illinois, Kentucky, Missouri, Tennessee[115] | 6 | F2
|
0 | 
|
Six tornadoes were confirmed; one was rated F2.[116] | |
| June 3 | 1993 | Arkansas, Illinois, Kansas, Kentucky, Missouri, Oklahoma, Tennessee[117] | 0 | — | 0 | 
|
A high risk was issued for a derecho. No tornadoes were confirmed. Day 1 of 2 for the derecho. | |
| June 4 | 1993 | Kentucky, North Carolina, Tennessee, Virginia, West Virginia[118] | 13 | F1
|
80 mph (130 km/h) | 0 | 
|
Major derecho event.[119] The Lynchburg, Virginia area was hit the hardest. The city had a wind gust to 80 mph, with significant damage reported. Power was cut to 95% of the city.[120] Thirteen tornadoes were confirmed; six were rated F1.[121] Only the 1900 UTC outlook had a high risk. |
| June 7 | 1993 | Upper Midwest[122] | 40 | F4
|
0 | 
|
Forty tornadoes were confirmed; two were rated F4.[123] | |
| June 8 | 1993 | Great Plains, Upper Midwest[124] | 58 | F3
|
0 | 
|
Fifty-eight tornadoes were confirmed; one was rated F3.[125] | |
| June 23 | 1993 | Kansas, Nebraska[126] | 3 | F2
|
0 | 
|
Only three tornadoes were confirmed; one was rated F2.[127] | |
| July 3 | 1993 | Iowa, Minnesota, Nebraska, North Dakota, South Dakota[128] | 13 | F1
|
0 | 
|
Thirteen weak tornadoes were confirmed; four were rated F1.[129] | |
| March 27 | 1994 | Southern U.S.[130] | 29 | F4
|
40 | 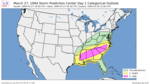
|
1994 Palm Sunday tornado outbreak – Twenty-nine tornadoes were confirmed; two were rated F4.[131] Only the 1900 UTC outlook included a high risk. | |
| April 25 | 1994 | Central U.S.[132] | 28 | F4
|
3 | 
|
Tornado outbreak of April 25–27, 1994 – Twenty-eight tornadoes were confirmed; one was rated F4.[133] In addition, there were numerous large hail reports, with hail reaching 4.50".[134] | |
| June 14 | 1994 | Michigan, Minnesota, Wisconsin[135] | 3 | F1
|
0 | 
|
Three weak tornadoes were confirmed; one was rated F1.[136] Only the 1200 UTC outlook included a high risk. | |
| August 27 | 1994 | Iowa, Michigan, Minnesota, Nebraska, South Dakota, Wisconsin[137] | 12 | F3
|
4 | 
|
Only high risk ever issued in August.[citation needed] Twelve tornadoes were confirmed; two were rated F3.[138] The same system also produced an F4 in Turtle Mountain, Manitoba in Canada. | |
| November 27 | 1994 | Southern U.S.[139] | 18 | F3
|
6 | 
|
Eighteen tornadoes were confirmed; four were rated F3.[140] | |
| April 17 | 1995 | Oklahoma, Texas | 21 | F2
|
0 | 
|
Primarily a derecho event. Twenty-one tornadoes were confirmed; two were rated F2.[141] | |
| May 7 | 1995 | Kansas, Oklahoma, Texas | 33 | F3
|
6 | 
|
Tornado outbreak sequence of May 6–27, 1995 – Day one of a 5-day event. Thirty-three tornadoes were confirmed; two were rated F3.[142] | |
| May 12 | 1995 | Arkansas, Iowa, Kansas, Missouri, Nebraska, Oklahoma | 14 | F2
|
0 | 
|
Tornado outbreak sequence of May 6–27, 1995. Twelve tornadoes were confirmed; two were rated F2.[143] | |
| May 13 | 1995 | Ohio Valley | 26 | F4
|
3 | 
|
Tornado outbreak sequence of May 6–27, 1995 – Included a major derecho.[citation needed] Twenty-six tornadoes were confirmed; two were rated F4.[144] | |
| May 17 | 1995 | Oklahoma | 9 | F3
|
0 | 
|
Tornado outbreak sequence of May 6–27, 1995. Nine tornadoes were confirmed; one was rated F3.[145] | |
| March 18 | 1996 | Alabama, Florida, Georgia, Mississippi, South Carolina[146] | 21 | F3
|
0 | 
|
Twenty-one tornadoes were confirmed; one was rated F3.[147] | |
| April 19 | 1996 | Illinois, Indiana, Missouri, Kentucky[148][149] | 60 | F3
|
104 mph (167 km/h) | 1 | 
|
Tornado outbreak sequence of April 1996. A total of 60 tornadoes were confirmed; six were rated F3.[150] |
| March 2 | 1997 | Alabama, Louisiana, Mississippi[151] | 2 | F0
|
0 | 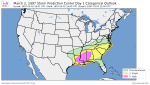
|
Two weak and short lived tornadoes were confirmed.[152] Only the 1900 UTC outlook included a high risk. | |
| May 2 | 1997 | Alabama, Mississippi | 8 | F3
|
92 mph (148 km/h) | 1 | 
|
Also a derecho event.[citation needed] Eight tornadoes were confirmed; two were rated F3.[153] |
| July 1 | 1997 | Upper Mississippi Valley | 20 | F3
|
109 mph (175 km/h) | 0 | 
|
Moderate tornado outbreak reorganized into a progressive derecho.[citation needed] Twenty tornadoes were confirmed; one was rated F3.[154] |
| October 25 | 1997 | Arkansas, Louisiana, Mississippi, Oklahoma, Texas[155] | 9 | F1
|
0 | 
|
Nine tornadoes were confirmed; four were rated F1.[156] Only the 1900 UTC outlook included a high risk. | |
| February 10 | 1998 | Alabama, Louisiana, Mississippi, Texas | 11 | F1
|
135 mph (217 km/h) | 0 | 
|
Rare winter serial derecho.[citation needed] Eleven tornadoes were confirmed; five were rated F1.[157] |
| April 8 | 1998 | Alabama[158] | 14 | F5
|
92 mph (148 km/h) | 35 | 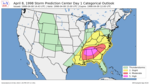
|
Tornado outbreak of April 6–9, 1998 – F5 damage in suburban Birmingham. Fourteen tornadoes were confirmed; one was rated F5.[159] |
| April 15 | 1998 | Middle Mississippi Valley | 21 | F4
|
75 mph (121 km/h) | 2 | 
|
Tornado outbreak of April 15–16, 1998 – Day 1 of outbreak. Twenty-one tornadoes were confirmed; one was rated F4.[citation needed] |
| April 16 | 1998 | Tennessee | 41 | F5
|
98 mph (158 km/h) | 10 | 
|
Tornado outbreak of April 15–16, 1998 – Day 2 of outbreak. Forty-one tornadoes were confirmed; one was rated F5.[160] |
| May 9 | 1998 | Arkansas, Mississippi, Tennessee[161] | 5 | F1
|
0 | 
|
Five weak tornadoes were confirmed; one was rated F1.[162] Only the 1930 UTC outlook included a high risk. | |
| May 31 | 1998 | Northeastern U.S.[163][164][165][166] | 42 | F3
|
128 mph (206 km/h) | 1 | 
|
Late-May 1998 tornado outbreak and derecho – Only high risk ever issued in the Northeast.[citation needed] Forty-two tornadoes were confirmed; six were rated F3.[167] |
| June 14 | 1998 | Ohio Valley | 22 | F1
|
92 mph (148 km/h) | 0 | 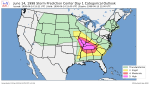
|
Followed by a progressive derecho.[citation needed] Twenty-two tornadoes were confirmed; six were rated F1.[168] |
| January 21 | 1999 | Arkansas[169][170] | 82 | F4
|
8 | 
|
Tornado outbreak of January 21–23, 1999 – Second earliest date that a high risk was issued.[citation needed] Eighty-two tornadoes were confirmed; one was rated F4.[171] | |
| March 8 | 1999 | Arkansas, Louisiana, Texas | 10 | F2
|
0 | 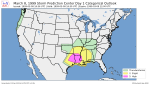
|
Few tornadoes with some scattered hail and wind[citation needed] | |
| April 8 | 1999 | Iowa, Missouri, Illinois | 47 | F4
|
2 | 
|
Tornado outbreak of April 8–9, 1999 – Fifty-four tornadoes were confirmed; three were rated F4. | |
| May 3 | 1999 | Oklahoma, Kansas[172] | 73 | F5
|
46 | 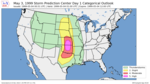
|
1999 Oklahoma tornado outbreak – Highest winds ever recorded in a tornado, 301 mph (484 km/h);[173] seventy-three tornadoes were confirmed, including three F4s and one F5. | |
| May 4 | 1999 | Oklahoma, Arkansas, Texas[172] | 43 | F3
|
1 | 
|
1999 Oklahoma tornado outbreak – Day 2 of outbreak | |
| May 5 | 1999 | Southern U.S. | 15 | F4
|
3 | 
|
1999 Oklahoma tornado outbreak – Second longest streak of consecutive high risk days. Major derecho event.[citation needed] | |
| June 5 | 1999 | South Dakota, Nebraska[174] | 21 | F1
|
0 | 
|
Event failed to consolidate with only isolated tornadoes and scattered severe wind reported. A shortwave ridge maintained a capping inversion.[175] | |
2000–2009 edit
There were no high risk days in 2000.
| Storm Prediction Center High Risk Events – 2000–2009[nb 1][nb 2] | ||||||||
|---|---|---|---|---|---|---|---|---|
| Date | Year | Region | Tornadoes | Max rating | Peak gust | Fatalities | Outlook | Notes |
| April 6 | 2001 | Texas Panhandle, Western Oklahoma, much of Kansas, and extreme southern Nebraska[176] | 6 | F2
|
124 mph (200 km/h)† | 1 | 
|
A serial derecho formed, producing widespread wind damage. 162 damaging wind gusts were reported, including 12 hurricane force.[177] One person was killed by lightning in Ohio. Six tornadoes were also confirmed; two were rated F2.[178] |
| April 11 | 2001 | Eastern Iowa, Southern Wisconsin, and northwest Illinois[179] | 40 | F3
|
92 mph (148 km/h) | 3 | 
|
Tornado outbreak of April 10–11, 2001 – Three people were killed by tornadoes. The event also featured the costly Tri-State hailstorm on the prior day. Forty tornadoes were confirmed; one was rated F3.[180] |
| June 11 | 2001 | Southern Minnesota, Northeastern Iowa, and West-Central Wisconsin[181] | 29 | F2
|
120 mph (190 km/h) | 2 | 
|
A progressive derecho produced widespread wind damage, including a measured thunderstorm wind gust of 120 miles per hour (193 km/h) near Atwater, Minnesota. 194 damaging wind gusts were reported, including 5 hurricane force.[182] Twenty-nine tornadoes were also confirmed; one was rated F2. However, some of the tornadoes were associated with landfalling Tropical Storm Allison, not the system that triggered the high risk.[183] |
| October 13 | 2001 | U.S. Gulf Coast[184] | 32 | F3
|
112 mph (180 km/h)† | 1 | 
|
One person was killed by straight-line winds in Illinois. Thirty-two tornadoes were confirmed; one was rated F3.[185] |
| October 24 | 2001 | Midwest[186] | 25 | F3
|
104 mph (167 km/h)† | 3 | 
|
A significant tornado event that included a major serial derecho. One person was killed by straight-line winds in Michigan while another person was also killed in Tennessee. Twenty-five tornadoes were confirmed; two were rated F3.[187] Over 446 damaging wind gusts were reported across 18 states, including 2 hurricane force.[188] |
| April 16 | 2002 | Upper Midwest[189] | 14 | F3
|
85 mph (137 km/h)† | 1 | 
|
Widespread hail damage occurred and one person was killed by straight-line winds in Kansas. Fourteen tornadoes were confirmed; one was rated F3. The high risk was removed at 2000 UTC outlook update, although the initiation of the most intense severe weather occurred after that time.[190] |
| July 31 | 2002 | Minnesota, Wisconsin[191] | 3 | F0
|
75 mph (121 km/h)† | 0 | 
|
No fatalities took place.[192] Three weak tornadoes were confirmed.[193] Only the 0600 UTC outlook included a high risk. |
| November 10 | 2002 | Midwest and Southern U.S.[194] | 61 | F4
|
100 mph (160 km/h)† | 34 | 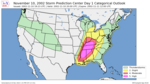
|
Tornado outbreak of November 9–11, 2002 – No non-tornadic death took place.[195] Sixty-one tornadoes were confirmed; one was rated F4 (in Northwest Ohio, outside the high risk area – the strongest tornadoes within the high risk were rated F3). Thirty-four people were killed by the outbreak. Part of a three-day outbreak that resulted in 76 tornadoes and 36 deaths.[196] |
| December 23 | 2002 | Texas, Louisiana[197] | 15 | F1
|
70 mph (110 km/h)† | 0 | 
|
One of only two high risk ever issued in December[citation needed] and second latest in the year (first was December 24, 1982). No fatalities took place.[198] Fifteen tornadoes were confirmed; three were rated F1.[199] |
| April 6 | 2003 | Texas, Louisiana, Mississippi[200] | 18 | F3
|
83 mph (134 km/h) | 0 | 
|
Eighteen tornadoes were confirmed; one was rated F3.[201] |
| May 4 | 2003 | Central U.S.[202] | 79 | F4
|
89 mph (143 km/h)† | 38 | 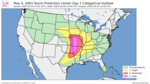
|
May 2003 tornado outbreak sequence – Seventy-nine tornadoes were confirmed; four were rated F4.[203] |
| May 5 | 2003 | Southern U.S.[204] | 28 | F3
|
104 mph (167 km/h)† | 0 | 
|
May 2003 tornado outbreak sequence – Twenty-eight tornadoes were confirmed; one was rated F3.[205] |
| May 8 | 2003 | Kansas, Oklahoma[206] | 45 | F4
|
104 mph (167 km/h) | 0 | 
|
May 2003 tornado outbreak sequence – Forty-five tornadoes were confirmed; one was rated F4.[207] |
| May 10 | 2003 | Central U.S.[208] | 49 | F3
|
92 mph (148 km/h)† | 0 | 
|
May 2003 tornado outbreak sequence – Forty-nine tornadoes were confirmed; three were rated F3.[209] Also included 35% tornado probability area, above the 25% minimum threshold for a high risk. |
| May 15 | 2003 | Texas, Oklahoma[210] | 47 | F2
|
92 mph (148 km/h)† | 0 | 
|
Forty-seven tornadoes were confirmed; seven were rated F2.[211] |
| March 4 | 2004 | Texas, Oklahoma[212] | 25 | F2
|
91 mph (146 km/h) | 0 | 
|
Reorganized into a large serial derecho[citation needed] Twenty-five tornadoes were confirmed; two were rated F2.[213] |
| May 22 | 2004 | Nebraska, Iowa[214] | 68 | F4
|
106 mph (171 km/h) | 1 | 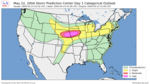
|
May 2004 tornado outbreak sequence/2004 Hallam tornado – Sixty-eight tornadoes were confirmed; one was rated F4. The F4 tornado was the largest tornado on record at the time with a peak width of 2.5 miles (4.0 km) as it struck Hallam, Nebraska.[215] Second of only three known times a high risk was not issued until 0100 UTC (the other two being March 28, 1991, and April 30, 2010). |
| May 24 | 2004 | Nebraska, Iowa[216] | 54 | F2
|
104 mph (167 km/h)† | 1 | 
|
May 2004 tornado outbreak sequence – Also a major derecho event.[citation needed] Included a 45% sig risk for damaging winds, meeting High Risk criteria (for the time). Fifty-four tornadoes were confirmed; two were rated F2.[217] 128 damaging wind gusts were reported, including 3 hurricane force.[218] |
| May 29 | 2004 | Central U.S.[219] | 80 | F4
|
90 mph (140 km/h) | 3 | 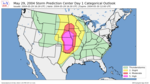
|
May 2004 tornado outbreak sequence – Eighty tornadoes were confirmed; one was rated F4.[220] |
| May 30 | 2004 | Central U.S.[221] | 86 | F3
|
120 mph (190 km/h)† | 2 | 
|
May 2004 tornado outbreak sequence – Eighty-six tornadoes were confirmed; two were rated F3.[222] Included 35% tornado risk area above minimum threshold of 25%. |
| April 11 | 2005 | Louisiana, Mississippi[223] | 3 | F0
|
86 mph (138 km/h) | 0 | 
|
Three weak tornadoes were confirmed.[224] |
| June 4 | 2005 | Central U.S.[225] | 44 | F2
|
81 mph (130 km/h)† | 0 | 
|
Forty-four tornadoes were confirmed; one was rated F2.[226] |
| November 15 | 2005 | Midwest and Southern U.S.[227] | 49 | F4
|
98 mph (158 km/h)† | 1 | 
|
Mid-November 2005 tornado outbreak – Forty-nine tornadoes were confirmed; one was rated F4. This was the only violent tornado to be recorded in 2005.[228] |
| March 12 | 2006 | Midwest[229] | 59 | F4
|
107 mph (172 km/h)† | 8 | 
|
Tornado outbreak sequence of March 9–13, 2006 – Fifty-nine tornadoes were confirmed; one was rated F4.[230] One supercell storm tracked nearly 800 miles from Oklahoma to Michigan, producing many tornadoes along its path. |
| April 6 | 2006 | Nebraska, Kansas[231] | 12 | F2
|
82 mph (132 km/h) | 0 | 
|
Tornado outbreak of April 6–8, 2006 – Twelve tornadoes were confirmed; one was rated F2.[232] |
| April 7 | 2006 | Southern U.S.[233] | 47 | F3
|
92 mph (148 km/h)† | 10 | 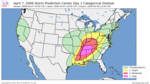
|
Tornado outbreak of April 6–8, 2006 – Only known high risk to include a 60% tornado contour, the highest level issued by the SPC.[234] It was also the first of only two known occurrences (the other being April 14, 2012) in which a Day 2 high risk outlook was issued, and is the first/only instance to date where a high risk was issued for both Day 1 (April 6) and Day 2. Forty-seven tornadoes were confirmed; two were rated F3.[235] |
| March 1 | 2007 | Southern U.S.[236] | 36 | EF4
|
81 mph (130 km/h)† | 20 | 
|
Tornado outbreak of February 28 – March 2, 2007 – Thirty-six tornadoes were confirmed; two were rated EF4.[237] |
| April 13 | 2007 | Texas[238] | 7 | EF1
|
81 mph (130 km/h)† | 1 | 
|
April 2007 nor'easter – Only seven tornadoes were confirmed; one was rated EF1.[239] |
| April 24 | 2007 | Texas[240] | 23 | EF3
|
90 mph (140 km/h)† | 7 | 
|
Tornado outbreak sequence of April 20–27, 2007 – Twenty-three tornadoes were confirmed; one was rated EF3, although this all occurred outside the high risk area, which saw virtually no activity. The supercell that produced the EF3 tornado also produced an F4 tornado in Mexico before crossing the international border.[241] |
| May 5 | 2007 | Nebraska, Kansas[242] | 90 | EF3
|
100 mph (160 km/h) | 1 | 
|
Tornado outbreak of May 4–6, 2007 – Ninety tornadoes were confirmed; two were rated EF3.[243] |
| June 7 | 2007 | Upper Midwest[244] | 12 | EF3
|
81 mph (130 km/h)† | 0 | 
|
Reorganized into a moderate wind event[citation needed] Included a 60% sig risk for damaging winds for the 1200z outlook before being switched back to a 30% sig tornado risk in the 1300z outlook. Twelve tornadoes were confirmed; one was rated EF3.[245] 135 damaging gusts were reported. However, the 3 hurricane force wind gusts occurred in Missouri, outside the High Risk.[246] |
| February 5 | 2008 | Middle Mississippi Valley[247] | 63 | EF4
|
100 mph (160 km/h)† | 48 | 
|
2008 Super Tuesday tornado outbreak – Sixty-three tornadoes were confirmed; three were rated EF4.[248] One EF4 tornado in Arkansas tracked over 120 miles. One of only two high risk issued in January or February since January 21, 1999, continuing to present, with the other being January 22, 2017. |
| March 15 | 2008 | Georgia, South Carolina[249] | 44 | EF3
|
100 mph (160 km/h)† | 2 | 
|
2008 Atlanta tornado outbreak – Forty-four tornadoes were confirmed; three were rated EF3.[250] |
| May 22 | 2008 | Kansas[251] | 28 | EF3
|
100 mph (160 km/h)† | 1 | 
|
Tornado outbreak of May 22–27, 2008 – Twenty-eight tornadoes were confirmed; one was rated EF3.[252] |
| May 29 | 2008 | Nebraska, Iowa, South Dakota[253] | 37 | EF3
|
85 mph (137 km/h)† | 0 | 
|
List of United States tornadoes in May 2008#May 29 event – Thirty-seven tornadoes were confirmed; two were rated EF3.[254] |
| June 5 | 2008 | Midwest[255] | 40 | EF2
|
100 mph (160 km/h)† | 0 | 
|
Tornado outbreak sequence of June 3–11, 2008 – Also including a 60% significant severe wind probability which meets high risk standards. Forty tornadoes were confirmed; three were rated EF2.[256] 261 damaging wind gusts were reported including 10 hurricane-force which were up to 100 mph, though many occurred south of the high risk.[257] |
| April 10 | 2009 | Alabama, Georgia, Tennessee[258] | 62 | EF4
|
96 mph (154 km/h)† | 2 | 
|
Tornado outbreak of April 9–11, 2009 – Sixty-two tornadoes were confirmed; one was rated EF4.[259] |
| April 26 | 2009 | Oklahoma, Kansas, Texas[260] | 11 | EF2
|
81 mph (130 km/h)† | 0 | 
|
Eleven tornadoes were confirmed; one was rated EF2.[261] Despite the maintenance of the high risk through the day, the outbreak busted as a whole. |
| † – Value is estimated | ||||||||
2010–2019 edit
There were no high risk days in 2015, 2016, or 2018.
| Storm Prediction Center High Risk Events – 2010–2019[nb 1] | ||||||||
|---|---|---|---|---|---|---|---|---|
| Date | Year | Region | Tornadoes | Max rating | Peak gust | Fatalities | Outlook | Notes |
| April 24 | 2010 | Southern U.S.[262] | 39 | EF4
|
120 mph (190 km/h)† | 10[263] | 
|
Tornado outbreak of April 22–25, 2010 – A high risk was issued for a 30% probability of significant tornadoes. There were 39 tornadoes confirmed; two were rated EF4. One of the EF4 tornado was the second (then-first) widest in Mississippi state history, and the fourth-longest tracked in the state. The high risk was discontinued at 0100Z. |
| April 30 | 2010 | Arkansas[264] | 27 | EF3
|
75 mph (121 km/h)† | 1[265] | 
|
Tornado outbreak of April 30 – May 2, 2010 – A high risk was issued on the first day of the aforementioned outbreak for a 30% probability of significant tornadoes. For only the third known time a high risk was not issued until 0100 UTC (the other two occurrences were March 28, 1991 and May 22, 2004) and was only a slight risk for most of the day. This is the only day in which the area to eventually be in a high risk was not even in a moderate risk until 2000Z. There were 28 tornadoes confirmed; two were rated EF3. |
| May 1 | 2010 | Middle Mississippi Valley[266] | 30 | EF3
|
83 mph (134 km/h)† | 4 | 
|
Tornado outbreak of April 30 – May 2, 2010 – A high risk was issued on the second day of the aforementioned outbreak for a 30% probability of significant tornadoes. Only 11 weak tornadoes were confirmed during the day, but several strong tornadoes, one of which was rated EF3, occurred overnight. A major flood disaster also occurred from the same storm. |
| May 10 | 2010 | Oklahoma, Kansas[267] | 70 | EF4
|
100 mph (160 km/h)† | 3 | 
|
Tornado outbreak of May 10–13, 2010 – A high risk was issued on the first day of the aforementioned outbreak for a 30% probability of significant tornadoes. 70 tornadoes were confirmed; two were rated EF4, both of which occurred in the southern suburbs of the Oklahoma City metropolitan area and were responsible for the three fatalities during the outbreak. |
| May 19 | 2010 | Oklahoma[268] | 13 | EF1
|
70 mph (110 km/h)† | 0 | 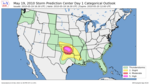
|
Tornadoes of 2010#May 18–21 – A high risk was issued on the second day of the aforementioned outbreak for a 30% probability of significant tornadoes. Only thirteen weak tornadoes, seven of which were rated EF1, were confirmed in the area, but significant flooding occurred from the same storm system. The High Risk was discontinued at 01Z. |
| October 26 | 2010 | Ohio, Indiana, Illinois, Michigan[269] | 43 | EF2
|
85 mph (137 km/h)† | 0 | 
|
October 2010 North American storm complex – This was a major derecho event.[citation needed] The high risk was based on 60% significant severe wind probability, with a tornado probability of 15% falling short of high risk standards. There were 43 tornadoes confirmed; five were rated EF2. There were also 339 damaging wind reports including 7 hurricane-force gusts up to 85 mph (137 km/h).[270] The high risk was discontinued at 2000Z as the main activity was in the morning and early afternoon. |
| April 16 | 2011 | North Carolina, Virginia[271] | 53 | EF3
|
81 mph (130 km/h)† | 26 | 
|
Tornado outbreak of April 14–16, 2011 – A high risk was issued on the third day of the aforementioned outbreak for a 30% probability of significant tornadoes. A total of 58 tornadoes were confirmed; six were rated EF3, two of which had path lengths of over 50 miles (80 km) with the first striking Raleigh, North Carolina (albeit at EF1 strength). The high risk was discontinued at 0100Z as the storms had mostly moved off the East Coast. |
| April 26 | 2011 | South-Central U.S.[272] | 55 | EF3
|
110 mph (180 km/h)† | 0 | 
|
2011 Super Outbreak – A high risk was issued on the second day of the record-setting aforementioned outbreak for a 30% probability of significant tornadoes. In the 1630z outlook, the wind risk was also upgraded to 60%, which meets high risk criteria.[273] There were 55 tornado touch downs during the day; one was rated EF3. 390 damaging wind gusts were also reported, including 5 hurricane gusts. Despite the abundance of tornadoes and wind reports, most of the severe activity happened either along and south of the southern part of the high risk area or well to the east in the slight risk area over Alabama. |
| April 27 | 2011 | Southern U.S.[274] | 215 | EF5
|
100 mph (160 km/h)† | 316 | 
|
2011 Super Outbreak – This was day 3 of the record-setting aforementioned outbreak; this day alone set the record for most tornadoes in a 24-hour period. It was also the deadliest high-risk day on record as well as the deadliest single day outbreak in the United States since the Tri-State tornado outbreak on March 18, 1925. The outlook included a 45% significant tornado area, which is above the minimum threshold for a high risk. It also produced the first known watch (PDS tornado watch 235) with a >95% probability for all severe and significant severe hazards.[275] The tornadoes came in three rounds starting with two damaging morning squall lines followed by an outbreak of large tornadic supercells. The strongest tornadoes occurred in the high risk area while dozens of other tornadoes were confirmed throughout the other risk areas. Three of the tornadoes tracked over 100 miles (160 km), with one of them becoming the deadliest tornado ever recorded in Alabama. Several areas that had experienced tornadoes either from that morning or from other outbreaks earlier that year were struck again as well. There were 215 tornado touch downs; four were rated EF5. An additional F0 tornado was confirmed in Canada. |
| May 24 | 2011 | Oklahoma, Kansas, Texas[276] | 47 | EF5
|
92 mph (148 km/h)†* | 14 | 
|
Tornado outbreak sequence of May 21–26, 2011 – This was day 4 of the aforementioned outbreak sequence and included a 45% significant tornado area, above minimum high risk threshold. There were 47 tornado touch downs; one was rated EF5. The two EF4 tornadoes that were confirmed that day may have also reached EF5 intensity. The high risk was discontinued at 0100Z. |
| May 25 | 2011 | Midwest[277] | 94 | EF4
|
100 mph (160 km/h)† | 4 | 
|
Tornado outbreak sequence of May 21–26, 2011 – A high risk was issued on the fifth day of the aforementioned outbreak sequence for a 30% probability of significant tornadoes. A total of 94 tornadoes were confirmed; one was rated EF4; three of the tornadoes were in California, well to the west of the main risk area, although one of them was rated EF2 (the other two were rated EF1). The high risk was discontinued at 0100Z. |
| March 2 | 2012 | Midwest and Southern U.S.[278] | 64 | EF4
|
86 mph (138 km/h)† | 41 | 
|
Tornado outbreak of March 2–3, 2012 – A high risk was issued on the first day of the aforementioned outbreak for a 30% probability of significant tornadoes. A total of 64 tornadoes were confirmed; two were rated EF4, both of which were produced by the same supercell, which also produced an EF3 tornado. Another EF3 tornado tracked for over 80 miles (130 km) through eastern Kentucky and southwestern West Virginia. The high risk was discontinued at 0100Z. |
| April 14 | 2012 | Central U.S.[279] | 83 | EF4
|
97 mph (156 km/h) | 6 | 
|
Tornado outbreak of April 13–16, 2012 – This was day 2 of aforementioned outbreak; it was only the second high risk to be issued on Day 2 (the day before the event; first Day 2 high risk was for April 7, 2006) and the first/only to date ever issued on the initial (0600Z) Day 2 outlook.[279] It included 45% tornado probability above minimum threshold of 30%. A total of 83 tornadoes were confirmed; one was rated EF4. The high risk largely busted in most of Oklahoma (except far northern and western) as the brunt of outbreak was focused in Kansas. The high risk was maintained for the entire day in the regions where most of the tornadoes occurred (the southern end was trimmed at 01Z). |
| June 12 | 2013 | Midwest[280] | 19 | EF3
|
95 mph (153 km/h)† | 0 | 
|
June 12–13, 2013 derecho series – The high risk was driven by 60% significant severe wind probability as the maximum tornado probability was a hatched 15% area, just short of the high risk level. A total of 19 tornadoes were confirmed; one was rated EF3. 278 damaging wind gusts were reported, including 4 hurricane force gusts, though most occurred over Ohio and were outside the high risk.[281] The high risk was discontinued at 01Z. |
| November 17 | 2013 | Midwest[282] | 77 | EF4
|
100 mph (160 km/h)† | 11[283] | 
|
Tornado outbreak of November 17, 2013 – The high risk was initially issued for a 30% probability of significant tornadoes. This was an unusually far north tornado outbreak and one of only five high risk days during the month of November in recorded history.[284] It was the third latest date in the year a high risk has been issued since 2000 (the second latest was December 23, 2002, in the Deep South), and latest date a high risk has been issued in the Midwest, surpassing previous latest of November 15, 2005. It also included a high-risk level (60% significant severe) wind probability in the 2000Z outlook. In all, 77 tornadoes were confirmed; two were rated EF4. 579 wind reports were also recorded, including 19 hurricane-force.[285] The high risk was discontinued at 0100Z as the storms had moved east of the areas that had been in that risk area. |
| April 27 | 2014 | Southwestern Arkansas[286] | 18 | EF4
|
90 mph (140 km/h)† | 19 | 
|
Tornado outbreak of April 27–30, 2014 – This was a first day of the aforementioned outbreak. A small high-risk area was issued at the 2000Z outlook that included the cities of Little Rock, Camden, and Danville for a 30% probability of significant tornadoes. An EF4 tornado were confirmed in the area before the high risk was discontinued in a special outlook update at 0230Z. The outlook period as a whole produced 18 tornadoes.[287] |
| April 28 | 2014 | Alabama, Mississippi[288] | 57 | EF4
|
70 mph (110 km/h)† | 16 | 
|
Tornado outbreak of April 27–30, 2014 – This was the second day of the aforementioned outbreak. A high risk was issued at the 2000Z outlook for a 30% probability of significant tornadoes. Numerous long-tracked and/or strong to violent tornadoes occurred across Mississippi, Alabama, and Tennessee. It was the largest tornado outbreak in central Alabama since April 27, 2011. A total of 57 tornadoes were confirmed during the outlook period; one was rated EF4. The high risk was discontinued at 0100Z.[289] |
| June 3 | 2014 | Nebraska, Iowa, Missouri[290] | 9 | EF3
|
100 mph (160 km/h)† | 0 | 
|
Tornadoes of 2014#June 3–4 – The high risk was issued at 2000Z for 60% wind probability and potential derecho; tornado probability was 10%, well short of high-risk level. Extreme hail/wind and some tornadoes were reported, although most of the activity remained along or south of the southern part of the high risk. Nine tornadoes were confirmed during the outlook period; one tornado was rated EF3. The high risk was discontinued at 0100Z. |
| January 22 | 2017 | Georgia, Florida[291] | 17 | EF3
|
75 mph (121 km/h) | 7 | 
|
Tornado outbreak of January 21–23, 2017 – This was the second day of the aforementioned outbreak. The high risk was issued for a 30% probability of significant tornadoes, primarily in northern Florida and southern Georgia.[292] This was also the first high risk issued under the five-category system (which began in October 2014). There were 17 confirmed tornado touch downs during the outlook period; one tornado, which was rated EF3, traveled over 70 miles (110 km) and was over a 1 mile (1.6 km) wide. There were six fatalities from tornadoes along with one non-tornadic death. The high risk was discontinued at 0100Z. |
| April 2 | 2017 | Texas, Louisiana[293] | 30 | EF2
|
70 mph (110 km/h) | 2 | 
|
Tornadoes of 2017#April 2–3 – This was the first day of the aforementioned outbreak. The high risk was issued at 1630Z for a 30% probability of significant tornadoes. Although most of the tornado that touched down were relatively weak and short-lived, seven of them were more than 1⁄2 mi (0.80 km) wide, including one that reached a peak width of just over 1+1⁄4 mi (2.0 km) wide, and multiple tornado emergencies were issued. 30 tornadoes were confirmed during the outlook period; six of them were rated EF2. The high risk was discontinued at 0100Z.[294] |
| April 5 | 2017 | Georgia, South Carolina[295] | 26 | EF2
|
80 mph (130 km/h) | 0 | 
|
Tornadoes of 2017#April 4–6 – This was the second day of the aforementioned outbreak. The high risk was issued for a 30% probability of significant tornadoes. A total of 26 tornadoes were confirmed during the outlook period, four of which were rated EF2, although the tornadoes were mostly scattered throughout the risk areas rather than being concentrated within the high-risk area. One EF2 tornado in Georgia did prompt the issuance of a tornado emergency. The high risk was discontinued at around 0100Z.[296] |
| May 18 | 2017 | Kansas, Oklahoma[297] | 58 | EF2
|
104 mph (167 km/h) | 0 | 
|
Tornado outbreak sequence of May 15–20, 2017 – This was day 4 of the outbreak sequence. The high risk was issued for a 30% probability of significant tornadoes. The outbreak was widely anticipated with a Moderate risk originally being issued on Day 2. A total of 58 tornadoes were confirmed during the outlook period, three of which were rated EF2. However, only weak, scattered tornadoes were reported in the high-risk area, which saw a large plume of heavy convective rainfall when the most favorable tornado parameters arrived; the strongest tornadoes occurred to the east of that area. The high risk was discontinued at 01Z.[298] |
| May 20 | 2019 | Oklahoma, Texas[299] | 51 | EF3
|
94 mph (151 km/h) | 0 | 
|
Tornado outbreak sequence of May 2019 – This was day 4 of the outbreak sequence. The high risk was initially issued for a 30% probability of significant tornadoes; this risk area was subsequently expanded and upgraded at 1626Z to a 45% probability of significant tornadoes, exceeding the minimum high-risk criteria. This high risk produced the second known tornado watch with a >95% chance of all hazards (PDS Tornado Watch 199).[300] The event did not quite live up to the high parameters that were in place for the day due to the cap being stronger than anticipated over the warm sector, which was displaced from the upper-level jet. However, 50 tornadoes were confirmed during the outlook period, one of which was rated EF3 (one of the tornadoes was well outside of the risk area in Arizona). The high risk lasted for the entire outlook period, although it was only maintained in a very small region at 01Z, where parameters remained the most favorable.[301] |
| † – Value is estimated * – Peak wind gust of 151 mph (243 km/h) measured during the EF5 El Reno tornado | ||||||||
2020–present edit
There were no high risk days in 2020 or 2022.
| Storm Prediction Center High Risk Events – 2020–2024[nb 1] | ||||||||
|---|---|---|---|---|---|---|---|---|
| Date | Year | Region | Tornadoes[nb 3] | Max rating | Peak gust | Fatalities | Outlook | Notes |
| March 17 | 2021 | Mississippi, Alabama, Louisiana, Arkansas[302] | 40 | EF2
|
64 mph (103 km/h) | 0 | 
|
Tornado outbreak of March 16–18, 2021 – This was day 2 of the outbreak. The high risk was initially issued for a 30% hatched area for tornadoes; this was upgraded to a 45% hatched area for tornadoes at 1606Z. A total of 40 tornadoes were confirmed during the outlook period, four of which were rated EF2, although little tornado activity occurred within the 45% risk area.[303] |
| March 25 | 2021 | Mississippi, Alabama, Tennessee[304] | 20 | EF4
|
105 mph (169 km/h) | 7 | 
|
Tornado outbreak sequence of March 24–28, 2021 – This was day 2 of the outbreak sequence. The high risk was issued for a 30% hatched area for tornadoes. A PDS tornado watch was issued, with a >95% chance for both tornadoes and strong tornadoes, and high probabilities for most other categories. Multiple tornado emergencies were issued for at least three different tornadoes. The high risk was discontinued at 01z and downgraded to an Enhanced risk as the storm system began weakening and the supercells began dying off, although the strongest tornado, which was rated EF4, took place a few hours after that time. A total of 20 tornadoes were confirmed during the outlook period.[305] |
| March 31 | 2023 | Upper and Lower Mississippi Valleys[306] | 136 | EF4
|
83 mph (134 km/h) | 23 | 
|
Tornado outbreak of March 31 – April 1, 2023 – Two high risk zones were issued at 1630Z with 30% hatched areas for tornadoes. The northern of the two zones was discontinued at 01Z. Multiple tornado emergencies and mass causality events were issued during the outbreak. A total of 136 tornadoes were confirmed the outlook period, one of which was rated EF4. This was the first instance of two separate high-risk areas since the initial 06Z outlook on April 14, 2012. This was also the deadliest high-risk day since March 2, 2012.[citation needed] |
See also edit
Notes edit
- ^ a b c d e All values include events that took place outside the high-risk area(s). Tornado and fatality totals only include incidents that occurred on the respective high risk days. Fatality totals only include direct tornadic deaths.
- ^ Starting on February 1, 2007, the Fujita Scale was replaced with the Enhanced Fujita Scale for rating tornadoes.
- ^ This number reflects the number of tornadoes during the outlook period between 12Z on the day of the high risk to 12Z the next day.
References edit
- ^ Chris Hayes Novy (March 25, 2010). "SPC and its Products: Convective Outlooks". Storm Prediction Center. National Oceanic and Atmospheric Administration. Retrieved June 15, 2013.
- ^ "SPC Products". www.spc.noaa.gov.
- ^ "Notable Weather Events of 2022". National Weather Service. Retrieved 3 January 2023.
- ^ Weiss, Steven; Wilson, Larry; Edwards, Roger (22 December 2020). "In Memoriam: Robert H. Johns 1942 – 2020". National Weather Association. Retrieved 3 January 2023.
- ^ Herzmann, Daryl. "IEM :: SWO from NWS MKC". mesonet.agron.iastate.edu. Retrieved 2020-12-22.
- ^ Herzmann, Daryl. "IEM :: SWO from NWS MKC". mesonet.agron.iastate.edu. Retrieved 2020-12-22.
- ^ "Tornado History Project: March 27, 1984". www.tornadohistoryproject.com. Retrieved 2020-12-22.
- ^ Badgett, Phillip; Smith, Barrett; Blaes, Jonathan; Gonski, Rod & Keeter, Kermit (March 18, 2009). "March 28, 1984 Carolina's Tornado Outbreak". National Weather Service Office in Raleigh, North Carolina. North Carolina State University. Retrieved June 18, 2013.
- ^ Herzmann, Daryl. "IEM :: SWO from NWS MKC". mesonet.agron.iastate.edu. Retrieved 2020-12-22.
- ^ "March 28, 1984 Tornado List". National Climatic Data Center. Tornado History Project. 2013. Retrieved June 17, 2013.
- ^ Herzmann, Daryl. "IEM :: SWO from NWS MKC". mesonet.agron.iastate.edu. Retrieved 2020-12-22.
- ^ "Tornado History Project: April 26, 1984". www.tornadohistoryproject.com. Retrieved 2020-12-22.
- ^ Herzmann, Daryl. "IEM :: SWO from NWS MKC". mesonet.agron.iastate.edu. Retrieved 2020-12-22.
- ^ "Tornado History Project: April 29, 1984". www.tornadohistoryproject.com. Retrieved 2020-12-22.
- ^ Click, Terry; Figurskey, Darin; Hartfield, Gail; McLamb, Bradley; Orrock, Jeff; Sharp, Scott; Smith, Barrett; Vincent, Brandon; Blaes, Jonathan; Wrenn, Rachel & Andersen, Lindsey (February 3, 2012). "April 16, 2011 North Carolina Tornado Outbreak". National Weather Service Office in Raleigh, North Carolina. North Carolina State University. Retrieved June 18, 2013.
- ^ Herzmann, Daryl. "IEM :: SWO from NWS MKC". mesonet.agron.iastate.edu. Retrieved 2020-12-22.
- ^ "May 3, 1984 Tornado List". National Climatic Data Center. Tornado History Project. 2013. Retrieved June 17, 2013.
- ^ Herzmann, Daryl. "IEM :: SWO from NWS MKC". mesonet.agron.iastate.edu. Retrieved 2020-12-22.
- ^ "Tornado History Project: October 18, 1984". www.tornadohistoryproject.com. Retrieved 2020-12-22.
- ^ Herzmann, Daryl. "IEM :: SWO from NWS MKC". mesonet.agron.iastate.edu. Retrieved 2020-12-22.
- ^ "Tornado History Project: April 21, 1985". www.tornadohistoryproject.com. Retrieved 2020-12-22.
- ^ Herzmann, Daryl. "IEM :: SWO from NWS MKC". mesonet.agron.iastate.edu. Retrieved 2020-12-22.
- ^ Herzmann, Daryl. "IEM :: SWO from NWS MKC". mesonet.agron.iastate.edu. Retrieved 2020-12-22.
- ^ "Tornado History Project: May 11, 1985". www.tornadohistoryproject.com. Retrieved 2020-12-22.
- ^ Herzmann, Daryl. "IEM :: SWO from NWS MKC". mesonet.agron.iastate.edu. Retrieved 2020-12-22.
- ^ "Tornado History Project: May 13, 1985". www.tornadohistoryproject.com. Retrieved 2020-12-22.
- ^ Herzmann, Daryl. "IEM :: SWO from NWS MKC". mesonet.agron.iastate.edu. Retrieved 2020-12-22.
- ^ "Tornado History Project: May 30, 1985". www.tornadohistoryproject.com. Retrieved 2020-12-22.
- ^ Herzmann, Daryl. "IEM :: SWO from NWS MKC". mesonet.agron.iastate.edu. Retrieved 2020-12-22.
- ^ "July 4th, 1985 Severe Storm Reports".
- ^ "Tornado History Project: July 4, 1985". www.tornadohistoryproject.com. Retrieved 2020-12-22.
- ^ Herzmann, Daryl. "IEM :: SWO from NWS DY1". mesonet.agron.iastate.edu. Retrieved 2020-12-22.
- ^ "Tornado History Project: March 11, 1986". www.tornadohistoryproject.com. Retrieved 2020-12-22.
- ^ Herzmann, Daryl. "IEM :: SWO from NWS DY1". mesonet.agron.iastate.edu. Retrieved 2020-12-22.
- ^ "Tornado History Project: April 19, 1986". www.tornadohistoryproject.com. Retrieved 2020-12-22.
- ^ Herzmann, Daryl. "IEM :: SWO from NWS DY1". mesonet.agron.iastate.edu. Retrieved 2020-12-22.
- ^ "Tornado History Project: March 22, 1987". www.tornadohistoryproject.com. Retrieved 2020-12-22.
- ^ Herzmann, Daryl. "IEM :: SWO from NWS DY1". mesonet.agron.iastate.edu. Retrieved 2020-12-22.
- ^ "Tornado History Project: May 28, 1987". www.tornadohistoryproject.com. Retrieved 2020-12-22.
- ^ Herzmann, Daryl. "IEM :: SWO from NWS DY1". mesonet.agron.iastate.edu. Retrieved 2020-12-22.
- ^ "Storm Events Database – Search Results | National Centers for Environmental Information". www.ncdc.noaa.gov. Retrieved 2020-12-22.
- ^ "Tornado History Project: July 20, 1987". www.tornadohistoryproject.com. Retrieved 2020-12-22.
- ^ Herzmann, Daryl. "IEM :: SWO from NWS DY1". mesonet.agron.iastate.edu. Retrieved 2020-12-22.
- ^ "Tornado History Project: November 16, 1987". www.tornadohistoryproject.com. Retrieved 2020-12-22.
- ^ Herzmann, Daryl. "IEM :: SWO from NWS DY1". mesonet.agron.iastate.edu. Retrieved 2020-12-22.
- ^ "Tornado History Project: December 14, 1987". www.tornadohistoryproject.com. Retrieved 2020-12-22.
- ^ Herzmann, Daryl. "IEM :: SWO from NWS DY1". mesonet.agron.iastate.edu. Retrieved 2020-12-22.
- ^ "Tornado History Project: January 19, 1988". www.tornadohistoryproject.com. Retrieved 2020-12-22.
- ^ Herzmann, Daryl. "IEM :: SWO from NWS DY1". mesonet.agron.iastate.edu. Retrieved 2020-12-22.
- ^ "Storm Events Database – Search Results | National Centers for Environmental Information". www.ncdc.noaa.gov. Retrieved 2020-12-22.
- ^ "Tornado History Project: March 24, 1988". www.tornadohistoryproject.com. Retrieved 2020-12-22.
- ^ Herzmann, Daryl. "IEM :: SWO from NWS DY1". mesonet.agron.iastate.edu. Retrieved 2020-12-22.
- ^ "Tornado History Project: November 4, 1988". www.tornadohistoryproject.com. Retrieved 2020-12-22.
- ^ Herzmann, Daryl. "IEM :: SWO from NWS DY1". mesonet.agron.iastate.edu. Retrieved 2020-12-22.
- ^ "Tornado History Project: November 15, 1988". www.tornadohistoryproject.com. Retrieved 2020-12-22.
- ^ Herzmann, Daryl. "IEM :: SWO from NWS DY1". mesonet.agron.iastate.edu. Retrieved 2020-12-22.
- ^ "Tornado History Project: November 26, 1988". www.tornadohistoryproject.com. Retrieved 2020-12-22.
- ^ Herzmann, Daryl. "IEM :: SWO from NWS DY1". mesonet.agron.iastate.edu. Retrieved 2020-12-22.
- ^ "Tornado History Project: March 5, 1989". www.tornadohistoryproject.com. Retrieved 2020-12-22.
- ^ "The Weather Channel – May 16, 1989". The Weather Channel. Archived from the original on 2021-12-19. Retrieved 4 March 2017.
- ^ Herzmann, Daryl. "IEM :: SWO from NWS DY1". mesonet.agron.iastate.edu. Retrieved 2020-12-22.
- ^ Ziem, Andrew. "This Date in Weather History". El Gheko Neighborhood Weather Station. Retrieved 4 March 2017.
- ^ Herzmann, Daryl. "IEM :: SWO from NWS DY1". mesonet.agron.iastate.edu. Retrieved 2020-12-22.
- ^ "Tornado History Project: May 17, 1989". www.tornadohistoryproject.com. Retrieved 2020-12-22.
- ^ Herzmann, Daryl. "IEM :: SWO from NWS DY1". mesonet.agron.iastate.edu. Retrieved 2020-12-22.
- ^ "Tornado History Project: May 24, 1989". www.tornadohistoryproject.com. Retrieved 2020-12-22.
- ^ Herzmann, Daryl. "IEM :: SWO from NWS DY1". mesonet.agron.iastate.edu. Retrieved 2020-12-22.
- ^ "Tornado History Project: June 13, 1989". www.tornadohistoryproject.com. Retrieved 2020-12-22.
- ^ a b c d e f "High-Risk Days of the 1980s and 1990s". ConvectiveOutlook. 2013. Retrieved June 18, 2013.
- ^ "November 15, 1989 Tornado List". National Climatic Data Center. Tornado History Project. 2013. Retrieved June 17, 2013.
- ^ Herzmann, Daryl. "IEM :: SWO from NWS DY1". mesonet.agron.iastate.edu. Retrieved 2020-12-22.
- ^ "Tornado History Project: February 1, 1990". www.tornadohistoryproject.com. Retrieved 2020-12-22.
- ^ Herzmann, Daryl. "IEM :: SWO from NWS DY1". mesonet.agron.iastate.edu. Retrieved 2020-12-22.
- ^ "Tornado History Project: March 14, 1990". www.tornadohistoryproject.com. Retrieved 2020-12-22.
- ^ Herzmann, Daryl. "IEM :: SWO from NWS DY1". mesonet.agron.iastate.edu. Retrieved 2020-12-22.
- ^ "Tornado History Project: May 9, 1990". www.tornadohistoryproject.com. Retrieved 2020-12-22.
- ^ Herzmann, Daryl. "IEM :: SWO from NWS DY1". mesonet.agron.iastate.edu. Retrieved 2020-12-22.
- ^ "May 15, 1990 Tornado List". National Climatic Data Center. Tornado History Project. 2013. Retrieved June 18, 2013.
- ^ Herzmann, Daryl. "IEM :: SWO from NWS DY1". mesonet.agron.iastate.edu. Retrieved 2020-12-22.
- ^ "Tornado History Project: May 20, 1990". www.tornadohistoryproject.com. Retrieved 2020-12-22.
- ^ Herzmann, Daryl. "IEM :: SWO from NWS DY1". mesonet.agron.iastate.edu. Retrieved 2020-12-22.
- ^ "Storm Events Database – Search Results | National Centers for Environmental Information". www.ncdc.noaa.gov. Retrieved 2020-12-22.
- ^ "Tornado History Project: May 29, 1990". www.tornadohistoryproject.com. Retrieved 2020-12-22.
- ^ Herzmann, Daryl. "IEM :: SWO from NWS DY1". mesonet.agron.iastate.edu. Retrieved 2020-12-22.
- ^ "Tornado History Project: June 1, 1990". www.tornadohistoryproject.com. Retrieved 2020-12-22.
- ^ "June 2, 1990 Tornado List". National Climatic Data Center. Tornado History Project. 2013. Retrieved June 18, 2013.
- ^ a b Herzmann, Daryl. "IEM :: SWO from NWS DY1". mesonet.agron.iastate.edu. Retrieved 2020-12-22.
- ^ Herzmann, Daryl. "IEM :: SWO from NWS DY1". mesonet.agron.iastate.edu. Retrieved 2020-12-22.
- ^ "Tornado History Project: March 26, 1991". www.tornadohistoryproject.com. Retrieved 2020-12-22.
- ^ Herzmann, Daryl. "IEM :: SWO from NWS DY1". mesonet.agron.iastate.edu. Retrieved 2020-12-22.
- ^ "Tornado History Project: March 27, 1991". www.tornadohistoryproject.com. Retrieved 2020-12-22.
- ^ Herzmann, Daryl. "IEM :: SWO from NWS DY1". mesonet.agron.iastate.edu. Retrieved 2020-12-22.
- ^ "Tornado History Project: March 28, 1991". www.tornadohistoryproject.com. Retrieved 2020-12-22.
- ^ Herzmann, Daryl. "IEM :: SWO from NWS DY1". mesonet.agron.iastate.edu. Retrieved 2020-12-22.
- ^ "March 29, 1991 Tornado List". National Climatic Data Center. Tornado History Project. 2013. Retrieved June 18, 2013.
- ^ Satkus, Robert. "April 11, 1991". Fire Dispatcher. Archived from the original on February 25, 2002. Retrieved June 18, 2013.
- ^ "April 11, 1991 Tornado List". National Climatic Data Center. Tornado History Project. 2013. Retrieved June 18, 2013.
- ^ "April 12, 1991 Tornado List". National Climatic Data Center. Tornado History Project. 2013. Retrieved June 18, 2013.
- ^ "April 26, 1991 Tornado List". National Climatic Data Center. Tornado History Project. 2013. Retrieved June 18, 2013.
- ^ Satkus, Robert. "April 28, 1991". Fire Dispatcher. Archived from the original on June 10, 2007. Retrieved June 18, 2013.
- ^ "April 28, 1991 Tornado List". National Climatic Data Center. Tornado History Project. 2013. Retrieved June 18, 2013.
- ^ Herzmann, Daryl. "IEM :: SWO from NWS DY1". mesonet.agron.iastate.edu. Retrieved 2020-12-23.
- ^ "Tornado History Project: April 19, 1992". www.tornadohistoryproject.com. Retrieved 2020-12-23.
- ^ Ostby, Frederick P. (1992). "Operations of the National Severe Storms Forecast Center" (PDF). National Severe Storms Forecast Center. Retrieved 2008-08-02. [dead link]
- ^ "June 16, 1992 Tornado List". National Climatic Data Center. Tornado History Project. 2013. Retrieved June 18, 2013.
- ^ Herzmann, Daryl. "IEM :: SWO from NWS DY1". mesonet.agron.iastate.edu. Retrieved 2020-12-24.
- ^ "June 17, 1992 Tornado List". National Climatic Data Center. Tornado History Project. 2013. Retrieved June 18, 2013.
- ^ Herzmann, Daryl. "IEM :: SWO from NWS DY1". mesonet.agron.iastate.edu. Retrieved 2020-12-24.
- ^ "Tornado History Project: June 19, 1992". www.tornadohistoryproject.com. Retrieved 2020-12-23.
- ^ Herzmann, Daryl. "IEM :: SWO from NWS DY1". mesonet.agron.iastate.edu. Retrieved 2020-12-23.
- ^ "Tornado History Project: July 2, 1992". www.tornadohistoryproject.com. Retrieved 2020-12-23.
- ^ Herzmann, Daryl. "IEM :: SWO from NWS DY1". mesonet.agron.iastate.edu. Retrieved 2020-12-23.
- ^ "Storm Events Database – Search Results | National Centers for Environmental Information". www.ncdc.noaa.gov. Retrieved 2020-12-23.
- ^ "Tornado History Project: September 9, 1992". www.tornadohistoryproject.com. Retrieved 2020-12-23.
- ^ Herzmann, Daryl. "IEM :: SWO from NWS DY1". mesonet.agron.iastate.edu. Retrieved 2020-12-24.
- ^ "Tornado History Project: April 19, 1993". www.tornadohistoryproject.com. Retrieved 2020-12-24.
- ^ Herzmann, Daryl. "IEM :: SWO from NWS DY1". mesonet.agron.iastate.edu. Retrieved 2020-12-24.
- ^ Herzmann, Daryl. "IEM :: SWO from NWS DY1". mesonet.agron.iastate.edu. Retrieved 2020-12-24.
- ^ US Department of Commerce, NOAA. "An Analysis of Five Springtime Derechos". www.weather.gov. Retrieved 2020-12-24.
- ^ Times-Dispatch, JOHN BOYER Richmond (4 June 2018). "25 years ago: The windstorm that blasted Virginia when 'derecho' was still an obscure word". Richmond Times-Dispatch.
- ^ "Tornado History Project: June 4, 1993". www.tornadohistoryproject.com. Retrieved 2020-12-24.
- ^ Herzmann, Daryl. "IEM :: SWO from NWS DY1". mesonet.agron.iastate.edu. Retrieved 2020-12-24.
- ^ "June 7, 1993 Tornado List". National Climatic Data Center. Tornado History Project. 2013. Retrieved June 18, 2013.
- ^ Herzmann, Daryl. "IEM :: SWO from NWS DY1". mesonet.agron.iastate.edu. Retrieved 2020-12-22.
- ^ "Tornado History Project: June 8, 1993". www.tornadohistoryproject.com. Retrieved 2020-12-22.
- ^ Herzmann, Daryl. "IEM :: SWO from NWS DY1". mesonet.agron.iastate.edu. Retrieved 2020-12-24.
- ^ "Tornado History Project: June 23, 1993". www.tornadohistoryproject.com. Retrieved 2020-12-24.
- ^ Herzmann, Daryl. "IEM :: SWO from NWS DY1". mesonet.agron.iastate.edu. Retrieved 2020-12-24.
- ^ "Tornado History Project: July 3, 1993". www.tornadohistoryproject.com. Retrieved 2020-12-24.
- ^ Herzmann, Daryl. "IEM :: SWO from NWS DY1". mesonet.agron.iastate.edu. Retrieved 2020-12-24.
- ^ "March 27, 1994 Tornado List". National Climatic Data Center. Tornado History Project. 2013. Retrieved June 18, 2013.
- ^ Herzmann, Daryl. "IEM :: SWO from NWS DY1". mesonet.agron.iastate.edu. Retrieved 2020-12-24.
- ^ "April 25, 1994 Tornado List". National Climatic Data Center. Tornado History Project. 2013. Retrieved June 18, 2013.
- ^ "Severe Weather Archive". www.spc.noaa.gov.
- ^ Herzmann, Daryl. "IEM :: SWO from NWS DY1". mesonet.agron.iastate.edu. Retrieved 2020-12-24.
- ^ "Tornado History Project: June 14, 1994". www.tornadohistoryproject.com. Retrieved 2020-12-24.
- ^ Herzmann, Daryl. "IEM :: SWO from NWS DY1". mesonet.agron.iastate.edu. Retrieved 2020-12-22.
- ^ "August 27, 1994 Tornado List". National Climatic Data Center. Tornado History Project. 2013. Retrieved June 18, 2013.
- ^ Herzmann, Daryl. "IEM :: SWO from NWS DY1". mesonet.agron.iastate.edu. Retrieved 2020-12-24.
- ^ "November 27, 1994 Tornado List". National Climatic Data Center. Tornado History Project. 2013. Retrieved June 18, 2013.
- ^ "April 17, 1995 Tornado List". National Climatic Data Center. Tornado History Project. 2013. Retrieved June 17, 2013.
- ^ "May 7, 1995 Tornado List". National Climatic Data Center. Tornado History Project. 2013. Retrieved June 17, 2013.
- ^ "May 12, 1995 Tornado List". National Climatic Data Center. Tornado History Project. 2013. Retrieved June 17, 2013.
- ^ "May 13, 1995 Tornado List". National Climatic Data Center. Tornado History Project. 2013. Retrieved June 17, 2013.
- ^ "May 17, 1995 Tornado List". National Climatic Data Center. Tornado History Project. 2013. Retrieved June 17, 2013.
- ^ Herzmann, Daryl. "IEM :: SWO from NWS DY1". mesonet.agron.iastate.edu. Retrieved 2021-01-10.
- ^ "Tornado History Project: March 18, 1996". www.tornadohistoryproject.com. Retrieved 2021-01-10.
- ^ "April 19, 1996 1500Z Outlook".
- ^ "April 19, 1996 1900Z Outlook".
- ^ "April 19, 1996 Tornado List". National Climatic Data Center. Tornado History Project. 2013. Retrieved June 17, 2013.
- ^ Herzmann, Daryl. "IEM :: SWO from NWS DY1". mesonet.agron.iastate.edu. Retrieved 2021-01-12.
- ^ "Tornado History Project: March 2, 1997". www.tornadohistoryproject.com. Retrieved 2021-01-12.
- ^ "May 2, 1997 Tornado List". National Climatic Data Center. Tornado History Project. 2013. Retrieved June 17, 2013.
- ^ "July 1, 1997 Tornado List". National Climatic Data Center. Tornado History Project. 2013. Retrieved June 17, 2013.
- ^ Herzmann, Daryl. "IEM :: SWO from NWS DY1". mesonet.agron.iastate.edu. Retrieved 2021-01-12.
- ^ "Tornado History Project: October 25, 1997". www.tornadohistoryproject.com. Retrieved 2021-01-12.
- ^ "February 10, 1998 Tornado List". National Climatic Data Center. Tornado History Project. 2013. Retrieved June 17, 2013.
- ^ NOAA's National Weather Service – Birmingham, Alabama
- ^ "April 8, 1998 Tornado List". National Climatic Data Center. Tornado History Project. 2013. Retrieved June 17, 2013.
- ^ "April 16, 1998 Tornado List". National Climatic Data Center. Tornado History Project. 2013. Retrieved June 17, 2013.
- ^ Herzmann, Daryl. "IEM :: SWO from NWS DY1". mesonet.agron.iastate.edu. Retrieved 2021-01-14.
- ^ "Tornado History Project: May 9, 1998". www.tornadohistoryproject.com. Retrieved 2021-01-14.
- ^ Derecho – May 31, 1998
- ^ The Southern Great Lakes Derecho of 1998
- ^ Storm Prediction Center May 31, 1998 0600 UTC Day 1 Convective Outlook
- ^ Storm Prediction Center May 31, 1998 1500 UTC Day 1 Convective Outlook
- ^ "May 31, 1998 Tornado List". National Climatic Data Center. Tornado History Project. 2013. Archived from the original on 2019-11-11. Retrieved June 17, 2013.
- ^ "June 14, 1998 Tornado List". National Climatic Data Center. Tornado History Project. 2013. Retrieved June 17, 2013.
- ^ "12z SPC Convective Outlook" (jpg). Retrieved 2023-08-14.
- ^ Front Page Display and Description-Example
- ^ "January 21, 1999 Tornado List". National Climatic Data Center. Tornado History Project. 2013. Retrieved June 17, 2013.
- ^ a b Eric Nguyen's 1999 Chase Documents!
- ^ "Doppler On Wheels". 3 May 1999. Archived from the original on 5 February 2007. Retrieved 13 June 2013.
- ^ "Archived copy". Archived from the original on 2007-10-29. Retrieved 2008-02-18.
{{cite web}}: CS1 maint: archived copy as title (link) - ^ Identification of Inhibiting Factors of a Null Significant Tornado Event Archived 2007-10-29 at the Wayback Machine
- ^ Imy (April 6, 2001). "April 6, 2001 2000UTC Day 1 Outlook". Storm Prediction Center. National Oceanic and Atmospheric Administration. Retrieved June 18, 2013."SPC Severe Weather Event Review for Friday April 06, 2001". www.spc.noaa.gov. Retrieved 17 November 2022.
- ^ "Storm Prediction Center 010406's Storm Reports". www.spc.noaa.gov. Retrieved 2024-02-24.
- ^ "April 6, 2001 Severe Events". National Centers for Environmental Information. National Weather Service. Retrieved 17 November 2022.
- ^ Craven (April 11, 2001). "April 11, 2001 2000UTC Day 1 Outlook". Storm Prediction Center. National Oceanic and Atmospheric Administration. Retrieved June 18, 2013."SPC Severe Weather Event Review for Wednesday April 11, 2001". www.spc.noaa.gov. Retrieved 17 November 2022.
- ^ "April 11, 2001 Severe Events". National Centers for Environmental Information. Retrieved 17 November 2022.
- ^ Johns (June 11, 2001). "June 11, 2001 2000UTC Day 1 Outlook". Storm Prediction Center. National Oceanic and Atmospheric Administration. Retrieved June 18, 2013."SPC Severe Weather Event Review for Monday June 11, 2001". www.spc.noaa.gov. Retrieved 17 November 2022.
- ^ "Storm Prediction Center 20010611's Storm Reports". www.spc.noaa.gov. Retrieved 2024-02-24.
- ^ "June 11, 2001 Severe Events". National Centers for Environmental Information. National Weather Service. Retrieved 17 November 2022.
- ^ Storm Prediction Center (2001). "Severe weather outlook for October 13, 2001". Retrieved 2008-03-12."SPC Severe Weather Event Review for Saturday October 13, 2001". www.spc.noaa.gov. Retrieved 17 November 2022.
- ^ "October 13, 2001 Severe Events". National Centers for Environmental Information. National Weather Service. Retrieved 17 November 2022.
- ^ Storm Prediction Center (2001). "Severe weather outlook for October 24, 2001". Retrieved 2008-03-12."SPC Severe Weather Event Review for Wednesday October 24, 2001". www.spc.noaa.gov. Retrieved 17 November 2022.
- ^ "October 24, 2001 Severe Events". National Centers for Environmental Information. National Weather Service. Retrieved 17 November 2022.
- ^ "Storm Prediction Center 011024's Storm Reports". www.spc.noaa.gov. Retrieved 2022-12-27.
- ^ Storm Prediction Center (2002). "Severe weather outlook for April 16, 2002". Retrieved 2008-03-12."SPC Severe Weather Event Review for Tuesday April 16, 2002". www.spc.noaa.gov. Retrieved 17 November 2022.
- ^ "April 16, 2002 Severe Events". National Centers for Environmental Information. National Weather Service. Retrieved 17 November 2022.
- ^ Storm Prediction Center (2002). "Severe weather outlook for July 31, 2002". Retrieved 2008-03-12.
- ^ "Storm Events Database: July 31, 2002 All Reports". National Climatic Data Center. National Oceanic and Atmospheric Administration. 2013. Archived from the original on January 17, 2016. Retrieved June 15, 2013.
- ^ "July 31, 2002 Tornado List". National Climatic Data Center. Tornado History Project. 2013. Retrieved June 15, 2013.
- ^ Storm Prediction Center (2002). "Severe weather outlook for November 10, 2002". Retrieved 2008-03-12.
- ^ "Storm Events Database: November 10, 2002 All Reports". National Climatic Data Center. National Oceanic and Atmospheric Administration. 2013. Archived from the original on January 17, 2016. Retrieved June 15, 2013.
- ^ "November 10, 2002 Tornado List". National Climatic Data Center. Tornado History Project. 2013. Retrieved June 15, 2013.
- ^ Storm Prediction Center (2002). "Severe weather outlook for December 23, 2002". Retrieved 2008-03-12.
- ^ "Storm Events Database: December 23, 2002 All Reports". National Climatic Data Center. National Oceanic and Atmospheric Administration. 2013. Archived from the original on January 17, 2016. Retrieved June 15, 2013.
- ^ "December 23, 2002 Tornado List". National Climatic Data Center. Tornado History Project. 2013. Retrieved June 15, 2013.
- ^ Storm Prediction Center (2003). "Severe weather outlook for April 6, 2003". Retrieved 2008-03-12.
- ^ "April 6, 2003 Tornado List". National Climatic Data Center. Tornado History Project. 2013. Retrieved June 16, 2013.
- ^ Storm Prediction Center (2003). "Severe weather outlook for May 4, 2003". Retrieved 2008-03-12.
- ^ "May 4, 2003 Tornado List". National Climatic Data Center. Tornado History Project. 2013. Retrieved June 16, 2013.
- ^ Storm Prediction Center (2003). "Severe weather outlook for May 5, 2003". Retrieved 2008-03-12.
- ^ "May 5, 2003 Tornado List". National Climatic Data Center. Tornado History Project. 2013. Retrieved June 16, 2013.
- ^ Storm Prediction Center (2003). "Severe weather outlook for May 8, 2003". Retrieved 2008-03-12.
- ^ "May 8, 2003 Tornado List". National Climatic Data Center. Tornado History Project. 2013. Retrieved June 16, 2013.
- ^ Storm Prediction Center (2003). "Severe weather outlook for May 10, 2003". Retrieved 2008-03-12.
- ^ "May 10, 2003 Tornado List". National Climatic Data Center. Tornado History Project. 2013. Retrieved June 16, 2013.
- ^ Storm Prediction Center (2003). "Severe weather report for May 15, 2003". Retrieved 2008-03-12.
- ^ "May 15, 2003 Tornado List". National Climatic Data Center. Tornado History Project. 2013. Retrieved June 16, 2013.
- ^ Storm Prediction Center (2004). "Severe weather outlook for March 4, 2004". Retrieved 2008-03-12.
- ^ "March 4, 2004 Tornado List". National Climatic Data Center. Tornado History Project. 2013. Retrieved June 16, 2013.
- ^ Storm Prediction Center (2004). "Severe weather outlook for May 22, 2004". Retrieved 2008-03-12.
- ^ "May 22, 2004 Tornado List". National Climatic Data Center. Tornado History Project. 2013. Retrieved June 16, 2013.
- ^ Storm Prediction Center (2004). "Severe weather outlook for May 24, 2004". Retrieved 2008-03-12.
- ^ "May 24, 2004 Tornado List". National Climatic Data Center. Tornado History Project. 2013. Retrieved June 16, 2013.
- ^ "Storm Prediction Center 20040524's Storm Reports". www.spc.noaa.gov. Retrieved 2024-02-24.
- ^ Storm Prediction Center (2004). "Severe weather outlook for May 29, 2004". Retrieved 2008-03-12.
- ^ "May 29, 2004 Tornado List". National Climatic Data Center. Tornado History Project. 2013. Retrieved June 16, 2013.
- ^ Storm Prediction Center (2004). "Severe weather outlook for May 30, 2004". Retrieved 2008-03-12.
- ^ "May 30, 2004 Tornado List". National Climatic Data Center. Tornado History Project. 2013. Retrieved June 16, 2013.
- ^ Storm Prediction Center (2005). "Severe weather outlook for April 11, 2005". Retrieved 2008-03-12.
- ^ "April 11, 2005 Tornado List". National Climatic Data Center. Tornado History Project. 2013. Retrieved June 16, 2013.
- ^ Storm Prediction Center (2005). "Severe weather outlook for June 4, 2005". Retrieved 2008-03-12.
- ^ "June 4, 2005 Tornado List". National Climatic Data Center. Tornado History Project. 2013. Retrieved June 16, 2013.
- ^ Storm Prediction Center (2005). "Severe weather outlook for November 15, 2005". Retrieved 2008-03-12.
- ^ "November 15, 2005 Tornado List". National Climatic Data Center. Tornado History Project. 2013. Retrieved June 16, 2013.
- ^ Storm Prediction Center (2006). "Severe weather outlook for March 12, 2006". Retrieved 2008-03-12.
- ^ "March 12, 2006 Tornado List". National Climatic Data Center. Tornado History Project. 2013. Retrieved June 16, 2013.
- ^ Storm Prediction Center (2006). "Severe weather outlook for April 6, 2006". Retrieved 2008-03-12.
- ^ "April 6, 2006 Tornado List". National Climatic Data Center. Tornado History Project. 2013. Retrieved June 16, 2013.
- ^ Storm Prediction Center (2006). "Severe weather outlook for April 7, 2006". Retrieved 2008-03-12.
- ^ "Storm Prediction Center Apr 7, 2006 2000 UTC Day 1 Convective Outlook". www.spc.noaa.gov. Retrieved 2021-09-13.
- ^ "April 7, 2006 Tornado List". National Climatic Data Center. Tornado History Project. 2013. Retrieved June 16, 2013.
- ^ Storm Prediction Center (2007). "Severe weather outlook for March 1, 2007". Retrieved 2008-03-12.
- ^ "March 1, 2007 Tornado List". National Climatic Data Center. Tornado History Project. 2013. Retrieved June 16, 2013.
- ^ Storm Prediction Center (2007). "Severe weather outlook for April 13, 2007". Retrieved 2008-03-12.
- ^ "April 13, 2007 Tornado List". National Climatic Data Center. Tornado History Project. 2013. Retrieved June 16, 2013.
- ^ Storm Prediction Center (2007). "Severe weather outlook for April 24, 2007". Retrieved 2008-03-12.
- ^ "April 24, 2007 Tornado List". National Climatic Data Center. Tornado History Project. 2013. Retrieved June 16, 2013.
- ^ Storm Prediction Center (2007). "Severe weather outlook for May 5, 2007". Retrieved 2008-03-12.
- ^ "May 5, 2007 Tornado List". National Climatic Data Center. Tornado History Project. 2013. Retrieved June 16, 2013.
- ^ Storm Prediction Center (2007). "Severe weather outlook for June 7, 2007". Retrieved 2008-03-12.
- ^ "June 7, 2007 Tornado List". National Climatic Data Center. Tornado History Project. 2013. Retrieved June 16, 2013.
- ^ "SPC Severe Weather Event Review for Thursday June 07, 2007". www.spc.noaa.gov. Retrieved 2024-02-24.
- ^ Storm Prediction Center (2008). "Severe weather outlook for February 5, 2008". Retrieved 2008-03-12.
- ^ "February 5, 2008 Tornado List". National Climatic Data Center. Tornado History Project. 2013. Retrieved June 16, 2013.
- ^ Storm Prediction Center Mar 15, 2008 2000 UTC Day 1 Convective Outlook
- ^ "March 15, 2008 Tornado List". National Climatic Data Center. Tornado History Project. 2013. Retrieved June 16, 2013.
- ^ Storm Prediction Center May 22, 2008 2000 UTC Day 1 Convective Outlook
- ^ "May 22, 2008 Tornado List". National Climatic Data Center. Tornado History Project. 2013. Retrieved June 16, 2013.
- ^ Storm Prediction Center May 29, 2008 1300 UTC Day 1 Convective Outlook
- ^ "May 29, 2008 Tornado List". National Climatic Data Center. Tornado History Project. 2013. Retrieved June 16, 2013.
- ^ Storm Prediction Center June 5, 2008 1300 UTC Day 1 Convective Outlook
- ^ "June 5, 2008 Tornado List". National Climatic Data Center. Tornado History Project. 2013. Retrieved June 16, 2013.
- ^ Center, Storm Prediction. "Storm Prediction Center Storm Reports Page". www.spc.noaa.gov. Retrieved 2022-12-28.
- ^ Storm Prediction Center April 10, 2009 2000 UTC Day 1 Convective Outlook
- ^ "April 10, 2009 Tornado List". National Climatic Data Center. Tornado History Project. 2013. Retrieved June 16, 2013.
- ^ Storm Prediction Center April 26, 2009 1630 UTC Day 1 Convective Outlook
- ^ "April 26, 2009 Tornado List". National Climatic Data Center. Tornado History Project. 2013. Retrieved June 16, 2013.
- ^ Storm Prediction Center April 24, 2010 1200 UTC Day 1 Convective Outlook
- ^ "Storm Prediction Center Monthly and Annual Summaries". Spc.noaa.gov. Retrieved 2013-06-13.
- ^ Storm Prediction Center April 30, 2010 1300 UTC Day 1 Convective Outlook
- ^ "Ark. tornadoes kill 1, injure two dozen – Weather | NBC News". NBC News. 2010-01-05. Retrieved 2013-06-13.
- ^ Storm Prediction Center May 1, 2010 1300 UTC Day 1 Convective Outlook
- ^ Storm Prediction Center May 10, 2010 0600 UTC Day 1 Convective Outlook
- ^ Storm Prediction Center May 19, 2010 1630 UTC Day 1 Convective Outlook
- ^ Storm Prediction Center October 26, 2010 0600 UTC Day 1 Convective Outlook
- ^ Center, Storm Prediction. "Storm Prediction Center Storm Reports Page". www.spc.noaa.gov. Retrieved 2022-12-28.
- ^ Storm Prediction Center April 16, 2011 1630 UTC Day 1 Convective Outlook
- ^ Storm Prediction Center April 26, 2011 1300 UTC Day 1 Convective Outlook
- ^ "SPC Severe Weather Event Review for Tuesday April 26, 2011". www.spc.noaa.gov. Retrieved 2024-03-26.
- ^ Storm Prediction Center April 27, 2011 2000 UTC Day 1 Convective Outlook
- ^ Tornado Watch 235 Watch Hazard Probabilities April 27, 2011 1846 UTC
- ^ Storm Prediction Center May 24, 2011 1200 UTC Day 1 Convective Outlook
- ^ Storm Prediction Center May 25, 2011 2000 UTC Day 1 Convective Outlook
- ^ Storm Prediction Center March 2, 2012 2000 UTC Day 1 Convective Outlook
- ^ a b Storm Prediction Center April 13, 2012 0600 UTC Day 2 Convective Outlook
- ^ Storm Prediction Center June 12, 2013 1630 UTC Day 1 Convective Outlook
- ^ Center, Storm Prediction. "Storm Prediction Center Storm Reports Page". www.spc.noaa.gov. Retrieved 2022-12-28.
- ^ Storm Prediction Center November 17, 2013 0600 UTC Day 1 Convective Outlook
- ^ "Coroner: 2 killed when tornado strikes farmhouse in southern Illinois as storms slam Midwest". The Republic. Associated Press. November 17, 2013. Archived from the original on November 18, 2013. Retrieved November 17, 2013.
- ^ Dozier, Danielle (November 18, 2013). "How rare are high risk days in November?". KOCO TV. Retrieved November 22, 2013.
- ^ Center, Storm Prediction. "Storm Prediction Center Storm Reports Page". www.spc.noaa.gov. Retrieved 2024-02-24.
- ^ Storm Prediction Center April 27, 2014 2000 UTC Day 1 Convective Outlook
- ^ Storm Prediction Center April 28, 2014 0100 UTC Day 1 Convective Outlook
- ^ Storm Prediction Center April 28, 2014 2000 UTC Day 1 Convective Outlook
- ^ "Tornado Outbreak April 28–29, 2014". National Weather Service office in Birmingham, Alabama. National Oceanic and Atmospheric Administration. May 2, 2014. Retrieved May 3, 2014.
- ^ Storm Prediction Center June 3, 2014 2000 UTC Day 1 Convective Outlook
- ^ Storm Prediction Center January 22, 2017 2000 UTC Day 1 Convective Outlook
- ^ Ferrell, Jesse. "Major tornado outbreak likely Sunday". Accuweather. Retrieved 23 January 2017.
- ^ Storm Prediction Center April 2, 2017 1630 UTC Day 1 Convective Outlook
- ^ "Storm Prediction Center". SPC Storm Reports. Retrieved 3 April 2017.
- ^ Storm Prediction Center April 5, 2017 1630 UTC Day 1 Convective Outlook
- ^ "Storm Prediction Center". SPC Storm Reports. Retrieved 6 April 2017.
- ^ Storm Prediction Center May 18, 2017 0600 UTC Day 1 Convective Outlook
- ^ "Storm Prediction Center". SPC Storm Reports. Retrieved 19 May 2017.
- ^ Storm Prediction Center May 20, 2019 1630 UTC Day 1 Convective Outlook
- ^ "Storm Prediction Center PDS Tornado Watch 199". www.spc.noaa.gov. Retrieved 2019-05-21.
- ^ "Storm Prediction Center". SPC Storm Reports. Retrieved 28 May 2019.
- ^ "SPC Severe Weather Event Review for Wednesday March 17, 2021". www.spc.noaa.gov. Retrieved 17 November 2022.
- ^ "Storm Prediction Center Day 1 Outlook and Preliminary Reports". Storm Prediction Center. 2021-03-17. Retrieved 2021-03-22.
- ^ "SPC Severe Weather Event Review for Thursday March 25, 2021". www.spc.noaa.gov. Retrieved 17 November 2022.
- ^ "SPC Severe Weather Event Review for Thursday March 25, 2021". www.spc.noaa.gov. Retrieved 30 January 2023."IEM :: Valid Time Event Code (VTEC) App". Iowa Environmental Mesonet. Iowa State University. Retrieved March 25, 2021."IEM :: Valid Time Event Code (VTEC) App". Iowa Environmental Mesonet. Iowa State University. Retrieved March 25, 2021.
- ^ "SPC Severe Weather Event Review for Friday March 31, 2023". www.spc.noaa.gov. Retrieved 1 April 2023.
External links edit
- High Risk archive