


Summary
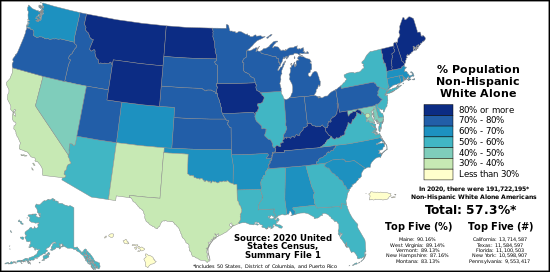
This is a list of U.S. states by Non-Hispanic whites population. The United States Census Bureau defines non-Hispanic white as white Americans who are not of Hispanic or Latino ancestry (i.e., having ancestry from Spain or Latin America).[1] At 191.6 million in 2020, non-Hispanic whites comprise 57.8% of the total U.S. population.[2][3]
Population by state or territory edit
| State/Territory | 1990 | 2000 | 2010 | 2020 | 2022 | Growth | |||||||
|---|---|---|---|---|---|---|---|---|---|---|---|---|---|
| Pop | % | Pop | % | Pop | % | Pop | % | Pop | % | %
growth 2020-2022 |
% growth 2010-2020 |
% pop 1980-2020 | |
| 2,960,167 | 73.3% | 3,125,819 | 70.3% | 3,204,402 | 67.0% | 3,171,351 | 63.1% | 3,162,748 | 62.6% | -0.50% | -1.0% | -11.0% | |
| 406,722 | 73.9% | 423,788 | 67.6% | 455,320 | 64.1% | 421,758 | 57.5% | 417,657 | 57.0% | -0.50% | -7.4% | -22.2% | |
| 2,626,185 | 71.7% | 3,274,258 | 63.8% | 3,695,647 | 57.8% | 3,816,547 | 53.4% | 3,861,732 | 52.1% | -1.30% | +3.3% | -25.5% | |
| 1,933,082 | 82.2% | 2,100,135 | 78.6% | 2,173,469 | 74.5% | 2,063,550 | 68.5% | 2,077,329 | 68.3% | -0.20% | -5.0% | -16.7% | |
| 17,029,126 | 57.2% | 15,816,790 | 46.7% | 14,956,253 | 40.1% | 13,714,587 | 34.7% | 13,446,253 | 34.5% | -0.20% | -8.3% | -39.3% | |
| 2,658,945 | 80.7% | 3,202,880 | 74.5% | 3,520,793 | 70.0% | 3,760,663 | 65.1% | 3,792,635 | 64.8% | -0.30% | +6.8% | -19.3% | |
| 2,754,184 | 83.8% | 2,638,845 | 77.5% | 2,546,262 | 71.2% | 2,279,232 | 63.2% | 2,217,154 | 61.4% | -1.80% | -10.5% | -24.6% | |
| 528,092 | 79.3% | 567,973 | 72.5% | 586,752 | 65.3% | 579,851 | 58.6% | 572,460 | 56.5% | -2.10% | -1.2% | -26.1% | |
| 166,131 | 27.4% | 159,178 | 27.8% | 209,464 | 34.8% | 261,771 | 38.0% | 268,437 | 40.8% | 2.80% | +25.0% | +38.7% | |
| 9,475,326 | 73.2% | 10,458,509 | 65.4% | 10,884,722 | 57.9% | 11,100,503 | 51.5% | 11,167,138 | 50.7% | -0.80% | +1.2% | -29.6% | |
| 4,543,425 | 70.1% | 5,128,661 | 62.6% | 5,413,920 | 55.9% | 5,362,156 | 50.1% | 5,377,762 | 49.6% | -0.50% | -1.0% | -28.5% | |
| 347,644 | 31.4% | 277,091 | 22.9% | 309,343 | 22.7% | 314,365 | 21.6% | 319,839 | 22.3% | 0.70% | +1.6% | -31.2% | |
| 928,661 | 92.2% | 1,139,291 | 88.0% | 1,316,243 | 84.0% | 1,450,523 | 78.9% | 1,495,555 | 75.5% | -3.40% | +10.2% | -11.4% | |
| 8,550,208 | 74.8% | 8,424,140 | 67.8% | 8,167,753 | 63.7% | 7,472,751 | 58.3% | 7,175,691 | 57.3% | -1.00% | -8.5% | -22.1% | |
| 4,965,242 | 89.6% | 5,219,373 | 85.8% | 5,286,453 | 81.5% | 5,121,004 | 75.5% | 5,139,704 | 75.2% | -0.30% | -0.4% | -15.7% | |
| 2,663,840 | 95.9% | 2,710,344 | 92.6% | 2,701,123 | 88.7% | 2,638,201 | 82.7% | 2,626,058 | 82.1% | -0.60% | -6.8% | -10.9% | |
| 2,190,524 | 88.4% | 2,233,997 | 83.1% | 2,230,539 | 78.2% | 2,122,575 | 72.2% | 2,105,149 | 71.9% | -0.30% | -4.9% | -18.3% | |
| 3,378,022 | 91.7% | 3,608,013 | 89.3% | 3,745,655 | 86.3% | 3,664,764 | 81.3% | 3,652,476 | 80.8% | -0.50% | -2.2% | -11.3% | |
| 2,776,022 | 65.8% | 2,794,391 | 62.5% | 2,734,884 | 60.3% | 2,596,702 | 55.8% | 2,556,237 | 55.8% | 0.00% | -5.1% | -15.2% | |
| 1,203,357 | 98.0% | 1,230,297 | 96.5% | 1,254,297 | 94.4% | 1,228,264 | 90.2% | 1,228,574 | 88.9% | -1.30% | -2.1% | -8.0% | |
| 3,326,109 | 69.6% | 3,286,547 | 62.1% | 3,157,958 | 54.7% | 2,913,782 | 47.2% | 2,879,994 | 46.8% | -0.40% | -7.7% | -32.2% | |
| 5,280,292 | 87.8% | 5,198,359 | 81.9% | 4,984,800 | 76.1% | 4,748,897 | 67.6% | 4,702,009 | 67.5% | -0.10% | -4.7% | -23.0% | |
| 7,649,951 | 82.3% | 7,806,691 | 78.6% | 7,569,939 | 76.6% | 7,295,651 | 72.4% | 7,228,631 | 72.0% | -0.40% | -3.6% | -12% | |
| 4,101,266 | 93.7% | 4,337,143 | 88.2% | 4,405,142 | 83.1% | 4,353,880 | 76.3% | 4,327,512 | 75.9% | -0.40% | -1.2% | -15.3% | |
| 1,624,198 | 63.1% | 1,727,908 | 60.7% | 1,722,287 | 58.0% | 1,639,077 | 55.4% | 1,621,178 | 55.1% | -0.30% | -4.8% | -12.2% | |
| 4,448,465 | 86.9% | 4,686,474 | 83.8% | 4,850,748 | 81.0% | 4,663,907 | 75.8% | 4,671,326 | 75.6% | -0.20% | -3.9% | -12.8% | |
| 733,878 | 91.8% | 807,823 | 89.5% | 868,628 | 87.8% | 901,318 | 83.1% | 917,601 | 81.5% | -1.60% | +3.8% | -9.5% | |
| 1,460,095 | 92.5% | 1,494,494 | 87.3% | 1,499,753 | 82.1% | 1,484,687 | 75.7% | 1,475,159 | 75.0% | -0.70% | -1.0% | -28.2% | |
| 946,357 | 78.7% | 1,303,001 | 65.2% | 1,462,081 | 54.1% | 1,425,952 | 45.9% | 1,430,696 | 44.7% | -1.20% | -3.5% | -41.7% | |
| 1,079,484 | 97.3% | 1,175,252 | 95.1% | 1,215,050 | 92.3% | 1,200,649 | 87.2% | 1,202,674 | 85.6% | -1.60% | -1.2% | -10.4% | |
| 5,718,966 | 74.0% | 5,557,209 | 66.0% | 5,214,878 | 59.3% | 4,816,381 | 51.8% | 4,781,393 | 51.7% | -0.10% | -7.6% | -30% | |
| 764,164 | 50.4% | 813,495 | 44.7% | 833,810 | 40.5% | 772,952 | 36.5% | 761,956 | 36.1% | -0.40% | -7.3% | -26.6% | |
| 12,460,189 | 69.3% | 11,760,981 | 62.0% | 11,304,247 | 58.3% | 10,598,907 | 52.5% | 10,156,798 | 52.3% | -0.20% | -6.4% | -24.2% | |
| 4,971,127 | 75.0% | 5,647,155 | 70.2% | 6,223,995 | 65.3% | 6,312,148 | 60.5% | 6,338,050 | 59.4% | -1.10% | +1.4% | -19.3 pp | |
| 601,592 | 94.2% | 589,149 | 91.7% | 598,007 | 88.9% | 636,160 | 81.7% | 640,133 | 83.1% | 1.40% | +6.4% | -13.1% | |
| 9,444,622 | 87.1% | 9,538,111 | 84.0% | 9,359,263 | 81.1% | 8,954,135 | 75.9% | 8,911,356 | 75.7% | -0.20% | -4.3% | -12.9% | |
| 2,547,588 | 81.0% | 2,556,368 | 74.1% | 2,575,381 | 68.7% | 2,407,188 | 60.8% | 2,409,199 | 59.9% | -0.90% | -6.5% | -25% | |
| 2,579,732 | 90.8% | 2,857,616 | 83.5% | 3,005,848 | 78.5% | 3,036,158 | 71.7% | 3,045,554 | 71.5% | -0.20% | +1.0% | -21.0% | |
| 10,422,058 | 87.7% | 10,322,455 | 84.1% | 10,094,652 | 79.5% | 9,553,417 | 73.5% | 9,489,507 | 73.5% | 0.00% | -5.4% | -16.2% | |
| 896,109 | 89.3% | 858,433 | 81.9% | 803,685 | 76.4% | 754,050 | 68.7% | 739,106 | 67.5% | -1.20% | -6.2% | -23.1% | |
| 2,390,056 | 68.5% | 2,652,291 | 66.1% | 2,962,740 | 64.1% | 3,178,552 | 62.1% | 3,201,893 | 60.9% | -1.20% | +7.3% | -9.3% | |
| 634,788 | 91.2% | 664,585 | 88.0% | 689,502 | 84.7% | 705,583 | 79.6% | 715,011 | 79.0% | -0.60% | +2.3% | -12.7% | |
| 4,027,631 | 82.6% | 4,505,930 | 79.2% | 4,800,782 | 75.6% | 4,900,246 | 70.9% | 4,943,259 | 70.0% | -0.90% | +2.1% | -14.2% | |
| 10,291,680 | 60.6% | 10,933,313 | 52.4% | 11,397,345 | 45.3% | 11,584,597 | 39.7% | 11,701,512 | 39.1% | -0.60% | +1.6% | -34.5% | |
| 1,571,254 | 91.2% | 1,904,265 | 85.3% | 2,221,719 | 80.4% | 2,465,355 | 75.4% | 2,490,133 | 72.7% | -2.70% | +11.0% | -17.3% | |
| 552,184 | 98.1% | 585,431 | 96.2% | 590,223 | 94.3% | 573,201 | 89.1% | 570,991 | 88.2% | -0.90% | -2.9% | -9.2% | |
| 4,701,650 | 76.0% | 4,965,637 | 70.2% | 5,186,450 | 64.8% | 5,058,363 | 58.6% | 5,064,240 | 58.5% | -0.10% | -2.5% | -29.9% | |
| 4,221,622 | 86.7% | 4,652,490 | 78.9% | 4,876,804 | 72.5% | 4,918,820 | 63.8% | 4,923,712 | 63.4% | -0.40% | +0.9% | -26.4% | |
| 1,718,896 | 95.8% | 1,709,966 | 94.6% | 1,726,256 | 93.2% | 1,598,834 | 89.1% | 1,575,231 | 88.8% | -0.30% | -7.4% | -7.0% | |
| 4,464,677 | 91.3% | 4,681,630 | 87.3% | 4,738,411 | 83.3% | 4,634,018 | 78.6% | 4,631,617 | 78.4% | -0.20% | -2.2% | -13.9% | |
| 412,711 | 91.0% | 438,799 | 88.9% | 483,874 | 85.9% | 469,664 | 81.4% | 470,040 | 80.8% | -0.60% | -2.9% | -10.5% | |
| – | – | 682 | 1.2% | 611 | 1.1% | ||||||||
| – | – | 10,666 | 6.9% | 11,001 | 6.9% | ||||||||
| – | – | 1,274 | 1.8% | 916 | 1.7% | ||||||||
| – | – | 33,966 | 0.9% | 26,946 | 0.7% | 24,548 | 0.8% | -8.9% | |||||
| – | – | 8,580 | 7.9% | 3,830 | 3.6% | ||||||||
| 188,128,296 | 75.6% | 194,552,774 | 69.1% | 196,817,552 | 63.7% | 191,697,647 | 57.8% | 190,678,059 | 57.6% | -0.20% | -2.6% | –23.5% | |
In 2020, in 36 out of the 50 US states, non-Latino whites made up a greater percentage of the state's population than the US overall share of 57.8%; however, the 14 states with greater shares of non-whites include the four most populous states (California, Texas, New York, and Florida). The total non-Latino white population shrunk between 2010 and 2020 in 34 out of the 50 states, and the relative share of non-Latino whites in the overall state population has declined in all 50 states during that same time period.
As of 2020, six states are majority-minority: Hawaii, California, New Mexico, Texas, Nevada, and Maryland. All of these states saw larger declines in the relative share of their non-Latino white populations between 1990-2020 than the national average of -23.5% with Nevada dropping by -41.7%, California by -39.3% and Texas by -34.5%.
Historical population by state or territory edit

| State/Territory | 1900 | 1910 | 1920 | 1930 | 1940 | 1950 | 1960 | 1970 | 1980 | 1990 | 2000 | 2010 | 2020 | |
|---|---|---|---|---|---|---|---|---|---|---|---|---|---|---|
| 54.7% | 57.5% | 61.6% | 64.3% | 65.3% | 67.9% | 69.9% | 73.3% | 73.3% | 73.3% | 70.3% | 67.0% | 65.1% | ||
| 48.3% | 77.2% | 77.2% | 75.8% | 73.9% | 67.6% | 64.1% | 59.6% | |||||||
| 65.1% | 74.3% | 74.5% | 71.7% | 63.8% | 57.8% | 53.8% | ||||||||
| 75.2% | 81.0% | 82.2% | 82.2% | 78.6% | 74.5% | 71.7% | ||||||||
| 89.5% | 76.3% | 66.6% | 57.2% | 46.7% | 40.1% | 35.9% | ||||||||
| 90.3% | 84.6% | 82.7% | 80.7% | 74.5% | 70.0% | 67.4% | ||||||||
| 97.9% | 91.4% | 88.0% | 83.8% | 77.5% | 71.2% | 65.3% | ||||||||
| 86.4% | 84.1% | 81.3% | 79.3% | 72.5% | 65.3% | 61.1% | ||||||||
| 71.4% | 26.5% | 25.7% | 27.4% | 27.8% | 34.8% | 37.7% | ||||||||
| 71.5% | 77.9% | 76.7% | 73.2% | 65.4% | 57.9% | 53.1% | ||||||||
| 65.2% | 73.4% | 71.6% | 70.1% | 62.6% | 55.9% | 51.6% | ||||||||
| 31.5% | 38.0% | 31.1% | 31.4% | 22.9% | 22.7% | 21.4% | ||||||||
| 98.4% | 95.9% | 93.9% | 92.2% | 88.0% | 84.0% | 81.4% | ||||||||
| 94.7% | 83.5% | 78.0% | 74.8% | 67.8% | 63.7% | 60.4% | ||||||||
| 96.3% | 91.7% | 90.2% | 89.6% | 85.8% | 81.5% | 78.0% | ||||||||
| 99.2% | 98.0% | 96.9% | 95.9% | 92.6% | 88.7% | 84.5% | ||||||||
| 95.6% | 92.7% | 90.5% | 88.4% | 83.1% | 78.2% | 75.1% | ||||||||
| 92.5% | 92.4% | 91.7% | 91.7% | 89.3% | 86.3% | 83.9% | ||||||||
| 63.7% | 68.2% | 67.6% | 65.8% | 62.5% | 60.3% | 58.1% | ||||||||
| 99.7% | 99.1% | 98.3% | 98.0% | 96.5% | 94.4% | 92.7% | ||||||||
| 83.3% | 80.4% | 73.9% | 69.6% | 62.1% | 54.7% | 49.5% | ||||||||
| 98.6% | 95.4% | 92.3% | 87.8% | 81.9% | 76.1% | 70.5% | ||||||||
| 95.7% | 87.1% | 84.1% | 82.3% | 78.6% | 76.6% | 74.5% | ||||||||
| 99.0% | 97.7% | 96.1% | 93.7% | 88.2% | 83.1% | 78.6% | ||||||||
| 50.6% | 62.6% | 63.6% | 63.1% | 60.7% | 58.0% | 56.3% | ||||||||
| 93.4% | 88.6% | 87.7% | 86.9% | 83.8% | 81.0% | 79.0% | ||||||||
| 96.2% | 94.7% | 93.4% | 91.8% | 89.5% | 87.8% | 85.7% | ||||||||
| 98.2% | 95.2% | 94.0% | 92.5% | 87.3% | 82.1% | 77.8% | ||||||||
| 91.6% | 86.7% | 83.2% | 78.7% | 65.2% | 54.1% | 47.4% | ||||||||
| 99.9% | 99.1% | 98.4% | 97.3% | 95.1% | 92.3% | 89.4% | ||||||||
| 94.3% | 84.7% | 79.1% | 74.0% | 66.0% | 59.3% | 54.1% | ||||||||
| 50.9% | 53.8% | 52.6% | 50.4% | 44.7% | 40.5% | 36.4% | ||||||||
| 94.6% | 80.1% | 75.0% | 69.3% | 62.0% | 58.3% | 55.0% | ||||||||
| 71.9% | 76.5% | 75.3% | 75.0% | 70.2% | 65.3% | 62.3% | ||||||||
| 98.3% | 96.9% | 95.5% | 94.2% | 91.7% | 88.9% | 83.3% | ||||||||
| 95.0% | 89.8% | 88.2% | 87.1% | 84.0% | 81.1% | 78.0% | ||||||||
| 89.9% | 88.1% | 85.0% | 81.0% | 74.1% | 68.7% | 64.4% | ||||||||
| 98.6% | 95.8% | 93.3% | 90.8% | 83.5% | 78.5% | |||||||||
| 95.1% | 90.3% | 89.1% | 87.7% | 84.1% | 79.5% | |||||||||
| 98.3% | 96.1% | 93.4% | 89.3% | 81.9% | 76.4% | |||||||||
| 57.1% | 69.0% | 68.3% | 68.5% | 66.1% | 64.1% | |||||||||
| 96.2% | 94.6% | 92.3% | 91.2% | 88.0% | 84.7% | |||||||||
| 82.5% | 83.7% | 83.1% | 82.6% | 79.2% | 75.6% | |||||||||
| 74.1% | 69.6% | 65.7% | 60.6% | 52.4% | 45.3% | |||||||||
| 98.2% | 93.6% | 92.4% | 91.2% | 85.3% | 80.4% | |||||||||
| 99.7% | 99.2% | 98.5% | 98.1% | 96.2% | 94.3% | 92.2% | ||||||||
| 75.3% | 80.1% | 78.2% | 76.0% | 70.2% | 64.8% | |||||||||
| 97.7% | 93.6% | 90.2% | 86.7% | 78.9% | 72.5% | |||||||||
| 93.7% | 95.7% | 95.6% | 95.8% | 94.6% | 93.2% | |||||||||
| 99.2% | 95.6% | 93.6% | 91.3% | 87.3% | 83.3% | |||||||||
| 95.9% | 92.1% | 92.0% | 91.0% | 88.9% | 85.9% | |||||||||
| 0.9% | 0.7% | |||||||||||||
| 88.4% | 83.5% | 79.6% | 75.6% | 69.1% | 63.7% |
See also edit
References edit
- ^ U.S. Census Bureau definition of race Archived January 4, 2011, at the Wayback Machine
- ^ Tavernise, Sabrina (17 May 2012). "Whites Account for Under Half of Births in U.S." The New York Times.
- ^ a b "2012 American Community Survey 1-Year Estimates". American FactFinder, U.S. Census Bureau. Archived from the original on 12 February 2020. Retrieved 23 March 2014.
- ^ 1980: Census of Population (PDF). Bureau of the Census. August 1982.
- ^ "Historical Census Statistics on Population Totals By Race, 1790 to 1990, and By Hispanic Origin, 1970 to 1990, For The United States, Regions, Divisions, and States". 2008-07-25. Archived from the original on 2008-07-25. Retrieved 2022-06-30.
- ^ "2010 Census". Census.gov. Retrieved 2017-08-19.
- ^ "Data". data.census.gov. Retrieved 2020-04-29.
- ^ "2020 Census Demographic Data Map Viewer". US Census Bureau. Retrieved 24 September 2021.
- ^ "Race and Ethnicity in the United States: 2010 Census and 2020 Census". US Census Bureau. Retrieved 24 September 2021.
- ^ "Historical Census Statistics on Population Totals By Race, 1790 to 1990, and By Hispanic Origin, 1970 to 1990, For The United States, Regions, Divisions, and States". Census.gov. Archived from the original on July 25, 2008. Retrieved September 15, 2012.
- ^ https://www.census.gov/prod/2001pubs/mso01-wp.pdf [bare URL PDF]
- ^ https://www.census.gov/prod/cen2010/briefs/c2010br-05.pdf [bare URL PDF]
- ^ "Alabama population by year, county, race, & more". September 2022.