


Summary
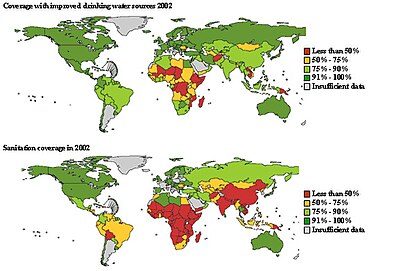
This is a list of countries by the proportion of their population using improved sanitation facilities includes access to toilets and safe drinking water.
Methods edit
Figures used in this chart are based on data compiled and uploaded by the World Bank in May 2013 through their World Development Indicators initiative.[1] The information was provided by the respective governments of the listed countries. As the compiled figures are not collected with the same methodology and with different levels of rigor, there are limitations in their reliability in forming comparisons.
Sanitation as defined by the World Health Organization:
"Sanitation generally refers to the provision of facilities and services for the safe disposal of human urine and feces. Inadequate sanitation is a major cause of disease world-wide and improving sanitation is known to have a significant beneficial impact on health both in households and across communities. The word 'sanitation' also refers to the maintenance of hygienic conditions, through services such as garbage collection and wastewater disposal.[2]
The United Nations states that improved sanitation facilities "ensure hygienic separation of human excreta from human contact."[3] They include in their definition:
The Joint Monitoring Programme for Water Supply and Sanitation of WHO and UNICEF has defined improved sanitation as follows:
- Flush toilet[4]
- Connection to a piped sewer system[5]
- Connection to a septic system[6]
- Flush / pour-flush to a pit latrine[7]
- Ventilated improved pit (VIP) latrine[8]
- Pit latrine with slab[9]
- Composting toilet[10]
- Some special cases[11]
The World Bank states:[12]
"Access to improved sanitation facilities refers to the percentage of the population with at least adequate access to excreta disposal facilities that can effectively prevent human, animal, and insect contact with excreta. Improved facilities range from simple but protected pit latrines to flush toilets with a sewerage connection. To be effective, facilities must be correctly constructed and properly maintained."
Countries edit
The following Table is based on The World Bank basic sanitation DataBank.[13]
| Country | 2000 | 2005 | 2010 | 2015 | 2020 |
|---|---|---|---|---|---|
| Afghanistan | 22 | 27 | 35 | 43 | 50 |
| Albania | 89 | 92 | 95 | 98 | 99 |
| Algeria | 84 | 86 | 87 | 87 | 86 |
| American Samoa | 65 | 65 | 63 | 57 | 54 |
| Andorra | 100 | 100 | 100 | 100 | 100 |
| Angola | 28 | 35 | 41 | 47 | 52 |
| Antigua and Barbuda | 82 | 84 | 86 | 88 | |
| Argentina | 87 | 90 | 93 | 95 | |
| Armenia | 87 | 89 | 91 | 93 | 94 |
| Aruba | 98 | 98 | 98 | 98 | |
| Australia | 100 | 100 | 100 | 100 | 100 |
| Austria | 100 | 100 | 100 | 100 | 100 |
| Azerbaijan | 62 | 72 | 85 | 96 | |
| Bahamas | 88 | 90 | 93 | 95 | |
| Bahrain | 100 | 100 | 100 | 100 | 100 |
| Bangladesh | 24 | 31 | 39 | 47 | 54 |
| Barbados | 89 | 91 | 94 | 96 | 98 |
| Belarus | 92 | 93 | 95 | 98 | 98 |
| Belgium | 99 | 99 | 99 | 99 | 99 |
| Belize | 82 | 84 | 86 | 87 | 88 |
| Benin | 9 | 11 | 13 | 15 | 17 |
| Bermuda | 100 | 100 | 100 | 100 | 100 |
| Bhutan | 47 | 55 | 63 | 70 | 77 |
| Bolivia | 35 | 40 | 48 | 57 | 66 |
| Bosnia and Herzegovina | 95 | 95 | 95 | 95 | |
| Botswana | 52 | 59 | 67 | 75 | 80 |
| Brazil | 73 | 78 | 82 | 86 | 90 |
| British Virgin Islands | 97 | 97 | 97 | 97 | |
| Bulgaria | 86 | 86 | 86 | 86 | 86 |
| Burkina Faso | 11 | 14 | 17 | 20 | 22 |
| Burundi | 45 | 46 | 46 | 46 | 46 |
| Cabo Verde | 40 | 50 | 61 | 70 | 79 |
| Cambodia | 10 | 23 | 38 | 53 | 69 |
| Cameroon | 38 | 39 | 41 | 43 | 45 |
| Canada | 100 | 100 | 100 | 99 | 99 |
| Cayman Islands | 84 | 84 | 84 | ||
| Central African Republic | 21 | 20 | 18 | 16 | 14 |
| Chad | 10 | 10 | 10 | 11 | 12 |
| Chile | 92 | 95 | 97 | 99 | 100 |
| China | 57 | 66 | 76 | 84 | 92 |
| Colombia | 75 | 80 | 84 | 89 | 94 |
| Comoros | 29 | 33 | 34 | 36 | |
| Congo, Dem. Rep. | 24 | 22 | 20 | 17 | 15 |
| Congo, Rep. | 12 | 14 | 16 | 19 | 20 |
| Costa Rica | 94 | 95 | 96 | 97 | 98 |
| Côte d'Ivoire | 21 | 23 | 27 | 31 | 35 |
| Croatia | 96 | 96 | 96 | 96 | 97 |
| Cuba | 88 | 88 | 89 | 90 | 91 |
| Curaçao | 98 | 98 | 99 | 99 | |
| Cyprus | 100 | 100 | 100 | 99 | 99 |
| Czech Republic | 99 | 99 | 99 | 99 | 99 |
| Denmark | 100 | 100 | 100 | 100 | 100 |
| Djibouti | 47 | 48 | 55 | 61 | 67 |
| Dominica | 64 | 70 | 77 | 80 | |
| Dominican Republic | 77 | 80 | 82 | 85 | 87 |
| Ecuador | 69 | 74 | 80 | 86 | 92 |
| Egypt, Arab Rep. | 91 | 93 | 94 | 96 | 97 |
| El Salvador | 83 | 84 | 83 | 83 | 82 |
| Equatorial Guinea | 55 | 60 | 64 | 66 | |
| Eritrea | 8 | 10 | 11 | 12 | |
| Estonia | 100 | 100 | 99 | 99 | 99 |
| Eswatini | 48 | 52 | 56 | 61 | 64 |
| Ethiopia | 3 | 4 | 6 | 7 | 9 |
| Fiji | 80 | 83 | 89 | 96 | 99 |
| Finland | 99 | 99 | 99 | 99 | 99 |
| France | 99 | 99 | 99 | 99 | 99 |
| French Polynesia | 98 | 98 | 98 | 97 | 97 |
| Gabon | 34 | 39 | 44 | 49 | 50 |
| Gambia, The | 51 | 46 | 46 | 46 | 47 |
| Georgia | 91 | 89 | 88 | 87 | 86 |
| Germany | 99 | 99 | 99 | 99 | 99 |
| Ghana | 7 | 11 | 15 | 19 | 24 |
| Gibraltar | 100 | 100 | 100 | 100 | 100 |
| Greece | 98 | 98 | 99 | 99 | 99 |
| Greenland | 100 | 100 | 100 | 100 | 100 |
| Grenada | 90 | 91 | 92 | 91 | |
| Guam | 89 | 89 | 90 | 90 | |
| Guatemala | 62 | 64 | 65 | 67 | 68 |
| Guinea | 9 | 13 | 18 | 24 | 30 |
| Guinea-Bissau | 5 | 8 | 11 | 14 | 18 |
| Guyana | 79 | 81 | 83 | 85 | 86 |
| Haiti | 17 | 22 | 27 | 33 | 37 |
| Honduras | 63 | 69 | 74 | 79 | 84 |
| Hong Kong SAR, China | 97 | 97 | 97 | 97 | 97 |
| Hungary | 98 | 98 | 98 | 98 | 98 |
| Iceland | 99 | 99 | 99 | 99 | 99 |
| India | 15 | 28 | 42 | 57 | 71 |
| Indonesia | 38 | 49 | 61 | 74 | 86 |
| Iran, Islamic Rep. | 78 | 82 | 85 | 88 | 90 |
| Iraq | 70 | 74 | 83 | 93 | 100 |
| Ireland | 90 | 90 | 91 | 91 | 91 |
| Israel | 100 | 100 | 100 | 100 | 100 |
| Italy | 100 | 100 | 100 | 100 | 100 |
| Jamaica | 83 | 84 | 85 | 86 | 87 |
| Japan | 100 | 100 | 100 | 100 | 100 |
| Jordan | 99 | 98 | 98 | 97 | 97 |
| Kazakhstan | 97 | 97 | 97 | 98 | 98 |
| Kenya | 31 | 31 | 32 | 32 | 33 |
| Kiribati | 32 | 37 | 41 | 43 | 46 |
| Korea, Dem. People's Rep. | 75 | 78 | 82 | 85 | |
| Korea, Rep. | 100 | 100 | 100 | 100 | 100 |
| Kuwait | 100 | 100 | 100 | 100 | 100 |
| Kyrgyz Republic | 92 | 93 | 95 | 97 | 98 |
| Lao PDR | 28 | 43 | 56 | 70 | 79 |
| Latvia | 88 | 89 | 90 | 92 | 92 |
| Lebanon | 77 | 81 | 87 | 94 | 99 |
| Lesotho | 8 | 20 | 30 | 41 | 50 |
| Liberia | 13 | 15 | 16 | 17 | 18 |
| Libya | 90 | 91 | 91 | 92 | 92 |
| Liechtenstein | 100 | 100 | 100 | 100 | 100 |
| Lithuania | 84 | 87 | 90 | 92 | 94 |
| Luxembourg | 98 | 98 | 98 | 98 | 98 |
| Macao SAR, China | 100 | 100 | 100 | 100 | 100 |
| Madagascar | 4 | 6 | 8 | 10 | 12 |
| Malawi | 21 | 22 | 24 | 25 | 27 |
| Malaysia | 97 | 98 | 99 | 100 | |
| Maldives | 75 | 82 | 88 | 94 | 99 |
| Mali | 16 | 22 | 29 | 37 | 45 |
| Malta | 100 | 100 | 100 | 100 | 100 |
| Marshall Islands | 80 | 82 | 83 | 84 | |
| Mauritania | 17 | 23 | 32 | 43 | 50 |
| Mauritius | 90 | 92 | 94 | 96 | |
| Mexico | 77 | 81 | 85 | 89 | 92 |
| Micronesia, Fed. Sts. | 25 | 46 | 67 | 88 | |
| Moldova | 74 | 75 | 75 | 76 | 79 |
| Monaco | 100 | 100 | 100 | 100 | 100 |
| Mongolia | 45 | 50 | 56 | 62 | 68 |
| Montenegro | 93 | 96 | 98 | ||
| Morocco | 68 | 73 | 78 | 83 | 87 |
| Mozambique | 9 | 15 | 22 | 29 | 37 |
| Myanmar | 63 | 66 | 69 | 71 | 74 |
| Namibia | 28 | 30 | 32 | 34 | 35 |
| Nauru | 66 | 66 | 66 | 66 | |
| Nepal | 14 | 27 | 42 | 59 | 77 |
| Netherlands | 98 | 98 | 98 | 98 | 98 |
| New Caledonia | 100 | 100 | 100 | 100 | 100 |
| New Zealand | 100 | 100 | 100 | 100 | 100 |
| Nicaragua | 57 | 62 | 67 | 72 | 73 |
| Niger | 5 | 8 | 10 | 13 | 15 |
| Nigeria | 29 | 31 | 34 | 38 | 43 |
| North Macedonia | 89 | 89 | 92 | 95 | 98 |
| Northern Mariana Islands | 75 | 76 | 77 | 78 | 79 |
| Norway | 98 | 98 | 98 | 98 | 98 |
| Oman | 89 | 92 | 96 | 99 | 99 |
| Pakistan | 30 | 40 | 50 | 59 | 68 |
| Palau | 91 | 94 | 97 | 99 | 100 |
| Panama | 62 | 67 | 73 | 79 | 85 |
| Papua New Guinea | 18 | 18 | 19 | 19 | 19 |
| Paraguay | 70 | 77 | 82 | 88 | 93 |
| Peru | 63 | 68 | 71 | 75 | 79 |
| Philippines | 61 | 63 | 69 | 75 | 82 |
| Poland | 89 | 92 | 95 | 99 | 100 |
| Portugal | 97 | 98 | 99 | 99 | 100 |
| Puerto Rico | 98 | 99 | 99 | 100 | 100 |
| Qatar | 100 | 100 | 100 | 100 | 100 |
| Romania | 75 | 79 | 83 | 87 | |
| Russian Federation | 84 | 86 | 87 | 88 | 89 |
| Rwanda | 45 | 52 | 58 | 64 | 69 |
| Samoa | 94 | 95 | 95 | 96 | 97 |
| San Marino | 100 | 100 | 100 | 100 | 100 |
| São Tomé and Príncipe | 20 | 27 | 34 | 41 | 48 |
| Saudi Arabia | 98 | 99 | 99 | 100 | 100 |
| Senegal | 37 | 42 | 47 | 52 | 57 |
| Serbia | 95 | 96 | 97 | 97 | 98 |
| Seychelles | 94 | 96 | 98 | 100 | 100 |
| Sierra Leone | 10 | 12 | 13 | 15 | 17 |
| Singapore | 100 | 100 | 100 | 100 | 100 |
| Sint Maarten (Dutch part) | 98 | 99 | 99 | 99 | |
| Slovak Republic | 100 | 99 | 98 | 98 | 98 |
| Slovenia | 98 | 98 | 98 | 98 | 98 |
| Small states | 61 | 63 | 68 | 71 | 72 |
| Solomon Islands | 20 | 22 | 27 | 32 | 35 |
| Somalia | 20 | 24 | 29 | 34 | 39 |
| South Africa | 59 | 64 | 69 | 74 | 78 |
| South Sudan | 11 | 16 | |||
| Spain | 100 | 100 | 100 | 100 | 100 |
| Sri Lanka | 77 | 81 | 86 | 91 | 94 |
| St. Kitts and Nevis | 86 | 90 | 93 | 95 | |
| St. Lucia | 85 | 85 | 84 | 83 | 83 |
| St. Martin (French part) | 99 | 99 | 99 | 100 | 100 |
| St. Vincent and the Grenadines | 71 | 77 | 83 | 87 | |
| Sudan | 21 | 22 | 28 | 35 | 37 |
| Suriname | 78 | 80 | 83 | 86 | 90 |
| Sweden | 99 | 99 | 99 | 99 | 99 |
| Switzerland | 100 | 100 | 100 | 100 | 100 |
| Syrian Arab Republic | 90 | 91 | 91 | 90 | 90 |
| Tajikistan | 90 | 92 | 93 | 95 | 97 |
| Tanzania | 5 | 12 | 19 | 26 | 32 |
| Thailand | 92 | 94 | 95 | 97 | 99 |
| Timor-Leste | 40 | 46 | 51 | 57 | |
| Togo | 10 | 11 | 13 | 16 | 19 |
| Tonga | 89 | 90 | 93 | 93 | 93 |
| Trinidad and Tobago | 90 | 91 | 93 | 94 | 94 |
| Tunisia | 77 | 82 | 87 | 92 | 97 |
| Turkey | 87 | 90 | 93 | 96 | 99 |
| Turkmenistan | 93 | 94 | 95 | 97 | 99 |
| Turks and Caicos Islands | 81 | 83 | 86 | 88 | |
| Tuvalu | 80 | 83 | 84 | ||
| Uganda | 17 | 18 | 18 | 19 | 20 |
| Ukraine | 94 | 95 | 96 | 97 | 98 |
| United Arab Emirates | 97 | 98 | 99 | 99 | |
| United Kingdom | 99 | 99 | 99 | 99 | 99 |
| United States | 100 | 100 | 100 | 100 | 100 |
| Uruguay | 93 | 94 | 95 | 97 | 98 |
| Uzbekistan | 93 | 96 | 99 | 100 | 100 |
| Vanuatu | 56 | 56 | 55 | 53 | 53 |
| Venezuela, RB | 93 | 94 | 95 | 96 | |
| Vietnam | 52 | 62 | 71 | 81 | 89 |
| Virgin Islands (U.S.) | 99 | 99 | 99 | 99 | 99 |
| West Bank and Gaza | 90 | 91 | 94 | 96 | 99 |
| Yemen, Rep. | 45 | 48 | 50 | 52 | 54 |
| Zambia | 22 | 25 | 27 | 30 | 32 |
| Zimbabwe | 45 | 44 | 41 | 38 | 35 |
See also edit
References edit
- ^ "People using safely managed sanitation services (% of population) | Data". data.worldbank.org. Retrieved 2021-11-26.
- ^ who.int
- ^ "UNICEF WCARO - Overview | Aperçu - Access to water and sanitation: A few definitions". Archived from the original on 2013-12-27. Retrieved 2014-05-22.
- ^ WHO and UNICEF types of improved drinking-water source on the JMP website, WHO, Geneva and UNICEF, New York, accessed on June 10, 2012
- ^ WHO and UNICEF "WHO / UNICEF Joint Monitoring Programme: Wat/San categories". Archived from the original on 2015-10-03. Retrieved 2015-10-13., ibid.
- ^ WHO and UNICEF "WHO / UNICEF Joint Monitoring Programme: Wat/San categories". Archived from the original on 2015-10-03. Retrieved 2015-10-13., ibid.
- ^ WHO and UNICEF "WHO / UNICEF Joint Monitoring Programme: Wat/San categories". Archived from the original on 2015-10-03. Retrieved 2015-10-13., ibid.
- ^ WHO and UNICEF "WHO / UNICEF Joint Monitoring Programme: Wat/San categories". Archived from the original on 2015-10-03. Retrieved 2015-10-13., ibid.
- ^ WHO and UNICEF "WHO / UNICEF Joint Monitoring Programme: Wat/San categories". Archived from the original on 2015-10-03. Retrieved 2015-10-13., ibid.
- ^ WHO and UNICEF "WHO / UNICEF Joint Monitoring Programme: Wat/San categories". Archived from the original on 2015-10-03. Retrieved 2015-10-13., ibid.
- ^ WHO and UNICEF "WHO / UNICEF Joint Monitoring Programme: Wat/San categories". Archived from the original on 2015-10-03. Retrieved 2015-10-13., ibid.
- ^ "People using safely managed sanitation services (% of population) | Data".
- ^ "People using at least basic sanitation services (% of population) | Data". data.worldbank.org. Retrieved 2022-05-08.