


Summary
This is a list of women who have been elected as members of Parliament (MPs) to the House of Commons of the United Kingdom.
1918 to 1935 edit


1935 to 1950 edit


1950 to 1965 edit


1965 to 1983 edit


1983 to 1997 edit


1997 to 2010 edit


2010 to present edit


Proportion of women edit
Numbers and proportions are as they were directly after the relevant election and do not take into account by-elections, defections, or other changes in membership. Instead, women who were initially by-elected to their seats and later successful in holding them at a subsequent general election are counted as having won the latter to serve full terms, if completed. Parties whose MPs have taken or took the whip from one of the major parties (Labour and Co-operative for the Labour Party and historically Ulster Unionist before 1974, Unionist in Scotland until 1965, or National Liberal from 1950 to 1968 for the Conservative Party) have been included in the Conservatives' or Labour's totals.
| Election | Conservative | Labour | Liberal to 1988, then Lib Dems |
Others | Total | ||||||||||
|---|---|---|---|---|---|---|---|---|---|---|---|---|---|---|---|
| Women | Total | % | Women | Total | % | Women | Total | % | Women | Total | % | Women | Total | % | |
| 1918[192] | 0 | 382 | 0.0% | 0 | 57 | 0.0% | 0 | 36 | 0.0% | 1 | 232 | 0.4% | 1 | 707 | 0.1% |
| 1922[192] | 1 | 344 | 0.3% | 0 | 142 | 0.0% | 1 | 62 | 1.6% | 0 | 67 | 0.0% | 2 | 615 | 0.3% |
| 1923[192] | 3 | 258 | 1.2% | 3 | 191 | 1.6% | 2 | 158 | 1.3% | 0 | 7 | 0.0% | 8 | 615 | 1.3% |
| 1924[192] | 3 | 412 | 0.7% | 1 | 151 | 0.7% | 0 | 40 | 0.0% | 0 | 12 | 0.0% | 4 | 615 | 0.7% |
| 1929[192] | 3 | 260 | 1.2% | 9 | 287 | 3.1% | 1 | 59 | 1.7% | 1 | 9 | 11.1% | 14 | 615 | 2.3% |
| 1931[192] | 13 | 470 | 2.8% | 0 | 52 | 0.0% | 0 | 33 | 0.0% | 2 | 60 | 3.3% | 15 | 615 | 2.4% |
| 1935[192] | 6 | 386 | 1.6% | 1 | 154 | 0.6% | 1 | 21 | 4.8% | 1 | 54 | 1.9% | 9 | 615 | 1.5% |
| 1945[192] | 1 | 197 | 0.5% | 21 | 393 | 5.3% | 1 | 12 | 8.3% | 1 | 38 | 2.6% | 24 | 640 | 3.8% |
| 1950[192] | 6 | 298 | 2.0% | 14 | 315 | 4.4% | 1 | 9 | 11.1% | 0 | 2 | 0.0% | 21 | 625 | 3.4% |
| 1951[192] | 6 | 321 | 1.9% | 11 | 295 | 3.7% | 0 | 6 | 0.0% | 0 | 3 | 0.0% | 17 | 625 | 2.7% |
| 1955[192] | 10 | 345 | 2.9% | 14 | 277 | 5.1% | 0 | 6 | 0.0% | 0 | 2 | 0.0% | 24 | 630 | 3.8% |
| 1959[192] | 12 | 365 | 3.3% | 13 | 258 | 5.0% | 0 | 6 | 0% | 0 | 1 | 0.0% | 25 | 630 | 4.0% |
| 1964[192] | 11 | 304 | 3.6% | 18 | 317 | 5.7% | 0 | 9 | 0.0% | 0 | 0 | 0.0% | 29 | 630 | 4.6% |
| 1966[192] | 7 | 253 | 2.8% | 19 | 364 | 5.2% | 0 | 12 | 0.0% | 0 | 1 | 0.0% | 26 | 630 | 4.1% |
| 1970[192] | 15 | 330 | 4.5% | 10 | 288 | 3.5% | 0 | 6 | 0.0% | 1 | 6 | 16.7% | 26 | 630 | 4.1% |
| 1974 (F)[192] | 9 | 297 | 3.0% | 13 | 301 | 4.3% | 0 | 14 | 0.0% | 1 | 7 | 14.3% | 23 | 635 | 3.6% |
| 1974 (O)[192] | 7 | 277 | 2.5% | 18 | 319 | 5.6% | 0 | 13 | 0.0% | 2 | 26 | 7.7% | 27 | 635 | 4.3% |
| 1979[192] | 8 | 339 | 2.4% | 11 | 269 | 4.1% | 0 | 11 | 0.0% | 0 | 16 | 0.0% | 19 | 635 | 3.0% |
| 1983[192] | 13 | 397 | 3.3% | 10 | 209 | 4.8% | 0 | 23 | 0.0% | 0 | 21 | 0.0% | 23 | 650 | 3.5% |
| 1987[192] | 17 | 376 | 4.5% | 21 | 229 | 9.2% | 1 | 21 | 4.8% | 2 | 24 | 8.3% | 41 | 650 | 6.3% |
| 1992[192] | 20 | 336 | 6.0% | 37 | 271 | 13.7% | 2 | 20 | 10.0% | 1 | 24 | 4.2% | 60 | 651 | 9.2% |
| 1997[192] | 13 | 165 | 7.9% | 101 | 418 | 24.2% | 3 | 46 | 6.5% | 3 | 30 | 10.0% | 120 | 659 | 18.2% |
| 2001[192] | 14 | 166 | 8.4% | 95 | 413 | 23.0% | 5 | 52 | 9.6% | 4 | 24 | 16.7% | 118 | 659 | 17.9% |
| 2005[192] | 17 | 198 | 8.6% | 98 | 355 | 27.6% | 10 | 62 | 16.1% | 3 | 31 | 9.7% | 128 | 646 | 19.8% |
| 2010[193] | 49 | 306 | 16.0% | 81 | 258 | 31.4% | 7 | 57 | 12.3% | 6 | 29 | 20.7% | 143 | 650 | 22.0% |
| 2015[193] | 68 | 330 | 20.6% | 99 | 232 | 42.7% | 0 | 8 | 0.0% | 24 | 80 | 30.0% | 191 | 650 | 29.4% |
| 2017[194] | 67 | 317 | 21.1% | 119 | 262 | 45.4% | 4 | 12 | 33.3% | 18 | 59 | 30.5% | 208 | 650 | 32.0% |
| 2019[195] | 87 | 365 | 23.8% | 104 | 202 | 51.5% | 7 | 11 | 63.6% | 22 | 71 | 31.0% | 220 | 650 | 33.8% |
See also edit
- All-women shortlists
- Election results of women in United Kingdom general elections (1918–1945)
- List of female members of the House of Lords
- List of female political office-holders in the United Kingdom
- Parliament (Qualification of Women) Act 1918
- Records of members of parliament of the United Kingdom § Women
- Timeline of female MPs in the House of Commons of the United Kingdom
- Widow's succession
- Women in the House of Commons of the United Kingdom
Notes and references edit
- ^ CH. Succeeded her husband Waldorf Astor, 2nd Viscount Astor as MP after he became a member of the House of Lords due to inheriting the title of Viscount Astor upon the death of his father.
- ^ Succeeded her husband Thomas Wintringham following his death.
- ^ Succeeded her husband Hilton Philipson after his election to Parliament was overturned by petition.
- ^ DBE. Wife of John Stewart-Murray, 8th Duke of Atholl.
- ^ Wife of Harold Woodhouse, 2nd Baron Terrington.
- ^ Chris Wrigley, A.J.P. Taylor: Radical Historian of Europe (2006), p. 116.
- ^ Succeeded her husband Rupert Guinness, 2nd Earl of Iveagh as MP after he became a member of the House of Lords due to inheriting the title of Earl of Iveagh upon the death of his father.
- ^ Was succeeded by her husband Walter Runciman as MP. In 1937 he became a member of the House of Lords after being raised to the peerage as Viscount Runciman of Doxford, so she became Viscountess Runciman of Doxford.
- ^ Was succeeded by her husband Hugh Dalton, who was an MP from a neighbouring constituency. In 1960 he became a member of the House of Lords after being raised to the peerage as Baron Dalton, of Forest and Frith in the County Palatine of Durham.
- ^ First elected as an Independent Labour Party member. Married to fellow MP Aneurin Bevan. She was made a life peer as Baroness Lee of Asheridge, of the City of Westminster in 1970.
- ^ "No. 45229". The London Gazette. 10 November 1970. p. 12333.
- ^ CH. Youngest child of David Lloyd George, Prime Minister of the United Kingdom 1916-1922. She was re-elected in 1931 on a Liberal label in opposition to the National Government.
- ^ Wife of fellow MP Sir Oswald Mosley, who created the New Party and British Union of Fascists. Daughter of George Curzon, 1st Marquess Curzon of Kedleston.
- ^ a b c d e f g h i OBE.
- ^ Daughter of William Rathbone VI. Aunt of fellow MP John Rathbone, whose wife Beatrice Wright succeeded him.
- ^ Succeeded her husband Noel Noel-Buxton, 1st Baron Noel-Buxton as MP after he became a member of the House of Lords after being raised to the peerage as Baron Noel-Buxton.
- ^ In 1966 she was appointed as a DBE becoming Dame Leah Manning.
- ^ MBE.
- ^ CBE. Sister of fellow MP Victor Cazalet.
- ^ Wife of Richard Ronald John Copeland.
- ^ GBE. She was made a life peer as Baroness Horsbrugh, of Horsbrugh in the County of Peebles, in 1959.
- ^ Daughter of William Pickford, 1st Baron Sterndale.
- ^ CH, DBE. She was made a life peer as Baroness Ward of North Tyneside, of North Tyneside in the County of Tyne and Wear, in 1975.
- ^ DBE. Succeeded her husband J. C. C. Davidson, 1st Viscount Davidson as MP after he became a member of the House of Lords after being raised to the peerage as Viscount Davidson. Daughter of Willoughby Dickinson, 1st Baron Dickinson. In 1963 she was created a life peer as Baroness Northchurch, of Chiswick in the County of Middlesex.
- ^ Succeeded her husband George Hardie as MP after his death. Sister in law of fellow MP and founder of the Labour Party Keir Hardie.
- ^ She resigned as an MP and was made a life peer as Baroness Summerskill, of Kenwood in the County of London. In 1966 she was made a CH. She was the mother of Shirley Summerskill.
- ^ Succeeded her husband John Rathbone as MP after he was killed at the Battle of Britain. Her husbands aunt was fellow MP Eleanor Rathbone. Her second husband Sir Paul Wright was knighted in 1975, so she was styled Lady Wright. In 1996 she was made an MBE.
- ^ Succeeded her husband Allen Bathurst, Lord Apsley as MP after he was killed in battle. In 1952 she was made a CBE.
- ^ Wife of Gerald Gould and daughter of Hertha Marks Ayrton and William Edward Ayrton.
- ^ CBE. She was made a life peer as Baroness Bacon, of the City of Leeds and of Normanton in the West Riding of the County of York, in 1970.
- ^ Wife of Edward Castle, Baron Castle. She was made a life peer as Baroness Castle of Blackburn, in 1990. From 1979–1989, she served as Member of the European Parliament for Greater Manchester.
- ^ In 1953 she was appointed as a CBE.
- ^ Wife of James Middleton.
- ^ Daughter of R. C. Wallhead.
- ^ Wife of fellow MP John Paton.
- ^ Wife of John Buchan, 2nd Baron Tweedsmuir. She was made a life peer as Baroness Tweedsmuir of Belhelvie, of Potterton in the County of Aberdeen, in 1970.
- ^ She was made a life peer as Baroness Burton of Coventry, of Coventry in the County of Warwick, in 1962.
- ^ DBE. She was made a life peer as Baroness Hornsby-Smith, of Chislehurst in the County of Kent, in 1974.
- ^ In 1975 she was appointed as a DBE becoming Dame Dorothy Rees.
- ^ She was made a life peer as Baroness White, of Rhymney in the County of Monmouth, in 1970.
- ^ Daughter of Walter Smiles. Wife of Neville Montagu Ford and later fellow MP Sir Nigel Fisher. Mother-in-law of Sir Michael Grylls. Grandmother of Bear Grylls. Step-mother of Mark Fisher.
- ^ She was made a life peer as Baroness Jeger, of St Pancras in Greater London, in 1979.
- ^ a b c d e f g h i j k l m n o p q r s t DBE.
- ^ a b c d e CBE.
- ^ She resigned as an MP to be made a life peer as Baroness Emmet of Amberley, of Amberley in the County of Sussex, in 1965. Daughter of Rennell Rodd, 1st Baron Rennell.
- ^ In 1965 she was appointed as an OBE.
- ^ She was made a life peer as Baroness Vickers, of Devonport in the County of Devon in 1975.
- ^ She was made a life peer as Baroness Pike, of Melton in the County of Leicestershire, in 1974. In 1981 she was made a DBE.
- ^ Succeeded her husband Sir David Gammans, 1st Baronet following his death.
- ^ In 1968 she was appointed as a CBE.
- ^ OBE TD. She was made a life peer as Baroness Skrimshire of Quarter, of Dunipace in the District of Falkirk, in 1979.
- ^ DBE. She was made a life peer as Baroness Hart of South Lanark, in 1988.
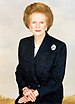
- ^ OM. First female Prime Minister of the United Kingdom. She was made a life peer as Baroness Thatcher, of Kesteven in the County of Lincolnshire, in 1992. In 1995 she was made a KG.
- ^ Wife of fellow MP Russell Kerr.
- ^ Former Wife of fellow MP John Ryman. Daughter of Edith Summerskill.
- ^ She was made a life peer as Baroness Williams of Crosby, of Stevenage in the County of Hertfordshire, in 1993.
- ^ DBE. She was made a life peer as Baroness Knight of Collingtree, of Collingtree in the County of Northamptonshire, in 1997.
- ^ She was made a life peer as Baroness Lestor of Eccles, of Tooting Bec in the London Borough of Wandsworth, in 1997.
- ^ Daughter of Morgan Phillips & Norah Phillips, Baroness Phillips. Mother of Tamsin Dunwoody.
- ^ Later served as a Member of the European Parliament and Scottish Parliament. Mother of Fergus Ewing and Annabelle Ewing. Mother-in-law of Margaret Ewing.
- ^ She was made a life peer as Baroness Fisher of Rednal, of Rednal, in the City of Birmingham, in 1974.
- ^ DBE. She was made a life peer as Baroness Fookes, of Plymouth in the County of Devon, in 1997.
- ^ DBE. Wife of fellow MEP Edward Kellett-Bowman. From 1975 to 1984, she served as the Member of the European Parliament for Cumbria.
- ^ She was made a life peer as Baroness Oppenheim-Barnes, of Gloucester in the County of Gloucestershire, in 1989. Mother of fellow MP Phillip Oppenheim.
- ^ She was made a life peer as Baroness Boothroyd, of Sandwell in the County of West Midlands, in 2001. In 2005 she was appointed as an OM.
- ^ Later the wife of fellow MP Jim Sillars.
- ^ She was made a life peer as Baroness Chalker of Wallasey, of Leigh-on-Sea in the County of Essex, in 1992.
- ^ DBE and GBE.
- ^ Later elected to the Scottish Parliament. Wife of fellow MSP Fergus Ewing. Daughter-in-law of Winnie Ewing. Sister-in-law of Annabelle Ewing.
- ^ She was made a life peer as Baroness Hayman, of Dartmouth Park in the London Borough of Camden, in 1996. In 2012 she was appointed as a GBE.
- ^ She was made a life peer as Baroness Taylor of Bolton, in the County of Greater Manchester, in 2005.
- ^ In 1998 she was appointed as a CBE.
- ^ From 1984 to 1989, she served as the Member of the European Parliament for Cumbria and Lancashire North.
- ^ a b c QC.
- ^ Succeeded her husband Frank McElhone following his death.
- ^ Wife of fellow MP Alex Lyon.
- ^ Wife of fellow MP Sir Nicholas Winterton.
- ^ She was made a life peer as Baroness Bottomley of Nettlestone, of St Helens in the County of Isle of Wight, in 2005. Wife of fellow MP Sir Peter Bottomley. Aunt-in-law of Kitty Ussher. Stepdaughter of Dame Julia Cleverdon.
- ^ Succeeded her husband John Golding following his resignation. She was made a life peer as Baroness Golding, of Newcastle-under-Lyme in the County of Staffordshire, in 2001. Daughter of Ness Edwards.
- ^ In 2011 she was appointed as an OBE.
- ^ She was made a life peer as Baroness Armstrong of Hill Top, of Crook in the County of Durham, in 2010. Daughter of Ernest Armstrong.
- ^ She was made a life peer as Baroness Michie of Gallanach, of Oban in Argyll and Bute, in 2001. Daughter of John Bannerman, Baron Bannerman of Kildonan.
- ^ She was made a life peer as Baroness Nicholson of Winterbourne, of Winterbourne, in the Royal County of Berkshire, in 1997. From 1999 to 2009, she served as a Member of the European Parliament for South East England. Daughter of Sir Godfrey Nicholson, 1st Baronet.
- ^ Rejoined the Conservatives as a life peer in 2016.
- ^ She was made a life peer as Baroness Primarolo, of Windmill Hill, in the City of Bristol, in 2015. DBE.
- ^ She was made a life peer as Baroness Quin, of Gateshead in the County of Tyne and Wear, in 2005. From 1979–1989, she served as Member of the European Parliament for Tyne South and Wear & Tyne and Wear.
- ^ Later married fellow MP Frank Doran.
- ^ She was made a life peer as Baroness Shephard of Northwold, in the County of Norfolk, in 2005.
- ^ From 2019 to 2020, she served as a Brexit Party Member of the European Parliament for South West England.
- ^ She was made a life peer as Baroness Hoey, of Lylehill and Rathlin in the County of Antrim in 2020.
- ^ Succeeded her husband Allen Adams following his death. She was made a life peer as Baroness Adams of Craigielea, of Craigielea in Renfrewshire, in 2005.
- ^ Sister of fellow MP Ann Keen and sister-in-law of fellow MP Alan Keen.
- ^ She was made a life peer as Baroness Browning, of Whimple in the County of Devon, in 2010.
- ^ OBE. Ex-wife of Robert Walpole, 10th Baron Walpole. Mother of Alice Walpole, Ambassador of the United Kingdom to Luxembourg.
- ^ She was made a life peer as Baroness Corston, of St George in the County and City of Bristol, in 2005. Wife of Peter Townsend.
- ^ Twin sister of fellow MP Maria Eagle.
- ^ CBE. During her film career, she won two Academy Awards for Best Actress: for Women in Love (1970) and A Touch of Class (1973).
- ^ In 2012 she was appointed as a CBE.
- ^ She was made a life peer as Baroness Jowell, of Brixton in the London Borough of Lambeth, in 2015. DBE. Ex-wife of Sir Roger Jowell & David Mills.
- ^ In 2012 she was elected as the first Police and Crime Commissioner for Merseyside.
- ^ In 2006 she was appointed as a CBE.
- ^ From 1999 to 2012, she served as a Member of the European Parliament for the West Midlands.
- ^ Daughter of Patrick Maitland, 17th Earl of Lauderdale.
- ^ She was made a life peer as Baroness Morris of Yardley, of Yardley in the County of West Midlands, in 2005. Daughter of Charles Morris and niece of Alf Morris, Baron Morris of Manchester.
- ^ Wife, later ex-wife, of fellow MP Gordon Prentice.
- ^ She was made a life peer as Baroness Maddock, of Christchurch in the County of Dorset, in 1997. Wife of fellow MP Sir Alan Beith.
- ^ DBE. Wife of Sir Henry Hodge.
- ^ She was made a life peer as Baroness Liddell of Coatdyke, of Airdrie in the County of Lanarkshire, in 2010. Served as British High Commissioner to Australia from 2005 to 2009.
- ^ a b Later elected to the Scottish Parliament.
- ^ Made a DBE in 2011.
- ^ She was made a life peer as Baroness Clark of Calton, of Calton in the City of Edinburgh, in 2005. Served as Senator of the College of Justice (2006–2019).
- ^ Wife of fellow MP Ed Balls.
- ^ Widow of Bob Cryer MP, and mother of fellow MP John Cryer.
- ^ Twin sister of fellow MP Angela Eagle.
- ^ Wife of Ken Follett.
- ^ She was made a life peer as Baroness Hughes of Stretford, of Ellesmere Port in the County of Cheshire, in 2010.
- ^ Daughter of Sir Curtis Keeble.
- ^ Wife of fellow MP Alan Keen and sister of fellow MP Sylvia Heal.
- ^ She was made a life peer as Baroness King of Bow, of Bow in the London Borough of Tower Hamlets, in 2011. Niece of Miriam Stoppard and Sir Tom Stoppard, and cousin of Ed Stoppard.
- ^ Wife of fellow MP Andrew MacKay. Former domestic partner of Stephen Milligan.
- ^ Daughter of Sir Ian Mactaggart, 3rd Baronet. Granddaughter of Sir Herbert Williams, 1st Baronet.
- ^ DBE. Sister of Margaret McDonagh, Baroness McDonagh.
- ^ Made a DBE in 2015.
- ^ She was made a life peer as Baroness McIntosh, of Pickering in the County of North Yorkshire, in 2015. From 1989-1999, she served as a Member of the European Parliament for Essex North East and Essex North and Suffolk South.
- ^ She was made a life peer as Baroness Merron, of Lincoln in the County of Lincolnshire in 2021.
- ^ Elected to the Senedd, then known as the Welsh Assembly in 2011. Wife of fellow MP Rhodri Morgan.
- ^ She was made a life peer as Baroness Smith of Basildon, in the County of Essex, in 2010.
- ^ She was made a life peer as Baroness Stuart, of Edgbaston in the County of West Midlands in 2020.
- ^ Daughter of Dan Jones.
- ^ She was made a life peer as Baroness Tonge, of Kew in the London Borough of Richmond upon Thames, in 2005.
- ^ DBE, QC. In 2012 she was elected as the Police and Crime Commissioner for Northumbria.
- ^ Daughter of Winnie Ewing. Sister of fellow MSP Fergus Ewing and sister-in-law to Margaret Ewing. Was elected as a MSP for Mid Scotland and Fife.
- ^ From 1998 to 2012, she served as a Member of the Northern Ireland Assembly for Fermanagh and South Tyrone.
- ^ Wife of Sir John Hermon.
- ^ Wife of fellow MP Peter Robinson. Served at the same time as a Member of the Northern Ireland Assembly for Strangford (1998–2010).
- ^ She was made a life peer as Baroness Burt, of Solihull in the County of West Midlands, in 2015.
- ^ Later elected to the Scottish Parliament. She was made a life peer as Baroness Clark, of Kilwinning in the County of Ayrshire in 2020.
- ^ She was made a life peer as Baroness Featherstone, of Highgate in the London Borough of Haringey, in 2015.
- ^ From 2000 to 2004, she served as the London Assembly member for North East. DBE.
- ^ She was made a life peer as Baroness Kramer, of Richmond Park in the London Borough of Richmond upon Thames, in 2010.
- ^ Wife of fellow MP Nick Raynsford. Daughter of Michael Ward.
- ^ Wife of fellow MP Duncan Hames.
- ^ Daughter of Cedric Thornberry. Wife of Sir Christopher Nugee.
- ^ Niece of fellow MP Sir Peter Bottomley and niece-in-law of Virginia Bottomley, Baroness Bottomley of Nettlestone.
- ^ From 1999 to 2005, she served as the Member of the European Parliament for London.
- ^ Grandniece of Manny Shinwell, Baron Shinwell.
- ^ She was made a life peer as Baroness Blackwood, of North Oxford in the County of Oxfordshire in 2019.
- ^ From 2000 to 2008, she served as the London Assembly member for West Central. She was made a life peer as Baroness Bray, of Coln St. Aldwyns in the County of Gloucestershire in 2022.
- ^ She was made a life peer as Baroness Chapman, of Darlington in the County of Durham in 2021.
- ^ From 1999 to 2011, she served as the Member of the Scottish Parliament for Glasgow Baillieston.
- ^ DBE. Wife of fellow MP Mark Lancaster. Daughter of Fred Dinenage.
- ^ She was made a life peer as Baroness Fullbrook, of Dogmersfield in the County of Hampshire in 2020.
- ^ From 1999 to 2011, she served as the Member of the Scottish Parliament for Carrick, Cumnock and Doon Valley.
- ^ From 2003 to 2010, she served as a Member of the Northern Ireland Assembly for Belfast East.
- ^ From 1999 to 2010, she served as a Member of the European Parliament for South East England.
- ^ She was made a life peer as Baroness Morgan, of Cotes in the County of Leicestershire in 2020.
- ^ Daughter of Roy Perry.
- ^ Wife of Nicholas Joicey, sister of Ellie Reeves and sister-in-law of fellow MP John Cryer.
- ^ From 2003 to 2012, she served as a Member of the Northern Ireland Assembly for South Down. She was made a life peer as Baroness Ritchie of Downpatrick, of Downpatrick in the County of Down in 2019.
- ^ Former wife of A. A. Gill.
- ^ Daughter of Duncan Sandys, Baron Duncan-Sandys.
- ^ Youngest female Prime Minister of the United Kingdom.
- ^ Sister of Keith Vaz.
- ^ Wife of John Abrahams.
- ^ Daughter of Sir Robert Atkins.
- ^ From 2012 to 2015, she served as the Deputy Mayor of London and from 2008 to 2016, she served as the London Assembly member for the Conservative Party (London-wide). Wife of James Borwick, 5th Baron Borwick.
- ^ She was made a life peer as Baroness Hayman, of Ullock in the County of Cumbria in 2020.
- ^ Sister of Konnie Huq.
- ^ From 2009 to 2011, she served as the Member of the Scottish Parliament for Glasgow.
- ^ Daughter of Tim Boswell, Baron Boswell.
- ^ From 2011 to 2015, she served as the Member of the Welsh National Assembly for North Wales.
- ^ Daughter of Sheikh Rehana. Niece of Sheikh Hasina. Granddaughter of Sheikh Mujibur Rahman.
- ^ She was made a life peer as Baroness Anderson, of Stoke-on-Trent in the County of Staffordshire in 2022.
- ^ Succeeded her husband Harry Harpham as MP after he died.
- ^ From 2015 to 2017, she served as the London Assembly member for the Conservative Party (London-wide).
- ^ From 2014 to 2017, she served as the Member of the European Parliament for South East England.
- ^ From 2009 to 2017, she served as the Member of the European Parliament for the East of England.
- ^ Wife of fellow MP John Cryer, sister of MP Rachel Reeves and sister-in-law of Nicholas Joicey.
- ^ Elected to the Senedd in 2021.
- ^ Daughter of Judith Blake, Baroness Blake of Leeds.
- ^ Daughter of Sir Charles Mansfield Tobias Clarke, the 6th Baronet of Dunham Lodge. Sister of Sir Charles Lawrence Somerset Clarke, 7th Baronet. Niece-in-law of Jacob and Annunziata Rees-Mogg.
- ^ Wife of former MP Charlie Elphicke.
- ^ From 2016 to 2021, she was also the London Assembly member for Lambeth and Southwark.
- ^ Daughter of Michael McNair-Wilson. Niece of Patrick McNair-Wilson.
- ^ From 2015 to 2019, she served as a Member of the Northern Ireland Assembly for Belfast South.
- ^ Daughter of Kelvin Hopkins. Granddaughter of Harold Hopkins.
- ^ Daughter of Gwilym Jones.
- ^ Ex-wife of former MP Andrew Griffiths.
- ^ From 2016 to 2019, she served as a Member of the Northern Ireland Assembly for Upper Bann.
- ^ In 2016 she was made an MBE.
- ^ Sister of Jo Cox.
- ^ a b c d e f g h i j k l m n o p q r s t u v w x Audickas, Lukas; Loft, Philip; Cracknell, Richard (7 September 2021). "UK Election Statistics: 1918–2019 - A century of elections". parliament.uk. p. 26.
- ^ a b "General Election 2015: women MPs and candidates". parliament.uk. 9 May 2015.
- ^ "Election 2017: Record number of female MPs". BBC News. 10 June 2017.
- ^ "UK elects record number of female MPs". The Guardian. 13 December 2019.