


Summary
The ceremonial county of Dorset (which comprises the two unitary authorities of Dorset and Bournemouth, Christchurch and Poole) is divided into 8 parliamentary constituencies: 3 borough constituencies and 5 county constituencies.
Constituencies edit
† Conservative ‡ Labour ¤ Liberal Democrat
| Constituency[nb 1] | Electorate[1] | Majority[2][nb 2] | Member of Parliament[2] | Nearest opposition[2] | Map | ||
|---|---|---|---|---|---|---|---|
| Bournemouth East BC | 74,125 | 8,806 | Tobias Ellwood† | Corrie Drew‡ | 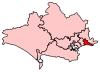 | ||
| Bournemouth West BC | 74,205 | 10,150 | Conor Burns† | David Stokes‡ | 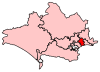 | ||
| Christchurch CC | 71,520 | 24,617 | Christopher Chope† | Mike Cox¤ | 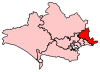 | ||
| Mid Dorset and North Poole CC | 65,427 | 14,898 | Michael Tomlinson† | Vikki Slade¤ |  | ||
| North Dorset CC | 76,765 | 24,301 | Simon Hoare† | David Chadwick¤ | 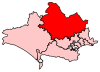 | ||
| Poole BC | 73,989 | 19,116 | Robert Syms† | Sue Aitkenhead‡ | 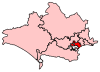 | ||
| South Dorset CC | 73,809 | 17,153 | Richard Drax† | Carralyn Parkes‡ | 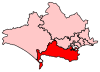 | ||
| West Dorset CC | 81,897 | 14,106 | Chris Loder† | Edward Morello¤ | 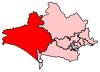 | ||
2010 boundary changes edit
Under the Fifth Periodic Review of Westminster constituencies, the Boundary Commission for England decided to retain Dorset's constituencies for the 2010 election, making minor changes to realign constituency boundaries with the boundaries of current local government wards, and to reduce the electoral disparity between constituencies.
| Name | Boundaries 1997-2010 | Boundaries 2010–present |
|---|---|---|
 |
 |
Proposed boundary changes edit
See 2023 Periodic Review of Westminster constituencies for further details.
Following the abandonment of the Sixth Periodic Review (the 2018 review), the Boundary Commission for England formally launched the 2023 Review on 5 January 2021.[3] Initial proposals were published on 8 June 2021 and, following two periods of public consultation, revised proposals were published on 8 November 2022. The final recommendations were published on 28 June 2023.
The commission has proposed retaining the eight current constituencies in Dorset, with minor boundary changes to reflect changes to ward boundaries following the reorganisation of local government authorities within the county.[4]
Containing electoral wards from Bournemouth, Christchurch and Poole
Containing electoral wards from Dorset (unitary authority)
Results history edit
Primary data source: House of Commons research briefing - General election results from 1918 to 2019[5]
2019 edit
The number of votes cast for each political party who fielded candidates in constituencies comprising Dorset in the 2019 general election were as follows:
| Party | Votes | % | Change from 2017 | Seats | Change from 2017 |
|---|---|---|---|---|---|
| Conservative | 241,835 | 58.3% | 8 | 0 | |
| Liberal Democrats | 78,414 | 18.9% | 0 | 0 | |
| Labour | 76,310 | 18.4% | 0 | 0 | |
| Greens | 16,020 | 3.9% | 0 | 0 | |
| Others | 2,094 | 0.5% | 0 | 0 | |
| Total | 414,673 | 100.0 | 8 |
Percentage votes edit
Note that before 1983 Dorset did not include the Bournemouth and Christchurch areas (see below).
| Election year | 1922 | 1923 | 1924 | 1929 | 1931 | 1935 | 1945 | 1950 | 1951 | 1955 | 1959 | 1964 | 1966 | 1970 | 1974(F) | 1974(O) | 1979 | 1983 | 1987 | 1992 | 1997 | 2001 | 2005 | 2010 | 2015 | 2017 | 2019 |
|---|---|---|---|---|---|---|---|---|---|---|---|---|---|---|---|---|---|---|---|---|---|---|---|---|---|---|---|
| Conservative | 39.1 | 51.7 | 60.1 | 46.2 | 56.8 | 54.0 | 45.2 | 47.6 | 52.2 | 53.9 | 52.4 | 46.6 | 47.3 | 54.2 | 48.1 | 48.0 | 58.4 | 58.6 | 57.8 | 54.5 | 41.8 | 45.3 | 44.1 | 48.3 | 51.7 | 58.7 | 58.3 |
| Labour | 21.4 | 19.4 | 18.0 | 17.0 | 12.3 | 16.0 | 30.8 | 37.9 | 32.0 | 32.6 | 28.7 | 29.8 | 32.5 | 28.8 | 21.0 | 23.6 | 20.4 | 10.2 | 11.3 | 13.4 | 18.8 | 21.1 | 18.3 | 12.2 | 13.0 | 25.2 | 18.4 |
| Liberal Democrat1 | 18.0 | 28.9 | 21.9 | 36.8 | 16.3 | 28.7 | 24.0 | 14.5 | 15.8 | 13.6 | 18.9 | 23.6 | 20.2 | 17.0 | 30.9 | 28.4 | 20.9 | 29.7 | 30.8 | 31.2 | 34.1 | 31.5 | 32.8 | 32.8 | 12.9 | 12.8 | 18.9 |
| Green Party | - | - | - | - | - | - | - | - | - | - | - | - | - | - | - | - | - | - | * | * | * | * | * | 0.5 | 5.3 | 2.6 | 3.9 |
| UKIP | - | - | - | - | - | - | - | - | - | - | - | - | - | - | - | - | - | - | - | - | * | * | * | 5.6 | 16.2 | 0.3 | * |
| Other | 21.5 | - | - | - | 14.6 | 1.4 | - | - | - | - | - | - | - | - | - | - | 0.3 | 1.4 | 0.1 | 0.9 | 5.3 | 2.1 | 4.7 | 0.6 | 0.9 | 0.4 | 0.5 |
11950-1979: Liberal Party; 1983 & 1987 - SDP-Liberal Alliance
* Included in Other
Accurate vote percentages are not applicable for the 1918 election because one candidate stood unopposed.
Seats edit
| Election year | 1950-1979 | 1983-1992 | 1997 | 2001-2005 | 2010 | 2015-2019 |
|---|---|---|---|---|---|---|
| Conservative | 4 | 7 | 8 | 6 | 7 | 8 |
| Labour | 0 | 0 | 0 | 1 | 0 | 0 |
| Liberal Democrat1 | 0 | 0 | 0 | 1 | 1 | 0 |
| Total | 4 | 7 | 8 | 8 | 8 | 8 |
11950-1979: Liberal Party; 1983 & 1987 - SDP-Liberal Alliance
Maps edit
1885-1910 edit
-
 1885
1885 -
 1886
1886 -
 1892
1892 -
1895
-
1900
-
1906
-
 Jan 1910
 -
Dec 1910


1918-1945 edit
-
 1918
1918 -
 1922
1922 -
 1923
1923 -
 1924
1924 -
 1929
1929 -
1931
-
1935
-
1945
1950-1979 edit
-
 1950
1950 -
1951
-
1955
-
1959
-
1964
-
1966
-
1970
-
Feb 1974
-
Oct 1974
-
1979

1983-present edit
-
 1983
1983 -
1987
-
1992
-
 1997
1997 -
 2001
2001 -
2005
-
 2010
2010 -
 2015
2015 -
2017
-
2019


Historical representation by party edit
A cell marked → (with a different colour background to the preceding cell) indicates that the previous MP continued to sit under a new party name.
Before 1885 edit
| Constituency | Established | Abolished |
|---|---|---|
| Bridport | 1295 | Redistribution of Seats Act 1885 |
| Corfe Castle | 1572 | Parliamentary Boundaries Act 1832 |
| Dorchester | 1295 | Redistribution of Seats Act 1885 |
| Dorset | 1290 | Redistribution of Seats Act 1885 |
| Lyme Regis | 1572 | Parliamentary Boundaries Act 1832 |
| Poole | 1362 | Redistribution of Seats Act 1885 |
| Shaftesbury | 1295 | Redistribution of Seats Act 1885 |
| Weymouth and Melcombe Regis | 1572 | Redistribution of Seats Act 1885 |
| Wareham | 1302 | Redistribution of Seats Act 1885 |
1885 to 1950 edit
Coalition Liberal (1918-22) / National Liberal (1922-23) Conservative Independent Conservative Liberal
| Constituency | 1885 | 1886 | 91 | 1892 | 95 | 1895 | 1900 | 04 | 05 | 1906 | Jan 10 | Dec 10 | 1918 | 1922 | 23 | 1923 | 1924 | 1929 | 1931 | 1935 | 37 | 41 | 1945 |
|---|---|---|---|---|---|---|---|---|---|---|---|---|---|---|---|---|---|---|---|---|---|---|---|
| Dorset East | Glyn | Bond | Napier Sturt | Lyell | H. Guest1 | F. Guest | → | Caine | → | Glassey | Caine | Wheatley | |||||||||||
| Dorset North | Portman | Wingfield-Digby | Wills | Baker | Colfox | Emlyn-Jones | Hanbury | A. Hambro | Byers | ||||||||||||||
| Dorset South | Sturgis | C. Hambro | Brymer | Scarisbrick | A. Hambro | Yerburgh | Gascoyne-Cecil | Montagu | |||||||||||||||
| Dorset West | Farquharson | Williams | Colfox | Digby | |||||||||||||||||||
1original candidate, F. Guest (Lib), disqualified; fresh by-election held June 1910
1950 to 1983 edit
| Constituency | 1950 | 1951 | 1955 | 57 | 1959 | 62 | 1964 | 1966 | 1970 | Feb 1974 | Oct 1974 | 1979 |
|---|---|---|---|---|---|---|---|---|---|---|---|---|
| Dorset North | Crouch | Glyn | James | Baker | ||||||||
| Dorset South | Montagu | Barnett | King | Gascoyne-Cecil | ||||||||
| Dorset West | Digby | Spicer | ||||||||||
| Poole | Wheatley | Pilkington | Murton | Ward | ||||||||
1983 to present (7, then 8 MPs) edit
Conservative Independent Labour Liberal Democrats
| Constituency | 1983 | 1987 | 1992 | 93 | 1997 | 2001 | 2005 | 2010 | 2015 | 2017 | 19 | 2019 |
|---|---|---|---|---|---|---|---|---|---|---|---|---|
| Bournemouth East | Atkinson | Ellwood | ||||||||||
| Bournemouth West | Butterfill | Burns | ||||||||||
| Christchurch | Adley | Maddock | Chope | |||||||||
| Mid Dorset and North Poole | Fraser | Brooke | Tomlinson | |||||||||
| North Dorset | Baker | Walter | Hoare | |||||||||
| Poole | Ward | Syms | ||||||||||
| South Dorset | Gascoyne-Cecil | Bruce | Knight | Drax | ||||||||
| West Dorset | Spicer | Letwin | → | Loder | ||||||||
See also edit
Notes edit
References edit
- ^ Baker, Carl; Uberoi, Elise; Cracknell, Richard (28 January 2020). "General Election 2019: full results and analysis".
{{cite journal}}: Cite journal requires|journal=(help) - ^ a b c "Constituencies A-Z - Election 2019". BBC News. Retrieved 25 April 2020.
- ^ "2023 Review | Boundary Commission for England". boundarycommissionforengland.independent.gov.uk. Retrieved 6 October 2021.
- ^ "The 2023 Review of Parliamentary Constituency Boundaries in England – Volume one: Report | Boundary Commission for England". boundarycommissionforengland.independent.gov.uk. paras 1179-1203. Retrieved 10 July 2023.
- ^ Watson, Christopher; Uberoi, Elise; Loft, Philip (17 April 2020). "General election results from 1918 to 2019".
{{cite journal}}: Cite journal requires|journal=(help)
Template:Dorset constituencies