


Summary
Lleida (Spanish: Lérida) is one of the 52 constituencies (Spanish: circunscripciones) represented in the Congress of Deputies, the lower chamber of the Spanish parliament, the Cortes Generales. The constituency currently elects four deputies. Its boundaries correspond to those of the Spanish province of Lleida. The electoral system uses the D'Hondt method and a closed-list proportional representation, with a minimum threshold of three percent.
| Lleida | |
|---|---|
| Congress of Deputies Electoral constituency | |
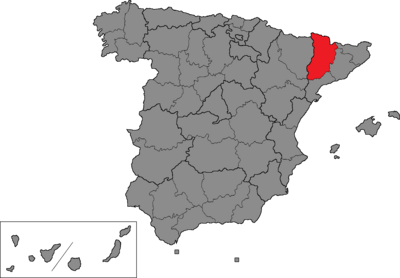 Location of Lleida within Spain | |
| Province | Lleida |
| Autonomous community | Catalonia |
| Population | |
| Electorate | |
| Major settlements | Lleida |
| Current constituency | |
| Created | 1977 |
| Seats | 4 |
| Member(s) | |
Electoral system edit
The constituency was created as per the Political Reform Act 1977 and was first contested in the 1977 general election. The Act provided for the provinces of Spain to be established as multi-member districts in the Congress of Deputies,[2] with this regulation being maintained under the Spanish Constitution of 1978. Additionally, the Constitution requires for any modification of the provincial limits to be approved under an organic law, needing an absolute majority in the Cortes Generales.[3]
Voting is on the basis of universal suffrage, which comprises all nationals over eighteen and in full enjoyment of their political rights. The only exception was in 1977, when this was limited to nationals over twenty-one and in full enjoyment of their political and civil rights. Amendments to the electoral law in 2011 required for Spaniards abroad to apply for voting before being permitted to vote, a system known as "begged" or expat vote (Spanish: Voto rogado).[4] 348 seats are elected using the D'Hondt method and a closed list proportional representation, with an electoral threshold of three percent of valid votes—which includes blank ballots—being applied in each constituency. Each provincial constituency is entitled to an initial minimum of two seats, with the remaining 248 being distributed in proportion to their populations. Ceuta and Melilla are allocated the two remaining seats, which are elected using plurality voting.[3][5][6] The use of the D'Hondt method may result in a higher effective threshold, depending on the district magnitude.[7]
The electoral law allows for parties and federations registered in the interior ministry, coalitions and groupings of electors to present lists of candidates. Parties and federations intending to form a coalition ahead of an election are required to inform the relevant Electoral Commission within ten days of the election call—fifteen before 1985—whereas groupings of electors need to secure the signature of at least one percent of the electorate in the constituencies for which they seek election—one-thousandth of the electorate, with a compulsory minimum of 500 signatures, until 1985—disallowing electors from signing for more than one list of candidates. Also since 2011, parties, federations or coalitions that have not obtained a mandate in either chamber of the Cortes at the preceding election are required to secure the signature of at least 0.1 percent of electors in the aforementioned constituencies.[5][6]
Deputies edit
| Deputies 1977–present | ||||||
|---|---|---|---|---|---|---|
| Legislature | Election | Distribution | ||||
| Constituent | 1977 |
| ||||
| 1st | 1979 |
| ||||
| 2nd | 1982 |
| ||||
| 3rd | 1986 |
| ||||
| 4th | 1989 |
| ||||
| 5th | 1993 |
| ||||
| 6th | 1996 |
| ||||
| 7th | 2000 |
| ||||
| 8th | 2004 |
| ||||
| 9th | 2008 |
| ||||
| 10th | 2011 |
| ||||
| 11th | 2015 |
| ||||
| 12th | 2016 |
| ||||
| 13th | 2019 (Apr) |
| ||||
| 14th | 2019 (Nov) |
| ||||
| 15th | 2023 |
| ||||
Elections edit
2023 general election edit
| Parties and alliances | Popular vote | Seats | ||||
|---|---|---|---|---|---|---|
| Votes | % | ±pp | Total | +/− | ||
| Socialists' Party of Catalonia (PSC–PSOE) | 54,414 | 29.49 | +15.03 | 2 | +1 | |
| Republican Left of Catalonia (ERC) | 34,331 | 18.60 | –12.86 | 1 | –1 | |
| Together for Catalonia (Junts)1 | 33,228 | 18.01 | n/a | 1 | +1 | |
| People's Party (PP) | 23,699 | 12.84 | +5.75 | 0 | ±0 | |
| Unite–In Common We Can (Sumar–ECP)2 | 14,561 | 7.89 | +0.01 | 0 | ±0 | |
| Vox (Vox) | 12,560 | 6.81 | +2.32 | 0 | ±0 | |
| Popular Unity Candidacy–For Rupture (CUP–PR) | 5,449 | 2.95 | –3.85 | 0 | ±0 | |
| Catalan European Democratic Party–CiU Space (PDeCAT–E–CiU)1 | 1,865 | 1.01 | n/a | 0 | –1 | |
| Animalist Party with the Environment (PACMA)3 | 1,352 | 0.73 | ±0.00 | 0 | ±0 | |
| Blank Seats to Leave Empty Seats (EB) | 462 | 0.25 | New | 0 | ±0 | |
| Workers' Front (FO) | 247 | 0.13 | New | 0 | ±0 | |
| Communist Party of the Workers of Catalonia (PCTC) | 192 | 0.10 | +0.04 | 0 | ±0 | |
| Zero Cuts (Recortes Cero) | 120 | 0.07 | –0.02 | 0 | ±0 | |
| Blank ballots | 2,059 | 1.12 | +0.38 | |||
| Total | 184,539 | 4 | ±0 | |||
| Valid votes | 184,539 | 98.72 | –0.62 | |||
| Invalid votes | 2,390 | 1.28 | +0.62 | |||
| Votes cast / turnout | 186,929 | 58.93 | –7.45 | |||
| Abstentions | 130,296 | 41.07 | +7.45 | |||
| Registered voters | 317,225 | |||||
| Sources[8] | ||||||
Footnotes:
| ||||||
November 2019 general election edit
| Parties and alliances | Popular vote | Seats | ||||
|---|---|---|---|---|---|---|
| Votes | % | ±pp | Total | +/− | ||
| Republican Left of Catalonia–Sovereigntists (ERC–Sobiranistes) | 65,236 | 31.46 | –2.11 | 2 | ±0 | |
| Together for Catalonia–Together (JxCat–Junts) | 46,773 | 22.56 | +1.83 | 1 | ±0 | |
| Socialists' Party of Catalonia (PSC–PSOE) | 29,983 | 14.46 | –2.22 | 1 | ±0 | |
| In Common We Can–Let's Win the Change (ECP–Guanyem el Canvi) | 16,337 | 7.88 | –0.42 | 0 | ±0 | |
| People's Party (PP) | 14,697 | 7.09 | +2.15 | 0 | ±0 | |
| Popular Unity Candidacy–For Rupture (CUP–PR) | 14,098 | 6.80 | New | 0 | ±0 | |
| Vox (Vox) | 9,312 | 4.49 | +1.83 | 0 | ±0 | |
| Citizens–Party of the Citizenry (Cs) | 7,128 | 3.44 | –5.05 | 0 | ±0 | |
| Animalist Party Against Mistreatment of Animals (PACMA) | 1,521 | 0.73 | –0.20 | 0 | ±0 | |
| Zero Cuts–Green Group (Recortes Cero–GV) | 183 | 0.09 | ±0.00 | 0 | ±0 | |
| For a Fairer World (PUM+J) | 169 | 0.08 | +0.02 | 0 | ±0 | |
| Communist Party of the Catalan People (PCPC) | 129 | 0.06 | –0.03 | 0 | ±0 | |
| Communist Party of the Workers of Catalonia (PCTC) | 126 | 0.06 | New | 0 | ±0 | |
| Left in Positive (IZQP) | 124 | 0.06 | ±0.00 | 0 | ±0 | |
| Blank ballots | 1,540 | 0.74 | +0.08 | |||
| Total | 207,356 | 4 | ±0 | |||
| Valid votes | 207,356 | 99.34 | –0.05 | |||
| Invalid votes | 1,375 | 0.66 | +0.05 | |||
| Votes cast / turnout | 208,731 | 66.38 | –5.80 | |||
| Abstentions | 105,694 | 33.62 | +5.80 | |||
| Registered voters | 314,425 | |||||
| Sources[9] | ||||||
April 2019 general election edit
| Parties and alliances | Popular vote | Seats | ||||
|---|---|---|---|---|---|---|
| Votes | % | ±pp | Total | +/− | ||
| Republican Left of Catalonia–Sovereigntists (ERC–Sobiranistes) | 75,760 | 33.57 | +8.44 | 2 | +1 | |
| Together for Catalonia–Together (JxCat–Junts)1 | 46,781 | 20.73 | –1.89 | 1 | ±0 | |
| Socialists' Party of Catalonia (PSC–PSOE) | 37,637 | 16.68 | +4.24 | 1 | +1 | |
| Citizens–Party of the Citizenry (Cs) | 19,150 | 8.49 | +1.54 | 0 | ±0 | |
| In Common We Can–Let's Win the Change (ECP–Guanyem el Canvi) | 18,723 | 8.30 | –8.36 | 0 | –1 | |
| People's Party (PP) | 11,153 | 4.94 | –8.59 | 0 | –1 | |
| Free People–We Are Alternative–Pirates: Republican Front (Front Republicà) | 6,194 | 2.74 | New | 0 | ±0 | |
| Vox (Vox) | 6,005 | 2.66 | +2.55 | 0 | ±0 | |
| Animalist Party Against Mistreatment of Animals (PACMA) | 2,089 | 0.93 | –0.14 | 0 | ±0 | |
| Communist Party of the Catalan People (PCPC) | 205 | 0.09 | –0.06 | 0 | ±0 | |
| Zero Cuts–Green Group (Recortes Cero–GV) | 204 | 0.09 | –0.07 | 0 | ±0 | |
| Left in Positive (IZQP) | 138 | 0.06 | New | 0 | ±0 | |
| For a Fairer World (PUM+J) | 137 | 0.06 | New | 0 | ±0 | |
| Blank ballots | 1,479 | 0.66 | –0.53 | |||
| Total | 225,655 | 4 | ±0 | |||
| Valid votes | 225,655 | 99.39 | +0.35 | |||
| Invalid votes | 1,391 | 0.61 | –0.35 | |||
| Votes cast / turnout | 227,046 | 72.18 | +13.78 | |||
| Abstentions | 87,512 | 27.82 | –13.78 | |||
| Registered voters | 314,558 | |||||
| Sources[9] | ||||||
Footnotes:
| ||||||
2016 general election edit
| Parties and alliances | Popular vote | Seats | ||||
|---|---|---|---|---|---|---|
| Votes | % | ±pp | Total | +/− | ||
| Republican Left–Catalonia Yes (ERC–CatSí) | 45,525 | 25.13 | +2.82 | 1 | ±0 | |
| Democratic Convergence of Catalonia (CDC)1 | 40,985 | 22.62 | –1.69 | 1 | ±0 | |
| In Common We Can–Let's Win the Change (ECP) | 30,182 | 16.66 | +1.29 | 1 | ±0 | |
| People's Party (PP) | 24,503 | 13.53 | +2.28 | 1 | +1 | |
| Socialists' Party of Catalonia (PSC–PSOE) | 22,533 | 12.44 | +0.02 | 0 | –1 | |
| Citizens–Party of the Citizenry (C's) | 12,592 | 6.95 | –2.06 | 0 | ±0 | |
| Animalist Party Against Mistreatment of Animals (PACMA) | 1,930 | 1.07 | +0.19 | 0 | ±0 | |
| Zero Cuts–Green Group (Recortes Cero–GV) | 288 | 0.16 | –0.04 | 0 | ±0 | |
| Communist Party of the Catalan People (PCPC) | 267 | 0.15 | –0.01 | 0 | ±0 | |
| Vox (Vox) | 198 | 0.11 | –0.12 | 0 | ±0 | |
| Blank ballots | 2,156 | 1.19 | +0.12 | |||
| Total | 181,159 | 4 | ±0 | |||
| Valid votes | 181,159 | 99.04 | –0.05 | |||
| Invalid votes | 1,750 | 0.96 | +0.05 | |||
| Votes cast / turnout | 182,909 | 58.40 | –5.49 | |||
| Abstentions | 130,298 | 41.60 | +5.49 | |||
| Registered voters | 313,207 | |||||
| Sources[9] | ||||||
Footnotes:
| ||||||
2015 general election edit
| Parties and alliances | Popular vote | Seats | ||||
|---|---|---|---|---|---|---|
| Votes | % | ±pp | Total | +/− | ||
| Democracy and Freedom (DiL)1 | 48,289 | 24.31 | –17.01 | 1 | –1 | |
| Republican Left of Catalonia–Catalonia Yes (ERC–CatSí) | 44,317 | 22.31 | +13.72 | 1 | +1 | |
| In Common We Can (En Comú)2 | 30,538 | 15.37 | +11.48 | 1 | +1 | |
| Socialists' Party of Catalonia (PSC–PSOE) | 24,668 | 12.42 | –7.93 | 1 | ±0 | |
| People's Party (PP) | 22,360 | 11.25 | –8.19 | 0 | –1 | |
| Citizens–Party of the Citizenry (C's) | 17,897 | 9.01 | New | 0 | ±0 | |
| Democratic Union of Catalonia (unio.cat) | 4,867 | 2.45 | New | 0 | ±0 | |
| Animalist Party Against Mistreatment of Animals (PACMA) | 1,743 | 0.88 | +0.38 | 0 | ±0 | |
| Union, Progress and Democracy (UPyD) | 687 | 0.35 | –0.21 | 0 | ±0 | |
| Vox (Vox) | 465 | 0.23 | New | 0 | ±0 | |
| Zero Cuts–Green Group (Recortes Cero–GV) | 398 | 0.20 | New | 0 | ±0 | |
| Communist Party of the Catalan People (PCPC) | 316 | 0.16 | –0.02 | 0 | ±0 | |
| Blank ballots | 2,124 | 1.07 | –1.25 | |||
| Total | 198,669 | 4 | ±0 | |||
| Valid votes | 198,669 | 99.09 | +0.95 | |||
| Invalid votes | 1,827 | 0.91 | –0.95 | |||
| Votes cast / turnout | 200,496 | 63.89 | +1.35 | |||
| Abstentions | 113,340 | 36.11 | –1.35 | |||
| Registered voters | 313,836 | |||||
| Sources[9] | ||||||
Footnotes:
| ||||||
2011 general election edit
| Parties and alliances | Popular vote | Seats | ||||
|---|---|---|---|---|---|---|
| Votes | % | ±pp | Total | +/− | ||
| Convergence and Union (CiU) | 79,511 | 41.32 | +12.75 | 2 | +1 | |
| Socialists' Party of Catalonia (PSC–PSOE) | 39,157 | 20.35 | –16.88 | 1 | –1 | |
| People's Party (PP) | 37,401 | 19.44 | +4.39 | 1 | ±0 | |
| Republican Left of Catalonia–Rally–Catalonia Yes (ERC–RI.cat) | 16,529 | 8.59 | –4.29 | 0 | ±0 | |
| Initiative for Catalonia Greens–United and Alternative Left: Plural L. (ICV–EUiA) | 7,487 | 3.89 | +1.32 | 0 | ±0 | |
| Blank Seats (EB) | 2,573 | 1.34 | +1.22 | 0 | ±0 | |
| Platform for Catalonia (PxC) | 1,074 | 0.56 | New | 0 | ±0 | |
| Union, Progress and Democracy (UPyD) | 1,069 | 0.56 | +0.47 | 0 | ±0 | |
| Pirates of Catalonia (Pirata.cat) | 915 | 0.48 | New | 0 | ±0 | |
| Animalist Party Against Mistreatment of Animals (PACMA) | 892 | 0.46 | +0.20 | 0 | ±0 | |
| Anti-capitalists (Anticapitalistas) | 551 | 0.29 | New | 0 | ±0 | |
| For a Fairer World (PUM+J) | 366 | 0.19 | +0.12 | 0 | ±0 | |
| Communist Party of the Catalan People (PCPC) | 355 | 0.18 | +0.10 | 0 | ±0 | |
| Communist Unification of Spain (UCE) | 91 | 0.05 | New | 0 | ±0 | |
| Blank ballots | 4,468 | 2.32 | +0.56 | |||
| Total | 192,439 | 4 | ±0 | |||
| Valid votes | 192,439 | 98.14 | –1.15 | |||
| Invalid votes | 3,644 | 1.86 | +1.15 | |||
| Votes cast / turnout | 196,083 | 62.54 | –6.44 | |||
| Abstentions | 117,433 | 37.46 | +6.44 | |||
| Registered voters | 313,516 | |||||
| Sources[9] | ||||||
2008 general election edit
| Parties and alliances | Popular vote | Seats | ||||
|---|---|---|---|---|---|---|
| Votes | % | ±pp | Total | +/− | ||
| Socialists' Party of Catalonia (PSC–PSOE) | 79,500 | 37.23 | +7.66 | 2 | ±0 | |
| Convergence and Union (CiU) | 60,995 | 28.57 | –0.89 | 1 | ±0 | |
| People's Party (PP) | 32,129 | 15.05 | +0.43 | 1 | +1 | |
| Republican Left of Catalonia (esquerra) | 27,511 | 12.88 | –8.60 | 0 | –1 | |
| Initiative for Catalonia Greens–United and Alternative Left (ICV–EUiA) | 5,489 | 2.57 | –0.39 | 0 | ±0 | |
| Catalan Republican Party (RC) | 561 | 0.26 | New | 0 | ±0 | |
| Anti-Bullfighting Party Against Mistreatment of Animals (PACMA) | 548 | 0.26 | New | 0 | ±0 | |
| Citizens–Party of the Citizenry (C's) | 506 | 0.24 | New | 0 | ±0 | |
| Social Democratic Party (PSD) | 386 | 0.18 | New | 0 | ±0 | |
| Unsubmissive Seats–Alternative of Discontented Democrats (Ei–ADD) | 265 | 0.12 | +0.06 | 0 | ±0 | |
| Citizens for Blank Votes (CenB) | 223 | 0.10 | +0.02 | 0 | ±0 | |
| Union, Progress and Democracy (UPyD) | 199 | 0.09 | New | 0 | ±0 | |
| Party for Catalonia (PxCat) | 190 | 0.09 | New | 0 | ±0 | |
| Communist Party of the Catalan People (PCPC) | 180 | 0.08 | +0.04 | 0 | ±0 | |
| Republican Left–Left Republican Party (IR–PRE) | 179 | 0.08 | –0.08 | 0 | ±0 | |
| National Democracy (DN) | 165 | 0.08 | +0.05 | 0 | ±0 | |
| For a Fairer World (PUM+J) | 144 | 0.07 | New | 0 | ±0 | |
| Internationalist Socialist Workers' Party (POSI) | 124 | 0.06 | New | 0 | ±0 | |
| Family and Life Party (PFiV) | 98 | 0.05 | +0.01 | 0 | ±0 | |
| Spanish Phalanx of the CNSO (FE–JONS) | 88 | 0.04 | ±0.00 | 0 | ±0 | |
| Humanist Party (PH) | 81 | 0.04 | ±0.00 | 0 | ±0 | |
| Authentic Phalanx (FA) | 46 | 0.02 | New | 0 | ±0 | |
| Carlist Party of Catalonia (PCdeC) | 41 | 0.02 | New | 0 | ±0 | |
| Spanish Alternative (AES) | 34 | 0.02 | New | 0 | ±0 | |
| Civil Liberties Party (PLCI) | 30 | 0.01 | New | 0 | ±0 | |
| Internationalist Struggle (LI (LIT–CI)) | 25 | 0.01 | ±0.00 | 0 | ±0 | |
| Spain 2000 (E–2000) | 25 | 0.01 | New | 0 | ±0 | |
| National Alliance (AN) | 17 | 0.01 | New | 0 | ±0 | |
| Blank ballots | 3,749 | 1.76 | +0.96 | |||
| Total | 213,528 | 4 | ±0 | |||
| Valid votes | 213,528 | 99.29 | –0.30 | |||
| Invalid votes | 1,518 | 0.71 | +0.30 | |||
| Votes cast / turnout | 215,046 | 68.98 | –6.01 | |||
| Abstentions | 96,727 | 31.02 | +6.01 | |||
| Registered voters | 311,773 | |||||
| Sources[9] | ||||||
2004 general election edit
| Parties and alliances | Popular vote | Seats | ||||
|---|---|---|---|---|---|---|
| Votes | % | ±pp | Total | +/− | ||
| Socialists' Party of Catalonia (PSC–PSOE) | 68,971 | 29.57 | +1.96 | 2 | +1 | |
| Convergence and Union (CiU) | 68,735 | 29.46 | –9.50 | 1 | –1 | |
| Republican Left of Catalonia (ERC) | 50,104 | 21.48 | +14.32 | 1 | +1 | |
| People's Party (PP) | 34,116 | 14.62 | –6.36 | 0 | –1 | |
| Initiative for Catalonia Greens–United and Alternative Left (ICV–EUiA)1 | 6,910 | 2.96 | +0.21 | 0 | ±0 | |
| The Greens–The Ecologist Alternative (EV–AE) | 1,171 | 0.50 | New | 0 | ±0 | |
| Republican Left–Left Republican Party (IR–PRE) | 382 | 0.16 | New | 0 | ±0 | |
| Citizens for Blank Votes (CenB) | 190 | 0.08 | New | 0 | ±0 | |
| Unsubmissive Seats–Alternative of Discontented Democrats (Ei–ADD) | 135 | 0.06 | New | 0 | ±0 | |
| Communist Party of the Catalan People (PCPC) | 102 | 0.04 | New | 0 | ±0 | |
| Humanist Party (PH) | 96 | 0.04 | –0.03 | 0 | ±0 | |
| Spanish Phalanx of the CNSO (FE–JONS) | 86 | 0.04 | New | 0 | ±0 | |
| Family and Life Party (PFiV) | 86 | 0.04 | New | 0 | ±0 | |
| Democratic and Social Centre (CDS) | 85 | 0.04 | –0.03 | 0 | ±0 | |
| National Democracy (DN) | 73 | 0.03 | New | 0 | ±0 | |
| The Phalanx (FE) | 52 | 0.02 | –0.05 | 0 | ±0 | |
| Caló Nationalist Party (PNCA) | 46 | 0.02 | –0.02 | 0 | ±0 | |
| Republican Social Movement (MSR) | 36 | 0.02 | New | 0 | ±0 | |
| Internationalist Struggle (LI (LIT–CI)) | 33 | 0.01 | –0.02 | 0 | ±0 | |
| Blank ballots | 1,874 | 0.80 | –0.64 | |||
| Total | 233,283 | 4 | ±0 | |||
| Valid votes | 233,283 | 99.59 | +0.36 | |||
| Invalid votes | 961 | 0.41 | –0.36 | |||
| Votes cast / turnout | 234,244 | 74.99 | +10.46 | |||
| Abstentions | 78,113 | 25.01 | –10.46 | |||
| Registered voters | 312,357 | |||||
| Sources[9] | ||||||
Footnotes:
| ||||||
2000 general election edit
| Parties and alliances | Popular vote | Seats | ||||
|---|---|---|---|---|---|---|
| Votes | % | ±pp | Total | +/− | ||
| Convergence and Union (CiU) | 78,131 | 38.96 | –0.31 | 2 | ±0 | |
| Socialists' Party of Catalonia (PSC–PSOE) | 55,374 | 27.61 | –5.39 | 1 | ±0 | |
| People's Party (PP) | 42,081 | 20.98 | +3.10 | 1 | ±0 | |
| Republican Left of Catalonia (ERC) | 14,367 | 7.16 | +1.59 | 0 | ±0 | |
| Initiative for Catalonia–Greens (IC–V) | 3,581 | 1.79 | –1.53 | 0 | ±0 | |
| United and Alternative Left (EUiA) | 1,931 | 0.96 | New | 0 | ±0 | |
| The Greens–Green Alternative (EV–AV) | 864 | 0.43 | New | 0 | ±0 | |
| Internationalist Socialist Workers' Party (POSI) | 356 | 0.18 | New | 0 | ±0 | |
| Catalan State (EC) | 198 | 0.10 | New | 0 | ±0 | |
| Centrist Union–Democratic and Social Centre (UC–CDS) | 149 | 0.07 | ±0.00 | 0 | ±0 | |
| Humanist Party (PH) | 142 | 0.07 | +0.02 | 0 | ±0 | |
| The Phalanx (FE) | 139 | 0.07 | New | 0 | ±0 | |
| Natural Law Party (PLN) | 115 | 0.06 | New | 0 | ±0 | |
| Caló Nationalist Party (PNCA) | 71 | 0.04 | New | 0 | ±0 | |
| Internationalist Struggle (LI (LIT–CI)) | 64 | 0.03 | New | 0 | ±0 | |
| Spain 2000 Platform (ES2000) | 61 | 0.03 | New | 0 | ±0 | |
| Spanish Democratic Party (PADE) | 42 | 0.02 | New | 0 | ±0 | |
| Blank ballots | 2,897 | 1.44 | +0.73 | |||
| Total | 200,563 | 4 | ±0 | |||
| Valid votes | 200,563 | 99.23 | –0.38 | |||
| Invalid votes | 1,561 | 0.77 | +0.38 | |||
| Votes cast / turnout | 202,124 | 64.53 | –10.89 | |||
| Abstentions | 111,115 | 35.47 | +10.89 | |||
| Registered voters | 313,239 | |||||
| Sources[9] | ||||||
1996 general election edit
| Parties and alliances | Popular vote | Seats | ||||
|---|---|---|---|---|---|---|
| Votes | % | ±pp | Total | +/− | ||
| Convergence and Union (CiU) | 88,880 | 39.27 | –0.07 | 2 | ±0 | |
| Socialists' Party of Catalonia (PSC–PSOE) | 74,686 | 33.00 | +5.91 | 1 | ±0 | |
| People's Party (PP) | 40,463 | 17.88 | –1.88 | 1 | ±0 | |
| Republican Left of Catalonia (ERC) | 12,615 | 5.57 | –1.88 | 0 | ±0 | |
| Initiative for Catalonia–The Greens (IC–EV) | 7,508 | 3.32 | +0.10 | 0 | ±0 | |
| Workers' Revolutionary Party (PRT)1 | 191 | 0.08 | –0.21 | 0 | ±0 | |
| Centrist Union (UC) | 154 | 0.07 | –0.55 | 0 | ±0 | |
| Humanist Party (PH) | 121 | 0.05 | ±0.00 | 0 | ±0 | |
| Citizen Independent Platform of Catalonia (PICC) | 99 | 0.04 | New | 0 | ±0 | |
| Revolutionary Workers' Party (POR) | 0 | 0.00 | –0.07 | 0 | ±0 | |
| Blank ballots | 1,601 | 0.71 | –0.06 | |||
| Total | 226,318 | 4 | ±0 | |||
| Valid votes | 226,318 | 99.61 | +0.23 | |||
| Invalid votes | 884 | 0.39 | –0.23 | |||
| Votes cast / turnout | 227,202 | 75.42 | +2.38 | |||
| Abstentions | 74,066 | 24.58 | –2.38 | |||
| Registered voters | 301,268 | |||||
| Sources[9] | ||||||
Footnotes:
| ||||||
1993 general election edit
| Parties and alliances | Popular vote | Seats | ||||
|---|---|---|---|---|---|---|
| Votes | % | ±pp | Total | +/− | ||
| Convergence and Union (CiU) | 83,092 | 39.34 | –2.42 | 2 | ±0 | |
| Socialists' Party of Catalonia (PSC–PSOE) | 57,218 | 27.09 | –1.53 | 1 | –1 | |
| People's Party (PP) | 41,744 | 19.76 | +7.38 | 1 | +1 | |
| Republican Left of Catalonia (ERC) | 15,742 | 7.45 | +3.79 | 0 | ±0 | |
| Initiative for Catalonia (IC) | 6,798 | 3.22 | –0.51 | 0 | ±0 | |
| The Greens (EV)1 | 1,563 | 0.74 | –0.47 | 0 | ±0 | |
| Democratic and Social Centre (CDS) | 1,310 | 0.62 | –3.35 | 0 | ±0 | |
| Workers' Socialist Party (PST) | 614 | 0.29 | –0.08 | 0 | ±0 | |
| The Ecologists (LE) | 530 | 0.25 | –0.40 | 0 | ±0 | |
| Ruiz-Mateos Group–European Democratic Alliance (ARM–ADE) | 520 | 0.25 | –0.92 | 0 | ±0 | |
| Revolutionary Workers' Party (POR) | 155 | 0.07 | –0.02 | 0 | ±0 | |
| Natural Law Party (PLN) | 143 | 0.07 | New | 0 | ±0 | |
| Humanist Party (PH) | 98 | 0.05 | –0.04 | 0 | ±0 | |
| Coalition for a New Socialist Party (CNPS)2 | 72 | 0.03 | –0.04 | 0 | ±0 | |
| Communist Unification of Spain (UCE) | 0 | 0.00 | New | 0 | ±0 | |
| Freixes Independent Group (Freixes) | 0 | 0.00 | New | 0 | ±0 | |
| Blank ballots | 1,618 | 0.77 | +0.04 | |||
| Total | 211,217 | 4 | ±0 | |||
| Valid votes | 211,217 | 99.38 | –0.02 | |||
| Invalid votes | 1,316 | 0.62 | +0.02 | |||
| Votes cast / turnout | 212,533 | 73.04 | +7.80 | |||
| Abstentions | 78,450 | 26.96 | –7.80 | |||
| Registered voters | 290,983 | |||||
| Sources[9] | ||||||
Footnotes:
| ||||||
1989 general election edit
| Parties and alliances | Popular vote | Seats | ||||
|---|---|---|---|---|---|---|
| Votes | % | ±pp | Total | +/− | ||
| Convergence and Union (CiU) | 76,602 | 41.76 | +1.07 | 2 | ±0 | |
| Socialists' Party of Catalonia (PSC–PSOE) | 52,504 | 28.62 | –1.89 | 2 | +1 | |
| People's Party (PP)1 | 22,713 | 12.38 | –3.74 | 0 | –1 | |
| Democratic and Social Centre (CDS) | 7,282 | 3.97 | +0.73 | 0 | ±0 | |
| Initiative for Catalonia (IC)2 | 6,835 | 3.73 | +1.21 | 0 | ±0 | |
| Republican Left of Catalonia (ERC) | 6,715 | 3.66 | +0.58 | 0 | ±0 | |
| Green Alternative–Ecologist Movement of Catalonia (AV–MEC) | 2,216 | 1.21 | +0.05 | 0 | ±0 | |
| Ruiz-Mateos Group (Ruiz-Mateos) | 2,154 | 1.17 | New | 0 | ±0 | |
| The Ecologist Greens (EVE) | 1,186 | 0.65 | New | 0 | ±0 | |
| Party of the Communists of Catalonia (PCC) | 919 | 0.50 | –0.25 | 0 | ±0 | |
| Ecologist Party of Catalonia–VERDE (PEC–VERDE) | 723 | 0.39 | New | 0 | ±0 | |
| Workers' Socialist Party (PST) | 674 | 0.37 | +0.03 | 0 | ±0 | |
| Workers' Party of Spain–Communist Unity (PTE–UC)3 | 480 | 0.26 | –0.08 | 0 | ±0 | |
| Social Democratic Coalition (CSD)4 | 418 | 0.23 | +0.02 | 0 | ±0 | |
| Revolutionary Workers' Party of Spain (PORE) | 170 | 0.09 | ±0.00 | 0 | ±0 | |
| Humanist Party of Catalonia (PHC) | 158 | 0.09 | New | 0 | ±0 | |
| Centrist Unity–Democratic Spanish Party (PED) | 153 | 0.08 | New | 0 | ±0 | |
| Alliance for the Republic (AxR)5 | 120 | 0.07 | –0.06 | 0 | ±0 | |
| Valencian Nationalist Left–Valencian Regional Union (ENV–URV) | 81 | 0.04 | New | 0 | ±0 | |
| The Greens–Green List (EV–LV) | 0 | 0.00 | New | 0 | ±0 | |
| Blank ballots | 1,341 | 0.73 | +0.27 | |||
| Total | 183,444 | 4 | ±0 | |||
| Valid votes | 183,444 | 99.40 | +0.15 | |||
| Invalid votes | 1,113 | 0.60 | –0.15 | |||
| Votes cast / turnout | 184,557 | 65.24 | –2.41 | |||
| Abstentions | 98,311 | 34.76 | +2.41 | |||
| Registered voters | 282,868 | |||||
| Sources[9] | ||||||
Footnotes:
| ||||||
1986 general election edit
| Parties and alliances | Popular vote | Seats | ||||
|---|---|---|---|---|---|---|
| Votes | % | ±pp | Total | +/− | ||
| Convergence and Union (CiU) | 77,645 | 40.69 | +12.73 | 2 | +1 | |
| Socialists' Party of Catalonia (PSC–PSOE) | 58,221 | 30.51 | –4.73 | 1 | –1 | |
| People's Coalition (AP–PDP–PL)1 | 30,759 | 16.12 | +0.28 | 1 | ±0 | |
| Democratic and Social Centre (CDS) | 6,189 | 3.24 | +0.11 | 0 | ±0 | |
| Republican Left of Catalonia (ERC) | 5,880 | 3.08 | –2.77 | 0 | ±0 | |
| Union of the Catalan Left (PSUC–ENE)2 | 4,811 | 2.52 | –1.02 | 0 | ±0 | |
| Green Alternative List (LAV) | 2,222 | 1.16 | New | 0 | ±0 | |
| Party of the Communists of Catalonia (PCC) | 1,430 | 0.75 | –0.23 | 0 | ±0 | |
| Workers' Socialist Party (PST) | 704 | 0.37 | –0.26 | 0 | ±0 | |
| Communists' Unity Board (MUC) | 642 | 0.34 | New | 0 | ±0 | |
| Social Democratic Party of Catalonia (PSDC) | 395 | 0.21 | New | 0 | ±0 | |
| Internationalist Socialist Workers' Party (POSI) | 241 | 0.13 | New | 0 | ±0 | |
| Communist Unification of Spain (UCE) | 238 | 0.12 | +0.01 | 0 | ±0 | |
| Spanish Phalanx of the CNSO (FE–JONS) | 211 | 0.11 | New | 0 | ±0 | |
| Republican Popular Unity (UPR)3 | 189 | 0.10 | –0.01 | 0 | ±0 | |
| Revolutionary Workers' Party of Spain (PORE) | 179 | 0.09 | New | 0 | ±0 | |
| Blank ballots | 873 | 0.46 | +0.05 | |||
| Total | 190,829 | 4 | ±0 | |||
| Valid votes | 190,829 | 99.25 | +0.44 | |||
| Invalid votes | 1,446 | 0.75 | –0.44 | |||
| Votes cast / turnout | 192,275 | 67.65 | –8.19 | |||
| Abstentions | 91,956 | 32.35 | +8.19 | |||
| Registered voters | 284,231 | |||||
| Sources[9] | ||||||
Footnotes:
| ||||||
1982 general election edit
| Parties and alliances | Popular vote | Seats | ||||
|---|---|---|---|---|---|---|
| Votes | % | ±pp | Total | +/− | ||
| Socialists' Party of Catalonia (PSC–PSOE) | 70,821 | 35.24 | +10.30 | 2 | +1 | |
| Convergence and Union (CiU) | 56,188 | 27.96 | +12.05 | 1 | ±0 | |
| People's Alliance–People's Democratic Party (AP–PDP)1 | 31,832 | 15.84 | +12.64 | 1 | +1 | |
| Republican Left of Catalonia (ERC) | 11,748 | 5.85 | –1.90 | 0 | ±0 | |
| Centrists of Catalonia (CC–UCD) | 11,484 | 5.71 | –25.97 | 0 | –2 | |
| Democratic and Social Centre (CDS) | 6,286 | 3.13 | New | 0 | ±0 | |
| Unified Socialist Party of Catalonia (PSUC–PCE) | 5,495 | 2.73 | –7.92 | 0 | ±0 | |
| Party of the Communists of Catalonia (PCC) | 1,960 | 0.98 | New | 0 | ±0 | |
| Left Nationalists (NE) | 1,630 | 0.81 | New | 0 | ±0 | |
| Workers' Socialist Party (PST) | 1,273 | 0.63 | New | 0 | ±0 | |
| New Force (FN)2 | 743 | 0.37 | –0.72 | 0 | ±0 | |
| Communist Front of Catalonia (FCC)3 | 255 | 0.13 | –0.09 | 0 | ±0 | |
| Communist Party of Spain (Marxist–Leninist) (PCE (m–l)) | 227 | 0.11 | New | 0 | ±0 | |
| Communist Unification of Spain (UCE) | 216 | 0.11 | New | 0 | ±0 | |
| Blank ballots | 833 | 0.41 | +0.02 | |||
| Total | 200,991 | 4 | ±0 | |||
| Valid votes | 200,991 | 98.81 | +0.23 | |||
| Invalid votes | 2,412 | 1.19 | –0.23 | |||
| Votes cast / turnout | 203,403 | 75.84 | +10.57 | |||
| Abstentions | 64,802 | 24.16 | –10.57 | |||
| Registered voters | 268,205 | |||||
| Sources[9] | ||||||
Footnotes:
| ||||||
1979 general election edit
| Parties and alliances | Popular vote | Seats | ||||
|---|---|---|---|---|---|---|
| Votes | % | ±pp | Total | +/− | ||
| Centrists of Catalonia (CC–UCD)1 | 54,540 | 31.68 | +7.37 | 2 | +1 | |
| Socialists' Party of Catalonia (PSC–PSOE)2 | 42,937 | 24.94 | +9.98 | 1 | ±0 | |
| Convergence and Union (CiU)3 | 27,399 | 15.91 | –17.99 | 1 | –1 | |
| Unified Socialist Party of Catalonia (PSUC–PCE) | 18,340 | 10.65 | –1.55 | 0 | ±0 | |
| Republican Left of Catalonia–National Front of Catalonia (ERC–FNC)4 | 13,336 | 7.75 | +0.16 | 0 | ±0 | |
| Democratic Coalition (CD)5 | 5,509 | 3.20 | –2.22 | 0 | ±0 | |
| Party of Labour of Catalonia (PTC–PTE) | 1,914 | 1.11 | New | 0 | ±0 | |
| National Union (UN) | 1,875 | 1.09 | New | 0 | ±0 | |
| Left Bloc for National Liberation (BEAN) | 1,476 | 0.86 | New | 0 | ±0 | |
| Republican Left (IR) | 1,066 | 0.62 | New | 0 | ±0 | |
| Communist Organization of Spain (Red Flag) (OCE–BR) | 618 | 0.36 | New | 0 | ±0 | |
| Communist Movement–Organization of Communist Left (MC–OIC) | 562 | 0.33 | New | 0 | ±0 | |
| Catalan State (EC) | 561 | 0.33 | New | 0 | ±0 | |
| Carlist Party (PC) | 461 | 0.27 | New | 0 | ±0 | |
| Revolutionary Communist League (LCR) | 371 | 0.22 | New | 0 | ±0 | |
| Workers' Revolutionary Organization (ORT)6 | 355 | 0.21 | –0.49 | 0 | ±0 | |
| Union for the Freedom of Speech (ULE) | 171 | 0.10 | New | 0 | ±0 | |
| Spanish Phalanx–Falangist Unity (FE–UF) | 0 | 0.00 | New | 0 | ±0 | |
| Blank ballots | 679 | 0.39 | +0.19 | |||
| Total | 172,170 | 4 | ±0 | |||
| Valid votes | 172,170 | 98.58 | +0.07 | |||
| Invalid votes | 2,486 | 1.42 | –0.07 | |||
| Votes cast / turnout | 174,656 | 65.27 | –12.66 | |||
| Abstentions | 92,928 | 34.73 | +12.66 | |||
| Registered voters | 267,584 | |||||
| Sources[9] | ||||||
Footnotes:
| ||||||
1977 general election edit
| Parties and alliances | Popular vote | Seats | ||||
|---|---|---|---|---|---|---|
| Votes | % | ±pp | Total | +/− | ||
| Democratic Pact for Catalonia (PDC) | 45,428 | 24.44 | n/a | 2 | n/a | |
| Union of the Democratic Centre (UCD) | 45,191 | 24.31 | n/a | 1 | n/a | |
| Socialists of Catalonia (PSC–PSOE) | 27,809 | 14.96 | n/a | 1 | n/a | |
| Unified Socialist Party of Catalonia (PSUC–PCE) | 22,680 | 12.20 | n/a | 0 | n/a | |
| Union of the Centre and Christian Democracy of Catalonia (UCiDCC) | 17,582 | 9.46 | n/a | 0 | n/a | |
| Left of Catalonia–Democratic Electoral Front (EC–FED) | 14,118 | 7.59 | n/a | 0 | n/a | |
| Catalan Coexistence–People's Alliance (CC–AP) | 10,067 | 5.42 | n/a | 0 | n/a | |
| Catalan Social Reform (RSC) | 1,356 | 0.73 | n/a | 0 | n/a | |
| Workers' Electoral Group (AET) | 1,295 | 0.70 | n/a | 0 | n/a | |
| Blank ballots | 369 | 0.20 | n/a | |||
| Total | 185,895 | 4 | n/a | |||
| Valid votes | 185,895 | 98.51 | n/a | |||
| Invalid votes | 2,820 | 1.49 | n/a | |||
| Votes cast / turnout | 188,715 | 77.93 | n/a | |||
| Abstentions | 53,433 | 22.07 | n/a | |||
| Registered voters | 242,148 | |||||
| Sources[9] | ||||||
References edit
- ^ "Real Decreto 1037/2022, de 20 de diciembre, por el que se declaran oficiales las cifras de población resultantes de la revisión del Padrón municipal referidas al 1 de enero de 2022" (PDF). Boletín Oficial del Estado (in Spanish) (305): 178928–178933. 21 December 2022. ISSN 0212-033X.
- ^ "Ley 1/1977, de 4 de enero, para la Reforma Política". Law No. 1 of 4 January 1977 (in Spanish). Retrieved 27 December 2016.
- ^ a b "Constitución Española". Act of 29 December 1978 (in Spanish). Retrieved 27 December 2016.
- ^ Reig Pellicer, Naiara (16 December 2015). "Spanish elections: Begging for the right to vote". cafebabel.co.uk. Retrieved 17 July 2017.
- ^ a b "Real Decreto-ley 20/1977, de 18 de marzo, sobre Normas Electorales". Royal Decree-Law No. 20 of 18 March 1977 (in Spanish). Retrieved 14 December 2019.
- ^ a b "Ley Orgánica 5/1985, de 19 de junio, del Régimen Electoral General". Organic Law No. 5 of 19 June 1985 (in Spanish). Retrieved 30 January 2020.
- ^ Gallagher, Michael (30 July 2012). "Effective threshold in electoral systems". Trinity College, Dublin. Archived from the original on 30 July 2017. Retrieved 22 July 2017.
- ^ "Resolución de 30 de agosto de 2023, de la Presidencia de la Junta Electoral Central, por la que se publica el resumen de los resultados de las elecciones al Congreso de los Diputados y al Senado convocadas por Real Decreto 400/2023, de 29 de mayo, y celebradas el 23 de julio de 2023, conforme a las actas de escrutinio general y de proclamación de electos remitidas por las correspondientes Juntas Electorales Provinciales y por las Juntas Electorales de Ceuta y de Melilla" (PDF). Boletín Oficial del Estado (in Spanish) (209): 122201–122274. 1 September 2023. ISSN 0212-033X.
- ^ a b c d e f g h i j k l m n o "Elecciones celebradas. Resultados electorales". Ministry of the Interior (in Spanish). Retrieved 15 April 2022.