


Summary
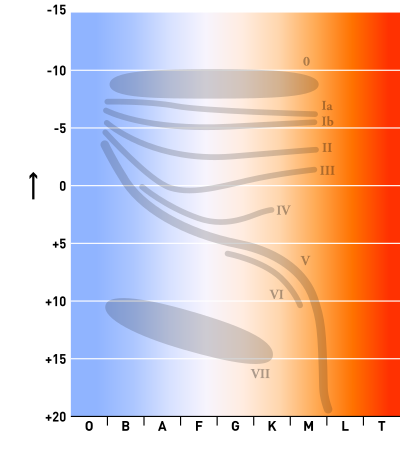
In astronomy, the main sequence is a classification of stars which appear on plots of stellar color versus brightness as a continuous and distinctive band. Stars on this band are known as main-sequence stars or dwarf stars, and positions of stars on and off the band are believed to indicate their physical properties, as well as their progress through several types of star life-cycles. These are the most numerous true stars in the universe and include the Sun. Color-magnitude plots are known as Hertzsprung–Russell diagrams after Ejnar Hertzsprung and Henry Norris Russell.

After condensation and ignition of a star, it generates thermal energy in its dense core region through nuclear fusion of hydrogen into helium. During this stage of the star's lifetime, it is located on the main sequence at a position determined primarily by its mass but also based on its chemical composition and age. The cores of main-sequence stars are in hydrostatic equilibrium, where outward thermal pressure from the hot core is balanced by the inward pressure of gravitational collapse from the overlying layers. The strong dependence of the rate of energy generation on temperature and pressure helps to sustain this balance. Energy generated at the core makes its way to the surface and is radiated away at the photosphere. The energy is carried by either radiation or convection, with the latter occurring in regions with steeper temperature gradients, higher opacity, or both.
The main sequence is sometimes divided into upper and lower parts, based on the dominant process that a star uses to generate energy. The Sun, along with main sequence stars below about 1.5 times the mass of the Sun (1.5 M☉), primarily fuse hydrogen atoms together in a series of stages to form helium, a sequence called the proton–proton chain. Above this mass, in the upper main sequence, the nuclear fusion process mainly uses atoms of carbon, nitrogen, and oxygen as intermediaries in the CNO cycle that produces helium from hydrogen atoms. Main-sequence stars with more than two solar masses undergo convection in their core regions, which acts to stir up the newly created helium and maintain the proportion of fuel needed for fusion to occur. Below this mass, stars have cores that are entirely radiative with convective zones near the surface. With decreasing stellar mass, the proportion of the star forming a convective envelope steadily increases. The Main-sequence stars below 0.4 M☉ undergo convection throughout their mass. When core convection does not occur, a helium-rich core develops surrounded by an outer layer of hydrogen.
The more massive a star is, the shorter its lifespan on the main sequence. After the hydrogen fuel at the core has been consumed, the star evolves away from the main sequence on the HR diagram, into a supergiant, red giant, or directly to a white dwarf.
History edit
In the early part of the 20th century, information about the types and distances of stars became more readily available. The spectra of stars were shown to have distinctive features, which allowed them to be categorized. Annie Jump Cannon and Edward C. Pickering at Harvard College Observatory developed a method of categorization that became known as the Harvard Classification Scheme, published in the Harvard Annals in 1901.[1]
In Potsdam in 1906, the Danish astronomer Ejnar Hertzsprung noticed that the reddest stars—classified as K and M in the Harvard scheme—could be divided into two distinct groups. These stars are either much brighter than the Sun or much fainter. To distinguish these groups, he called them "giant" and "dwarf" stars. The following year he began studying star clusters; large groupings of stars that are co-located at approximately the same distance. For these stars, he published the first plots of color versus luminosity. These plots showed a prominent and continuous sequence of stars, which he named the Main Sequence.[2]
At Princeton University, Henry Norris Russell was following a similar course of research. He was studying the relationship between the spectral classification of stars and their actual brightness as corrected for distance—their absolute magnitude. For this purpose, he used a set of stars that had reliable parallaxes and many of which had been categorized at Harvard. When he plotted the spectral types of these stars against their absolute magnitude, he found that dwarf stars followed a distinct relationship. This allowed the real brightness of a dwarf star to be predicted with reasonable accuracy.[3]
Of the red stars observed by Hertzsprung, the dwarf stars also followed the spectra-luminosity relationship discovered by Russell. However, giant stars are much brighter than dwarfs and so do not follow the same relationship. Russell proposed that "giant stars must have low density or great surface brightness, and the reverse is true of dwarf stars". The same curve also showed that there were very few faint white stars.[3]
In 1933, Bengt Strömgren introduced the term Hertzsprung–Russell diagram to denote a luminosity-spectral class diagram.[4] This name reflected the parallel development of this technique by both Hertzsprung and Russell earlier in the century.[2]
As evolutionary models of stars were developed during the 1930s, it was shown that, for stars with the same composition, the star's mass determines its luminosity and radius. Conversely, when a star's chemical composition and its position on the main sequence are known, the star's mass and radius can be deduced. This became known as the Vogt–Russell theorem; named after Heinrich Vogt and Henry Norris Russell. It was subsequently discovered that this relationship breaks down somewhat for stars of the non-uniform composition.[5]
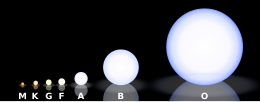
A refined scheme for stellar classification was published in 1943 by William Wilson Morgan and Philip Childs Keenan.[6] The MK classification assigned each star a spectral type—based on the Harvard classification—and a luminosity class. The Harvard classification had been developed by assigning a different letter to each star based on the strength of the hydrogen spectral line before the relationship between spectra and temperature was known. When ordered by temperature and when duplicate classes were removed, the spectral types of stars followed, in order of decreasing temperature with colors ranging from blue to red, the sequence O, B, A, F, G, K, and M. (A popular mnemonic for memorizing this sequence of stellar classes is "Oh Be A Fine Girl/Guy, Kiss Me".) The luminosity class ranged from I to V, in order of decreasing luminosity. Stars of luminosity class V belonged to the main sequence.[7]
In April 2018, astronomers reported the detection of the most distant "ordinary" (i.e., main sequence) star, named Icarus (formally, MACS J1149 Lensed Star 1), at 9 billion light-years away from Earth.[8][9]
Formation and evolution edit
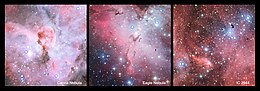
When a protostar is formed from the collapse of a giant molecular cloud of gas and dust in the local interstellar medium, the initial composition is homogeneous throughout, consisting of about 70% hydrogen, 28% helium, and trace amounts of other elements, by mass.[11] The initial mass of the star depends on the local conditions within the cloud. (The mass distribution of newly formed stars is described empirically by the initial mass function.)[12] During the initial collapse, this pre-main-sequence star generates energy through gravitational contraction. Once sufficiently dense, stars begin converting hydrogen into helium and giving off energy through an exothermic nuclear fusion process.[7]
When nuclear fusion of hydrogen becomes the dominant energy production process and the excess energy gained from gravitational contraction has been lost,[13] the star lies along a curve on the Hertzsprung–Russell diagram (or HR diagram) called the standard main sequence. Astronomers will sometimes refer to this stage as "zero-age main sequence", or ZAMS.[14][15] The ZAMS curve can be calculated using computer models of stellar properties at the point when stars begin hydrogen fusion. From this point, the brightness and surface temperature of stars typically increase with age.[16]
A star remains near its initial position on the main sequence until a significant amount of hydrogen in the core has been consumed, then begins to evolve into a more luminous star. (On the HR diagram, the evolving star moves up and to the right of the main sequence.) Thus the main sequence represents the primary hydrogen-burning stage of a star's lifetime.[7]
Classification edit
Main sequence stars are divided into the following types:
- O-type main-sequence star
- B-type main-sequence star
- A-type main-sequence star
- F-type main-sequence star
- G-type main-sequence star
- K-type main-sequence star
- M-type main-sequence star
M-type (and, to a lesser extent, K-type)[17] main-sequence stars are usually referred to as red dwarfs.
Properties edit
The majority of stars on a typical HR diagram lie along the main-sequence curve. This line is pronounced because both the spectral type and the luminosity depends only on a star's mass, at least to zeroth-order approximation, as long as it is fusing hydrogen at its core—and that is what almost all stars spend most of their "active" lives doing.[18]
The temperature of a star determines its spectral type via its effect on the physical properties of plasma in its photosphere. A star's energy emission as a function of wavelength is influenced by both its temperature and composition. A key indicator of this energy distribution is given by the color index, B − V, which measures the star's magnitude in blue (B) and green-yellow (V) light by means of filters.[note 1] This difference in magnitude provides a measure of a star's temperature.
Dwarf terminology edit
Main-sequence stars are called dwarf stars,[19][20] but this terminology is partly historical and can be somewhat confusing. For the cooler stars, dwarfs such as red dwarfs, orange dwarfs, and yellow dwarfs are indeed much smaller and dimmer than other stars of those colors. However, for hotter blue and white stars, the difference in size and brightness between so-called "dwarf" stars that are on the main sequence and so-called "giant" stars that are not, becomes smaller. For the hottest stars the difference is not directly observable and for these stars, the terms "dwarf" and "giant" refer to differences in spectral lines which indicate whether a star is on or off the main sequence. Nevertheless, very hot main-sequence stars are still sometimes called dwarfs, even though they have roughly the same size and brightness as the "giant" stars of that temperature.[21]
The common use of "dwarf" to mean the main sequence is confusing in another way because there are dwarf stars that are not main-sequence stars. For example, a white dwarf is the dead core left over after a star has shed its outer layers, and is much smaller than a main-sequence star, roughly the size of Earth. These represent the final evolutionary stage of many main-sequence stars.[22]
Parameters edit
By treating the star as an idealized energy radiator known as a black body, the luminosity L and radius R can be related to the effective temperature Teff by the Stefan–Boltzmann law:

where σ is the Stefan–Boltzmann constant. As the position of a star on the HR diagram shows its approximate luminosity, this relation can be used to estimate its radius.[23]
The mass, radius, and luminosity of a star are closely interlinked, and their respective values can be approximated by three relations. First is the Stefan–Boltzmann law, which relates the luminosity L, the radius R and the surface temperature Teff. Second is the mass–luminosity relation, which relates the luminosity L and the mass M. Finally, the relationship between M and R is close to linear. The ratio of M to R increases by a factor of only three over 2.5 orders of magnitude of M. This relation is roughly proportional to the star's inner temperature TI, and its extremely slow increase reflects the fact that the rate of energy generation in the core strongly depends on this temperature, whereas it has to fit the mass-luminosity relation. Thus, a too-high or too-low temperature will result in stellar instability.
A better approximation is to take ε = L/M, the energy generation rate per unit mass, as ε is proportional to TI15, where TI is the core temperature. This is suitable for stars at least as massive as the Sun, exhibiting the CNO cycle, and gives the better fit R ∝ M0.78.[24]
Sample parameters edit
The table below shows typical values for stars along the main sequence. The values of luminosity (L), radius (R), and mass (M) are relative to the Sun—a dwarf star with a spectral classification of G2 V. The actual values for a star may vary by as much as 20–30% from the values listed below.[25][why?]
| Stellar class |
Radius, R/R☉ |
Mass, M/M☉ |
Luminosity, L/L☉ |
Temp. (K) |
Examples[27] |
|---|---|---|---|---|---|
| O2 | 12 | 100 | 800,000 | 50,000 | BI 253 |
| O6 | 9.8 | 35 | 180,000 | 38,000 | Theta1 Orionis C |
| B0 | 7.4 | 18 | 20,000 | 30,000 | Phi1 Orionis |
| B5 | 3.8 | 6.5 | 800 | 16,400 | Pi Andromedae A |
| A0 | 2.5 | 3.2 | 80 | 10,800 | Alpha Coronae Borealis A |
| A5 | 1.7 | 2.1 | 20 | 8,620 | Beta Pictoris |
| F0 | 1.3 | 1.7 | 6 | 7,240 | Gamma Virginis |
| F5 | 1.2 | 1.3 | 2.5 | 6,540 | Eta Arietis |
| G0 | 1.05 | 1.10 | 1.26 | 5,920 | Beta Comae Berenices |
| G2 | 1 | 1 | 1 | 5,780 | Sun[note 2] |
| G5 | 0.93 | 0.93 | 0.79 | 5,610 | Alpha Mensae |
| K0 | 0.85 | 0.78 | 0.40 | 5,240 | 70 Ophiuchi A |
| K5 | 0.74 | 0.69 | 0.16 | 4,410 | 61 Cygni A[28] |
| M0 | 0.51 | 0.60 | 0.072 | 3,800 | Lacaille 8760 |
| M5 | 0.18 | 0.15 | 0.0027 | 3,120 | EZ Aquarii A |
| M8 | 0.11 | 0.08 | 0.0004 | 2,650 | Van Biesbroeck's star[29] |
| L1 | 0.09 | 0.07 | 0.00017 | 2,200 | 2MASS J0523−1403 |

Energy generation edit
All main-sequence stars have a core region where energy is generated by nuclear fusion. The temperature and density of this core are at the levels necessary to sustain the energy production that will support the remainder of the star. A reduction of energy production would cause the overlaying mass to compress the core, resulting in an increase in the fusion rate because of higher temperature and pressure. Likewise, an increase in energy production would cause the star to expand, lowering the pressure at the core. Thus the star forms a self-regulating system in hydrostatic equilibrium that is stable over the course of its main-sequence lifetime.[30]
Main-sequence stars employ two types of hydrogen fusion processes, and the rate of energy generation from each type depends on the temperature in the core region. Astronomers divide the main sequence into upper and lower parts, based on which of the two is the dominant fusion process. In the lower main sequence, energy is primarily generated as the result of the proton–proton chain, which directly fuses hydrogen together in a series of stages to produce helium.[31] Stars in the upper main sequence have sufficiently high core temperatures to efficiently use the CNO cycle (see chart). This process uses atoms of carbon, nitrogen, and oxygen as intermediaries in the process of fusing hydrogen into helium.
At a stellar core temperature of 18 million Kelvin, the PP process and CNO cycle are equally efficient, and each type generates half of the star's net luminosity. As this is the core temperature of a star with about 1.5 M☉, the upper main sequence consists of stars above this mass. Thus, roughly speaking, stars of spectral class F or cooler belong to the lower main sequence, while A-type stars or hotter are upper main-sequence stars.[16] The transition in primary energy production from one form to the other spans a range difference of less than a single solar mass. In the Sun, a one solar-mass star, only 1.5% of the energy is generated by the CNO cycle.[32] By contrast, stars with 1.8 M☉ or above generate almost their entire energy output through the CNO cycle.[33]
The observed upper limit for a main-sequence star is 120–200 M☉.[34] The theoretical explanation for this limit is that stars above this mass can not radiate energy fast enough to remain stable, so any additional mass will be ejected in a series of pulsations until the star reaches a stable limit.[35] The lower limit for sustained proton-proton nuclear fusion is about 0.08 M☉ or 80 times the mass of Jupiter.[31] Below this threshold are sub-stellar objects that can not sustain hydrogen fusion, known as brown dwarfs.[36]
Structure edit
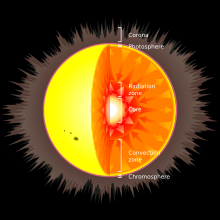
Because there is a temperature difference between the core and the surface, or photosphere, energy is transported outward. The two modes for transporting this energy are radiation and convection. A radiation zone, where energy is transported by radiation, is stable against convection and there is very little mixing of the plasma. By contrast, in a convection zone the energy is transported by bulk movement of plasma, with hotter material rising and cooler material descending. Convection is a more efficient mode for carrying energy than radiation, but it will only occur under conditions that create a steep temperature gradient.[30][37]
In massive stars (above 10 M☉)[38] the rate of energy generation by the CNO cycle is very sensitive to temperature, so the fusion is highly concentrated at the core. Consequently, there is a high temperature gradient in the core region, which results in a convection zone for more efficient energy transport.[31] This mixing of material around the core removes the helium ash from the hydrogen-burning region, allowing more of the hydrogen in the star to be consumed during the main-sequence lifetime. The outer regions of a massive star transport energy by radiation, with little or no convection.[30]
Intermediate-mass stars such as Sirius may transport energy primarily by radiation, with a small core convection region.[39] Medium-sized, low-mass stars like the Sun have a core region that is stable against convection, with a convection zone near the surface that mixes the outer layers. This results in a steady buildup of a helium-rich core, surrounded by a hydrogen-rich outer region. By contrast, cool, very low-mass stars (below 0.4 M☉) are convective throughout.[12] Thus the helium produced at the core is distributed across the star, producing a relatively uniform atmosphere and a proportionately longer main-sequence lifespan.[30]
Luminosity-color variation edit
As non-fusing helium accumulates in the core of a main-sequence star, the reduction in the abundance of hydrogen per unit mass results in a gradual lowering of the fusion rate within that mass. Since it is fusion-supplied power that maintains the pressure of the core and supports the higher layers of the star, the core gradually gets compressed. This brings hydrogen-rich material into a shell around the helium-rich core at a depth where the pressure is sufficient for fusion to occur. The high power output from this shell pushes the higher layers of the star further out. This causes a gradual increase in the radius and consequently luminosity of the star over time.[16] For example, the luminosity of the early Sun was only about 70% of its current value.[40] As a star ages it thus changes its position on the HR diagram. This evolution is reflected in a broadening of the main sequence band which contains stars at various evolutionary stages.[41]
Other factors that broaden the main sequence band on the HR diagram include uncertainty in the distance to stars and the presence of unresolved binary stars that can alter the observed stellar parameters. However, even perfect observation would show a fuzzy main sequence because mass is not the only parameter that affects a star's color and luminosity. Variations in chemical composition caused by the initial abundances, the star's evolutionary status,[42] interaction with a close companion,[43] rapid rotation,[44] or a magnetic field can all slightly change a main-sequence star's HR diagram position, to name just a few factors. As an example, there are metal-poor stars (with a very low abundance of elements with higher atomic numbers than helium) that lie just below the main sequence and are known as subdwarfs. These stars are fusing hydrogen in their cores and so they mark the lower edge of the main sequence fuzziness caused by variance in chemical composition.[45]
A nearly vertical region of the HR diagram, known as the instability strip, is occupied by pulsating variable stars known as Cepheid variables. These stars vary in magnitude at regular intervals, giving them a pulsating appearance. The strip intersects the upper part of the main sequence in the region of class A and F stars, which are between one and two solar masses. Pulsating stars in this part of the instability strip intersecting the upper part of the main sequence are called Delta Scuti variables. Main-sequence stars in this region experience only small changes in magnitude, so this variation is difficult to detect.[46] Other classes of unstable main-sequence stars, like Beta Cephei variables, are unrelated to this instability strip.
Lifetime edit
The total amount of energy that a star can generate through nuclear fusion of hydrogen is limited by the amount of hydrogen fuel that can be consumed at the core. For a star in equilibrium, the thermal energy generated at the core must be at least equal to the energy radiated at the surface. Since the luminosity gives the amount of energy radiated per unit time, the total life span can be estimated, to first approximation, as the total energy produced divided by the star's luminosity.[47]
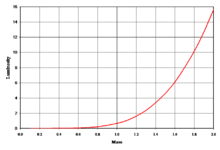
For a star with at least 0.5 M☉, when the hydrogen supply in its core is exhausted and it expands to become a red giant, it can start to fuse helium atoms to form carbon. The energy output of the helium fusion process per unit mass is only about a tenth the energy output of the hydrogen process, and the luminosity of the star increases.[48] This results in a much shorter length of time in this stage compared to the main-sequence lifetime. (For example, the Sun is predicted to spend 130 million years burning helium, compared to about 12 billion years burning hydrogen.)[49] Thus, about 90% of the observed stars above 0.5 M☉ will be on the main sequence.[50] On average, main-sequence stars are known to follow an empirical mass–luminosity relationship.[51] The luminosity (L) of the star is roughly proportional to the total mass (M) as the following power law:

This relationship applies to main-sequence stars in the range 0.1–50 M☉.[52]
The amount of fuel available for nuclear fusion is proportional to the mass of the star. Thus, the lifetime of a star on the main sequence can be estimated by comparing it to solar evolutionary models. The Sun has been a main-sequence star for about 4.5 billion years and it will become a red giant in 6.5 billion years,[53] for a total main-sequence lifetime of roughly 1010 years. Hence:[54]
![{\displaystyle \tau _{\text{MS}}\approx 10^{10}{\text{years}}\left[{\frac {M}{M_{\bigodot }}}\right]\left[{\frac {L_{\bigodot }}{L}}\right]=10^{10}{\text{years}}\left[{\frac {M}{M_{\bigodot }}}\right]^{-2.5}}](https://wikimedia.org/api/rest_v1/media/math/render/svg/3712d23010eb29f6e900c55e7101048e76a4651d)
where M and L are the mass and luminosity of the star, respectively, is a solar mass, is the solar luminosity and is the star's estimated main-sequence lifetime.


Although more massive stars have more fuel to burn and might intuitively be expected to last longer, they also radiate a proportionately greater amount with increased mass. This is required by the stellar equation of state; for a massive star to maintain equilibrium, the outward pressure of radiated energy generated in the core not only must but will rise to match the titanic inward gravitational pressure of its envelope. Thus, the most massive stars may remain on the main sequence for only a few million years, while stars with less than a tenth of a solar mass may last for over a trillion years.[55]
The exact mass-luminosity relationship depends on how efficiently energy can be transported from the core to the surface. A higher opacity has an insulating effect that retains more energy at the core, so the star does not need to produce as much energy to remain in hydrostatic equilibrium. By contrast, a lower opacity means energy escapes more rapidly and the star must burn more fuel to remain in equilibrium.[56] A sufficiently high opacity can result in energy transport via convection, which changes the conditions needed to remain in equilibrium.[16]
In high-mass main-sequence stars, the opacity is dominated by electron scattering, which is nearly constant with increasing temperature. Thus the luminosity only increases as the cube of the star's mass.[48] For stars below 10 M☉, the opacity becomes dependent on temperature, resulting in the luminosity varying approximately as the fourth power of the star's mass.[52] For very low-mass stars, molecules in the atmosphere also contribute to the opacity. Below about 0.5 M☉, the luminosity of the star varies as the mass to the power of 2.3, producing a flattening of the slope on a graph of mass versus luminosity. Even these refinements are only an approximation, however, and the mass-luminosity relation can vary depending on a star's composition.[12]
Evolutionary tracks edit
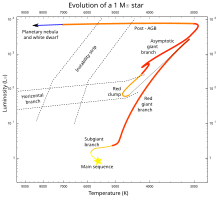
When a main-sequence star has consumed the hydrogen at its core, the loss of energy generation causes its gravitational collapse to resume and the star evolves off the main sequence. The path which the star follows across the HR diagram is called an evolutionary track.[57]
Stars with less than 0.23 M☉[58] are predicted to directly become white dwarfs when energy generation by nuclear fusion of hydrogen at their core comes to a halt, but stars in this mass range have main-sequence lifetimes longer than the current age of the universe, so no stars are old enough for this to have occurred.
In stars more massive than 0.23 M☉, the hydrogen surrounding the helium core reaches sufficient temperature and pressure to undergo fusion, forming a hydrogen-burning shell and causing the outer layers of the star to expand and cool. The stage as these stars move away from the main sequence is known as the subgiant branch; it is relatively brief and appears as a gap in the evolutionary track since few stars are observed at that point.
When the helium core of low-mass stars becomes degenerate, or the outer layers of intermediate-mass stars cool sufficiently to become opaque, their hydrogen shells increase in temperature and the stars start to become more luminous. This is known as the red-giant branch; it is a relatively long-lived stage and it appears prominently in H–R diagrams. These stars will eventually end their lives as white dwarfs.[59][60]
The most massive stars do not become red giants; instead, their cores quickly become hot enough to fuse helium and eventually heavier elements and they are known as supergiants. They follow approximately horizontal evolutionary tracks from the main sequence across the top of the H–R diagram. Supergiants are relatively rare and do not show prominently on most H–R diagrams. Their cores will eventually collapse, usually leading to a supernova and leaving behind either a neutron star or black hole.[61]
When a cluster of stars is formed at about the same time, the main-sequence lifespan of these stars will depend on their individual masses. The most massive stars will leave the main sequence first, followed in sequence by stars of ever lower masses. The position where stars in the cluster are leaving the main sequence is known as the turnoff point. By knowing the main-sequence lifespan of stars at this point, it becomes possible to estimate the age of the cluster.[62]
See also edit
Notes edit
- ^ By measuring the difference between these values, eliminates the need to correct the magnitudes for distance. However, this can be affected by interstellar extinction.
- ^ The Sun is a typical type G2V star.
References edit
- ^ Longair, Malcolm S. (2006). The Cosmic Century: A History of Astrophysics and Cosmology. Cambridge University Press. pp. 25–26. ISBN 978-0-521-47436-8.
- ^ a b Brown, Laurie M.; Pais, Abraham; Pippard, A. B., eds. (1995). Twentieth Century Physics. Bristol; New York: Institute of Physics, American Institute of Physics. p. 1696. ISBN 978-0-7503-0310-1. OCLC 33102501.
- ^ a b Russell, H. N. (1913). ""Giant" and "dwarf" stars". The Observatory. 36: 324–329. Bibcode:1913Obs....36..324R.
- ^ Strömgren, Bengt (1933). "On the Interpretation of the Hertzsprung-Russell-Diagram". Zeitschrift für Astrophysik. 7: 222–248. Bibcode:1933ZA......7..222S.
- ^ Schatzman, Evry L.; Praderie, Francoise (1993). The Stars. Springer. pp. 96–97. ISBN 978-3-540-54196-7.
- ^ Morgan, W. W.; Keenan, P. C.; Kellman, E. (1943). An atlas of stellar spectra, with an outline of spectral classification. Chicago, Illinois: The University of Chicago press. Retrieved 2008-08-12.
- ^ a b c Unsöld, Albrecht (1969). The New Cosmos. Springer-Verlag New York Inc. p. 268. ISBN 978-0-387-90886-1.
- ^ Kelly, Patrick L.; et al. (2 April 2018). "Extreme magnification of an individual star at redshift 1.5 by a galaxy-cluster lens". Nature. 2 (4): 334–342. arXiv:1706.10279. Bibcode:2018NatAs...2..334K. doi:10.1038/s41550-018-0430-3. S2CID 125826925.
- ^ Howell, Elizabeth (2 April 2018). "Rare Cosmic Alignment Reveals Most Distant Star Ever Seen". Space.com. Retrieved 2 April 2018.
- ^ "The Brightest Stars Don't Live Alone". ESO Press Release. Retrieved 27 July 2012.
- ^ Gloeckler, George; Geiss, Johannes (2004). "Composition of the local interstellar medium as diagnosed with pickup ions". Advances in Space Research. 34 (1): 53–60. Bibcode:2004AdSpR..34...53G. doi:10.1016/j.asr.2003.02.054.
- ^ a b c Kroupa, Pavel (2002). "The Initial Mass Function of Stars: Evidence for Uniformity in Variable Systems". Science. 295 (5552): 82–91. arXiv:astro-ph/0201098. Bibcode:2002Sci...295...82K. doi:10.1126/science.1067524. PMID 11778039. S2CID 14084249. Retrieved 2007-12-03.
- ^ Schilling, Govert (2001). "New Model Shows Sun Was a Hot Young Star". Science. 293 (5538): 2188–2189. doi:10.1126/science.293.5538.2188. PMID 11567116. S2CID 33059330.
- ^ "Zero Age Main Sequence". The SAO Encyclopedia of Astronomy. Swinburne University. Retrieved 2007-12-09.
- ^ Hansen, Carl J.; Kawaler, Steven D. (1999), Stellar Interiors: Physical Principles, Structure, and Evolution, Astronomy and Astrophysics Library, Springer Science & Business Media, p. 39, ISBN 978-0-387-94138-7
- ^ a b c d Clayton, Donald D. (1983). Principles of Stellar Evolution and Nucleosynthesis. University of Chicago Press. ISBN 978-0-226-10953-4.
- ^ Pettersen, B. R.; Hawley, S. L. (1989-06-01). "A spectroscopic survey of red dwarf flare stars". Astronomy and Astrophysics. 217: 187–200. Bibcode:1989A&A...217..187P. ISSN 0004-6361.
- ^ "Main Sequence Stars". Australia Telescope Outreach and Education. Archived from the original on 2021-11-25.
- ^ Harding E. Smith (21 April 1999). "The Hertzsprung-Russell Diagram". Gene Smith's Astronomy Tutorial. Center for Astrophysics & Space Sciences, University of California, San Diego. Retrieved 2009-10-29.
- ^ Richard Powell (2006). "The Hertzsprung Russell Diagram". An Atlas of the Universe. Retrieved 2009-10-29.
- ^ Moore, Patrick (2006). The Amateur Astronomer. Springer. ISBN 978-1-85233-878-7.
- ^ "White Dwarf". COSMOS—The SAO Encyclopedia of Astronomy. Swinburne University. Retrieved 2007-12-04.
- ^ "Origin of the Hertzsprung-Russell Diagram". University of Nebraska. Retrieved 2007-12-06.
- ^ "A course on stars' physical properties, formation and evolution" (PDF). University of St. Andrews. Retrieved 2010-05-18.
- ^ Siess, Lionel (2000). "Computation of Isochrones". Institut d'astronomie et d'astrophysique, Université libre de Bruxelles. Archived from the original on 2014-01-10. Retrieved 2007-12-06.—Compare, for example, the model isochrones generated for a ZAMS of 1.1 solar masses. This is listed in the table as 1.26 times the solar luminosity. At metallicity Z=0.01 the luminosity is 1.34 times solar luminosity. At metallicity Z=0.04 the luminosity is 0.89 times the solar luminosity.
- ^ Zombeck, Martin V. (1990). Handbook of Space Astronomy and Astrophysics (2nd ed.). Cambridge University Press. ISBN 978-0-521-34787-7. Retrieved 2007-12-06.
- ^ "SIMBAD Astronomical Database". Centre de Données astronomiques de Strasbourg. Retrieved 2008-11-21.
- ^ Luck, R. Earle; Heiter, Ulrike (2005). "Stars within 15 Parsecs: Abundances for a Northern Sample". The Astronomical Journal. 129 (2): 1063–1083. Bibcode:2005AJ....129.1063L. doi:10.1086/427250.
- ^ Staff (1 January 2008). "List of the Nearest Hundred Nearest Star Systems". Research Consortium on Nearby Stars. Archived from the original on 13 May 2012. Retrieved 2008-08-12.
- ^ a b c d Brainerd, Jerome James (16 February 2005). "Main-Sequence Stars". The Astrophysics Spectator. Retrieved 2007-12-04.
- ^ a b c Karttunen, Hannu (2003). Fundamental Astronomy. Springer. ISBN 978-3-540-00179-9.
- ^ Bahcall, John N.; Pinsonneault, M. H.; Basu, Sarbani (2003). "Solar Models: Current Epoch and Time Dependences, Neutrinos, and Helioseismological Properties". The Astrophysical Journal. 555 (2): 990–1012. arXiv:astro-ph/0212331. Bibcode:2001ApJ...555..990B. doi:10.1086/321493. S2CID 13798091.
- ^ Salaris, Maurizio; Cassisi, Santi (2005). Evolution of Stars and Stellar Populations. John Wiley and Sons. p. 128. ISBN 978-0-470-09220-0.
- ^ Oey, M. S.; Clarke, C. J. (2005). "Statistical Confirmation of a Stellar Upper Mass Limit". The Astrophysical Journal. 620 (1): L43–L46. arXiv:astro-ph/0501135. Bibcode:2005ApJ...620L..43O. doi:10.1086/428396. S2CID 7280299.
- ^ Ziebarth, Kenneth (1970). "On the Upper Mass Limit for Main-Sequence Stars". Astrophysical Journal. 162: 947–962. Bibcode:1970ApJ...162..947Z. doi:10.1086/150726.
- ^ Burrows, Adam; Hubbard, William B.; Saumon, Didier; Lunine, Jonathan I. (1993). "An expanded set of brown dwarf and very low mass star models". Astrophysical Journal. 406 (1): 158–71. Bibcode:1993ApJ...406..158B. doi:10.1086/172427.
- ^ Aller, Lawrence H. (1991). Atoms, Stars, and Nebulae. Cambridge University Press. ISBN 978-0-521-31040-6.
- ^ Bressan, A. G.; Chiosi, C.; Bertelli, G. (1981). "Mass loss and overshooting in massive stars". Astronomy and Astrophysics. 102 (1): 25–30. Bibcode:1981A&A...102...25B.
- ^ Lochner, Jim; Gibb, Meredith; Newman, Phil (6 September 2006). "Stars". NASA. Archived from the original on 2014-11-19. Retrieved 2007-12-05.
- ^ Gough, D. O. (1981). "Solar interior structure and luminosity variations". Solar Physics. 74 (1): 21–34. Bibcode:1981SoPh...74...21G. doi:10.1007/BF00151270. S2CID 120541081.
- ^ Padmanabhan, Thanu (2001). Theoretical Astrophysics. Cambridge University Press. ISBN 978-0-521-56241-6.
- ^ Wright, J. T. (2004). "Do We Know of Any Maunder Minimum Stars?". The Astronomical Journal. 128 (3): 1273–1278. arXiv:astro-ph/0406338. Bibcode:2004AJ....128.1273W. doi:10.1086/423221. S2CID 118975831. Retrieved 2007-12-06.
- ^ Tayler, Roger John (1994). The Stars: Their Structure and Evolution. Cambridge University Press. ISBN 978-0-521-45885-6.
- ^ Sweet, I. P. A.; Roy, A. E. (1953). "The structure of rotating stars". Monthly Notices of the Royal Astronomical Society. 113 (6): 701–715. Bibcode:1953MNRAS.113..701S. doi:10.1093/mnras/113.6.701.
- ^ Burgasser, Adam J.; Kirkpatrick, J. Davy; Lépine, Sébastien (5–9 July 2004). Spitzer Studies of Ultracool Subdwarfs: Metal-poor Late-type M, L and T Dwarfs. Proceedings of the 13th Cambridge Workshop on Cool Stars, Stellar Systems and the Sun. Hamburg, Germany: Dordrecht, D. Reidel Publishing Co. p. 237. Bibcode:2005ESASP.560..237B. Retrieved 2007-12-06.
- ^ Green, S. F.; Jones, Mark Henry; Burnell, S. Jocelyn (2004). An Introduction to the Sun and Stars. Cambridge University Press. ISBN 978-0-521-54622-5.
- ^ Richmond, Michael W. (10 November 2004). "Stellar evolution on the main sequence". Rochester Institute of Technology. Retrieved 2007-12-03.
- ^ a b Prialnik, Dina (2000). An Introduction to the Theory of Stellar Structure and Evolution. Cambridge University Press. ISBN 978-0-521-65937-6.
- ^ Schröder, K.-P.; Connon Smith, Robert (May 2008). "Distant future of the Sun and Earth revisited". Monthly Notices of the Royal Astronomical Society. 386 (1): 155–163. arXiv:0801.4031. Bibcode:2008MNRAS.386..155S. doi:10.1111/j.1365-2966.2008.13022.x. S2CID 10073988.
- ^ Arnett, David (1996). Supernovae and Nucleosynthesis: An Investigation of the History of Matter, from the Big Bang to the Present. Princeton University Press. ISBN 978-0-691-01147-9.—Hydrogen fusion produces 8×10¹⁴ J/kg while helium fusion produces 8×10¹³ J/kg.
- ^ For a detailed historical reconstruction of the theoretical derivation of this relationship by Eddington in 1924, see: Lecchini, Stefano (2007). How Dwarfs Became Giants. The Discovery of the Mass-Luminosity Relation. Bern Studies in the History and Philosophy of Science. ISBN 978-3-9522882-6-9.
- ^ a b Rolfs, Claus E.; Rodney, William S. (1988). Cauldrons in the Cosmos: Nuclear Astrophysics. University of Chicago Press. ISBN 978-0-226-72457-7.
- ^ Sackmann, I.-Juliana; Boothroyd, Arnold I.; Kraemer, Kathleen E. (November 1993). "Our Sun. III. Present and Future". Astrophysical Journal. 418: 457–468. Bibcode:1993ApJ...418..457S. doi:10.1086/173407.
- ^ Hansen, Carl J.; Kawaler, Steven D. (1994). Stellar Interiors: Physical Principles, Structure, and Evolution. Birkhäuser. p. 28. ISBN 978-0-387-94138-7.
- ^ Laughlin, Gregory; Bodenheimer, Peter; Adams, Fred C. (1997). "The End of the Main Sequence". The Astrophysical Journal. 482 (1): 420–432. Bibcode:1997ApJ...482..420L. doi:10.1086/304125.
- ^ Imamura, James N. (7 February 1995). "Mass-Luminosity Relationship". University of Oregon. Archived from the original on 14 December 2006. Retrieved 8 January 2007.
- ^ Icko Iben (29 November 2012). Stellar Evolution Physics. Cambridge University Press. pp. 1481–. ISBN 978-1-107-01657-6.
- ^ Adams, Fred C.; Laughlin, Gregory (April 1997). "A Dying Universe: The Long Term Fate and Evolution of Astrophysical Objects". Reviews of Modern Physics. 69 (2): 337–372. arXiv:astro-ph/9701131. Bibcode:1997RvMP...69..337A. doi:10.1103/RevModPhys.69.337. S2CID 12173790.
- ^ Staff (12 October 2006). "Post-Main Sequence Stars". Australia Telescope Outreach and Education. Archived from the original on 20 January 2013. Retrieved 2008-01-08.
- ^ Girardi, L.; Bressan, A.; Bertelli, G.; Chiosi, C. (2000). "Evolutionary tracks and isochrones for low- and intermediate-mass stars: From 0.15 to 7 Msun, and from Z=0.0004 to 0.03". Astronomy and Astrophysics Supplement. 141 (3): 371–383. arXiv:astro-ph/9910164. Bibcode:2000A&AS..141..371G. doi:10.1051/aas:2000126. S2CID 14566232.
- ^ Sitko, Michael L. (24 March 2000). "Stellar Structure and Evolution". University of Cincinnati. Archived from the original on 26 March 2005. Retrieved 2007-12-05.
- ^ Krauss, Lawrence M.; Chaboyer, Brian (2003). "Age Estimates of Globular Clusters in the Milky Way: Constraints on Cosmology". Science. 299 (5603): 65–69. Bibcode:2003Sci...299...65K. doi:10.1126/science.1075631. PMID 12511641. S2CID 10814581.
Further reading edit
General edit
- Kippenhahn, Rudolf, 100 Billion Suns, Basic Books, New York, 1983.
Technical edit
- Arnett, David (1996). Supernovae and Nucleosynthesis. Princeton: Princeton University Press.
- Bahcall, John N. (1989). Neutrino Astrophysics. Cambridge: Cambridge University Press. ISBN 978-0-521-37975-5.
- Bahcall, John N.; Pinsonneault, M.H.; Basu, Sarbani (2001). "Solar Models: Current Epoch and Time Dependences, Neutrinos, and Helioseismological Properties". The Astrophysical Journal. 555 (2): 990–1012. arXiv:astro-ph/0010346. Bibcode:2001ApJ...555..990B. doi:10.1086/321493. S2CID 13798091.
- Barnes, C. A.; Clayton, D. D.; Schramm, D. N., eds. (1982). Essays in Nuclear Astrophysics. Cambridge: Cambridge University Press.
- Bowers, Richard L.; Deeming, Terry (1984). Astrophysics I: Stars. Boston: Jones and Bartlett.
- Carroll, Bradley W. & Ostlie, Dale A. (2007). An Introduction to Modern Astrophysics. San Francisco: Pearson Education Addison-Wesley. ISBN 978-0-8053-0402-2.
- Chabrier, Gilles; Baraffe, Isabelle (2000). "Theory of Low-Mass Stars and Substellar Objects". Annual Review of Astronomy and Astrophysics. 38: 337–377. arXiv:astro-ph/0006383. Bibcode:2000ARA&A..38..337C. doi:10.1146/annurev.astro.38.1.337. S2CID 59325115.
- Chandrasekhar, S. (1967). An Introduction to the study of stellar Structure. New York: Dover.
- Clayton, Donald D. (1983). Principles of Stellar Evolution and Nucleosynthesis. Chicago: University of Chicago. ISBN 978-0-226-10952-7.
- Cox, J. P.; Giuli, R. T. (1968). Principles of Stellar Structure. New York City: Gordon and Breach.
- Fowler, William A.; Caughlan, Georgeanne R.; Zimmerman, Barbara A. (1967). "Thermonuclear Reaction Rates, I". Annual Review of Astronomy and Astrophysics. 5: 525. Bibcode:1967ARA&A...5..525F. doi:10.1146/annurev.aa.05.090167.002521.
- Fowler, William A.; Caughlan, Georgeanne R.; Zimmerman, Barbara A. (1975). "Thermonuclear Reaction Rates, II". Annual Review of Astronomy and Astrophysics. 13: 69. Bibcode:1975ARA&A..13...69F. doi:10.1146/annurev.aa.13.090175.000441.
- Hansen, Carl J.; Kawaler, Steven D.; Trimble, Virginia (2004). Stellar Interiors: Physical Principles, Structure, and Evolution, Second Edition. New York: Springer-Verlag.
- Harris, Michael J.; Fowler, William A.; Caughlan, Georgeanne R.; Zimmerman, Barbara A. (1983). "Thermonuclear Reaction Rates, III". Annual Review of Astronomy and Astrophysics. 21: 165. Bibcode:1983ARA&A..21..165H. doi:10.1146/annurev.aa.21.090183.001121.
- Iben, Icko Jr (1967). "Stellar Evolution Within and Off the Main Sequence". Annual Review of Astronomy and Astrophysics. 5: 571. Bibcode:1967ARA&A...5..571I. doi:10.1146/annurev.aa.05.090167.003035.
- Iglesias, Carlos A.; Rogers, Forrest J. (1996). "Updated Opal Opacities". The Astrophysical Journal. 464: 943. Bibcode:1996ApJ...464..943I. doi:10.1086/177381.
- Kippenhahn, Rudolf; Weigert, Alfred (1990). Stellar Structure and Evolution. Berlin: Springer-Verlag.
- Liebert, James; Probst, Ronald G. (1987). "Very Low Mass Stars". Annual Review of Astronomy and Astrophysics. 25: 437. Bibcode:1987ARA&A..25..473L. doi:10.1146/annurev.aa.25.090187.002353.
- Novotny, Eva (1973). Introduction to Stellar Atmospheres and Interior. New York City: Oxford University Press.
- Padmanabhan, T. (2002). Theoretical Astrophysics. Cambridge: Cambridge University Press.
- Prialnik, Dina (2000). An Introduction to the Theory of Stellar Structure and Evolution. Cambridge: Cambridge University Press.
- Shore, Steven N. (2003). The Tapestry of Modern Astrophysics. Hoboken: John Wiley and Sons.