


Summary
MayaVi is a scientific data visualizer written in Python, which uses VTK and provides a GUI via Tkinter. MayaVi was developed by Prabhu Ramachandran, is free and distributed under the BSD License. It is cross-platform and runs on any platform where both Python and VTK are available (almost any Unix, Mac OS X, or Windows). MayaVi is pronounced as a single name, "Ma-ya-vee", meaning "magical" in Sanskrit. The code of MayaVi has nothing in common with that of Autodesk Maya or the Vi text editor.[2]
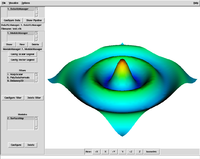 A screenshot of the main window, with an example visualization | |
| Developer(s) | Enthought |
|---|---|
| Initial release | 2019 |
| Stable release | 4.8.1
/ October 18, 2022[1] |
| Written in | Python, VTK, wxPython/Qt |
| Operating system | Linux, Mac OS X, Microsoft Windows |
| Available in | English |
| Type | Data visualization |
| License | BSD License |
| Website | docs |
The latest version of MayaVi, called Mayavi2, is a component of the Enthought suite of scientific Python programs. It differs from the original MayaVi by its strong focus on making an interactive program and a reusable component for 3D plotting in Python. Although it exposes a slightly different interface and API than the original MayaVi, it now has more features.[3][4]
Major features edit
- visualizes computational grids and scalar, vector, and tensor data
- an easy-to-use GUI
- can be imported as a Python module from other Python programs or can be scripted from the Python interpreter
- supports volume visualization of data via texture and ray cast mappers
- support for any VTK dataset using the VTK data format
- support for PLOT3D data
- multiple datasets can be used simultaneously
- provides a pipeline browser, with which objects in the VTK pipeline can be browsed and edited
- imports simple VRML and 3D Studio scenes
- custom modules and data filters can be added
- exporting to PostScript files, PPM/BMP/TIFF/JPEG/PNG images, Open Inventor, Geomview OOGL, VRML files, Wavefront .obj files, or RenderMan RIB file
Examples edit
Spherical harmonics edit


from numpy import linspace, meshgrid, array, sin, cos, pi, abs
from scipy.special import sph_harm
from mayavi import mlab

theta_1d = linspace(0,   pi,  91)
phi_1d   = linspace(0, 2*pi, 181)

theta_2d, phi_2d = meshgrid(theta_1d, phi_1d)
xyz_2d = array([sin(theta_2d) * sin(phi_2d),
                sin(theta_2d) * cos(phi_2d),
                cos(theta_2d)])
l = 3
m = 0

Y_lm = sph_harm(m, l, phi_2d, theta_2d)
r = abs(Y_lm.real) * xyz_2d

mlab.figure(size=(700, 830))
mlab.mesh(r[0], r[1], r[2], scalars=Y_lm.real, colormap="cool")
mlab.view(azimuth=0, elevation=75, distance=2.4, roll=-50)
mlab.savefig("Y_%i_%i.jpg" % (l, m))
mlab.show()
References edit
- ^ "mayavi · PyPI". pypi.org. Retrieved 2023-11-28.
- ^ "MayaVi project page". SourceForge.
- ^ "MayaVi2 wiki page".
- ^ "MayaVi2 project page".
External links edit
- mayavi on GitHub
- MayaVi on SourceForge