
KNOWPIA
WELCOME TO KNOWPIA

Meyenburg 
Summary
Meyenburg (German: [ˈmaɪ̯ənˌbʊʁk] ⓘ) is a town in the district of Prignitz, in Brandenburg, Germany. It is situated 23 km northwest of Wittstock, and 18 km northeast of Pritzwalk. The town contains Meyenburg Castle.
Meyenburg | |
|---|---|
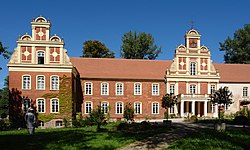 Meyenburg Castle | |
 Coat of arms | |
Location of Meyenburg within Prignitz district  | |
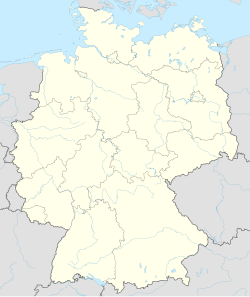 Meyenburg 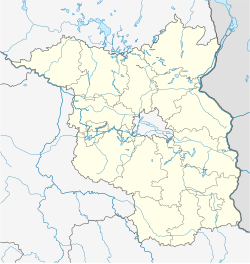 Meyenburg | |
| Coordinates: 53°19′00″N 12°13′59″E / 53.31667°N 12.23306°E | |
| Country | Germany |
| State | Brandenburg |
| District | Prignitz |
| Municipal assoc. | Meyenburg |
| Government | |
| • Mayor (2019–24) | Falko Krassowski[1] |
| Area | |
| • Total | 50.62 km2 (19.54 sq mi) |
| Elevation | 82 m (269 ft) |
| Population (2022-12-31)[2] | |
| • Total | 2,090 |
| • Density | 41/km2 (110/sq mi) |
| Time zone | UTC+01:00 (CET) |
| • Summer (DST) | UTC+02:00 (CEST) |
| Postal codes | 16945 |
| Dialling codes | 033968 |
| Vehicle registration | PR |
| Website | www.meyenburg.de |
History edit
From 1815 to 1945, Meyenburg was part of the Prussian Province of Brandenburg. From 1952 to 1990, it was part of the Bezirk Potsdam of East Germany.
Demography edit
-
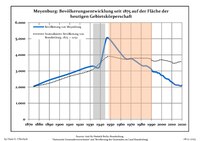 Changes in Population since 1875 within the Current Boundaries (Blue Line: Population; Dotted Line: Comparison to Population Changes of Brandenburg state; Grey Background: Nazi period; Orange Background: Communist period

|
|
References edit
- ^ Landkreis Prignitz Wahl der Bürgermeisterin / des Bürgermeisters, accessed 2 July 2021.
- ^ "Bevölkerungsentwicklung und Bevölkerungsstandim Land Brandenburg Dezember 2022" (PDF). Amt für Statistik Berlin-Brandenburg (in German). June 2023.
- ^ Detailed data sources are to be found in the Wikimedia Commons.Population Projection Brandenburg at Wikimedia Commons