


Summary
Mimasaka (美作市, Mimasaka-shi) is a city located in Okayama Prefecture, Japan. As of 31 January 2023[update], the city had an estimated population of 25,946 in 12287 households and a population density of 60 persons per km2.[1] The total area of the city is 429.29 square kilometres (165.75 sq mi).
Mimasaka
美作市 | |
|---|---|
 Main street in Ohara Mimasaka | |
 Flag  Emblem | |
Location of Mimasaka in Okayama Prefecture | |
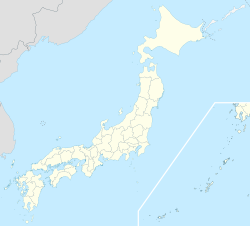 Mimasaka Location in Japan | |
| Coordinates: 35°0′31″N 134°8′55″E / 35.00861°N 134.14861°E | |
| Country | Japan |
| Region | Chūgoku (San'yō) |
| Prefecture | Okayama |
| Government | |
| • Mayor | Seiji Hagiwara <萩原誠司> (from March 2014) |
| Area | |
| • Total | 429.29 km2 (165.75 sq mi) |
| Population (January 31, 2023) | |
| • Total | 25,946 |
| • Density | 60/km2 (160/sq mi) |
| Time zone | UTC+09:00 (JST) |
| City hall address | 38-2 Sakaemachi, Mimasaka-shi, Okayama-ken 707-8501 |
| Climate | Cfa |
| Website | Official website |
| Symbols | |
| Flower | Erythronium japonicum |
| Tree | Prunus mume |

Geography edit
Mimasaka is located in northeast Okayama. Most of the city limits are hills and forests. The prefectural border is at the Chugoku Mountains, and there is Mount Ushiro (1344 meters), the highest peak in the prefecture is within the city limits. Parts of the city are considered to be heavy snowfall areas.
Adjoining municipalities edit
Climate edit
Mimasaka has a humid subtropical climate (Köppen climate classification Cfa). The average annual temperature in Mimasaka is 13.3 °C (55.9 °F). The average annual rainfall is 1,620.4 mm (63.80 in) with July as the wettest month. The temperatures are highest on average in August, at around 25.6 °C (78.1 °F), and lowest in January, at around 1.6 °C (34.9 °F).[2] The highest temperature ever recorded in Mimasaka was 38.5 °C (101.3 °F) on 7 August 1994; the coldest temperature ever recorded was −13.6 °C (7.5 °F) on 28 February 1981.[3]
| Climate data for Mimasaka (1991−2020 normals, extremes 1978−present) | |||||||||||||
|---|---|---|---|---|---|---|---|---|---|---|---|---|---|
| Month | Jan | Feb | Mar | Apr | May | Jun | Jul | Aug | Sep | Oct | Nov | Dec | Year |
| Record high °C (°F) | 15.5 (59.9) |
20.6 (69.1) |
24.6 (76.3) |
29.7 (85.5) |
32.0 (89.6) |
34.8 (94.6) |
36.8 (98.2) |
38.5 (101.3) |
35.1 (95.2) |
29.8 (85.6) |
24.3 (75.7) |
18.2 (64.8) |
38.5 (101.3) |
| Mean daily maximum °C (°F) | 6.6 (43.9) |
7.8 (46.0) |
12.1 (53.8) |
18.4 (65.1) |
23.4 (74.1) |
26.3 (79.3) |
29.9 (85.8) |
31.4 (88.5) |
27.1 (80.8) |
21.4 (70.5) |
15.2 (59.4) |
9.1 (48.4) |
19.1 (66.3) |
| Daily mean °C (°F) | 1.6 (34.9) |
2.4 (36.3) |
6.0 (42.8) |
11.6 (52.9) |
16.8 (62.2) |
20.8 (69.4) |
24.7 (76.5) |
25.6 (78.1) |
21.4 (70.5) |
15.2 (59.4) |
9.1 (48.4) |
3.8 (38.8) |
13.3 (55.9) |
| Mean daily minimum °C (°F) | −2.4 (27.7) |
−2.1 (28.2) |
0.5 (32.9) |
5.1 (41.2) |
10.6 (51.1) |
16.1 (61.0) |
20.7 (69.3) |
21.2 (70.2) |
16.9 (62.4) |
10.0 (50.0) |
4.1 (39.4) |
−0.5 (31.1) |
8.4 (47.0) |
| Record low °C (°F) | −11.1 (12.0) |
−13.6 (7.5) |
−7.9 (17.8) |
−4.4 (24.1) |
0.0 (32.0) |
5.1 (41.2) |
11.4 (52.5) |
12.9 (55.2) |
4.9 (40.8) |
−0.8 (30.6) |
−4.2 (24.4) |
−11.6 (11.1) |
−13.6 (7.5) |
| Average precipitation mm (inches) | 73.8 (2.91) |
81.4 (3.20) |
116.5 (4.59) |
126.9 (5.00) |
164.7 (6.48) |
193.6 (7.62) |
252.7 (9.95) |
163.5 (6.44) |
192.2 (7.57) |
109.2 (4.30) |
70.0 (2.76) |
75.9 (2.99) |
1,620.4 (63.80) |
| Average snowfall cm (inches) | 40 (16) |
35 (14) |
4 (1.6) |
0 (0) |
0 (0) |
0 (0) |
0 (0) |
0 (0) |
0 (0) |
0 (0) |
0 (0) |
19 (7.5) |
97 (38) |
| Average precipitation days (≥ 1.0 mm) | 11.2 | 11.8 | 11.9 | 10.4 | 10.7 | 12.4 | 12.9 | 10.2 | 10.4 | 8.5 | 8.0 | 9.6 | 128 |
| Average snowy days (≥ 3 cm) | 4.3 | 3.2 | 0.6 | 0 | 0 | 0 | 0 | 0 | 0 | 0 | 0 | 1.7 | 9.8 |
| Mean monthly sunshine hours | 107.8 | 117.2 | 156.0 | 193.8 | 204.9 | 149.4 | 150.6 | 188.0 | 150.7 | 160.1 | 134.5 | 121.5 | 1,832.9 |
| Source: Japan Meteorological Agency[2][3] | |||||||||||||
Demographics edit
Per Japanese census data, the population of Mimasaka in 2020 is 25,939 people.[4] Mimasaka has been conducting censuses since 1920.
| Year | Pop. | ±% |
|---|---|---|
| 1920 | 48,439 | — |
| 1925 | 48,519 | +0.2% |
| 1930 | 48,222 | −0.6% |
| 1935 | 47,435 | −1.6% |
| 1940 | 46,164 | −2.7% |
| 1945 | 59,880 | +29.7% |
| 1950 | 60,755 | +1.5% |
| 1955 | 57,761 | −4.9% |
| 1960 | 52,598 | −8.9% |
| 1965 | 45,973 | −12.6% |
| 1970 | 40,731 | −11.4% |
| 1975 | 38,793 | −4.8% |
| 1980 | 38,430 | −0.9% |
| 1985 | 38,309 | −0.3% |
| 1990 | 36,942 | −3.6% |
| 1995 | 36,140 | −2.2% |
| 2000 | 34,577 | −4.3% |
| 2005 | 32,479 | −6.1% |
| 2010 | 30,504 | −6.1% |
| 2015 | 27,977 | −8.3% |
| 2020 | 25,939 | −7.3% |
| Mimasaka population statistics[4] | ||
History edit
The area of Mimasaka is part of ancient Mimasaka Province, from which it takes its name. The Hayashino district, which is the center of the city, has long been an important transportation hub, and since the Sengoku period, goods have been transported by boats crossing the Yoshii River. In the Edo period, the Mori clan, who were the first daimyō of Tsuyama Domain, gave local merchants the same level of authority as merchants in the castle town of Tsuyama, making it the center of eastern Mimasaka. Afterwards, it came under the direct control of the Tokugawa shogunate and a magistrate's office was established. The famed samurai Miyamoto Musashi was born in what is now part of the city.
The modern city of Mimasaka was founded on March 31, 2005 by the merger of the former town of Mimasaka, absorbing the towns of Aida, Ōhara and Sakutō, the village Higashiawakura (all from Aida District), and the town of Katsuta (from Katsuta District).
Government edit
Mimasaka has a mayor-council form of government with a directly elected mayor and a unicameral city council of 18 members. Mimasaka, collectively with the village of Nishiawakura, contributes one member to the Okayama Prefectural Assembly. In terms of national politics, the city is part of the Okayama 3rd district of the lower house of the Diet of Japan.
Economy edit
Mimasaka has a mixed economy based on manufacturing, wholesale and retail commerce, agriculture, forestry, and tourism (hot springs).
Education edit
Mimasaka has nine public elementary schools and five public junior high school operated by the city government, and one public high school operated by the Okayama prefectural Board of Education.
Transportation edit
Railway edit
![]() JR West (JR West) - Kishin Line
JR West (JR West) - Kishin Line
Highways edit
Sister and Friendship cities edit
- Former Ōhara town
- Former Sakutō town
 Saint-Valentin, France — Sister city agreement concluded on April 6, 1988
 Sankt Valentin, Austria — Sister city agreement concluded on October 25, 1994
 Saint-Valentin, Canada — Sister city agreement concluded on October 24, 1997
Local attractions edit
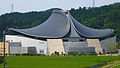
- Miyamoto Musashi Budokan
- Yunogo Onsen
- Okayama International Circuit
- Village of Miyamoto Musashi
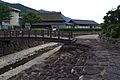
- Ōhara-shuku (Shukuba)
- Valentine Park Sakutō
- Chōfuku-ji Temple
- Japan museum of contemporary toy & Hall of music box
-
-
 Village of Miyamoto Musashi
 -
 Ōhara-shuku
 -
 Chōfuku-ji Temple


Notable people from Mimasaka edit
- Miyamoto Musashi, noted samurai in the Edo Period
- Tomoji Abe, author
- Doshin So, founder of Shorinji Kempo
- Atsuko Asano, author
References edit
External links edit
- Mimasaka City official website (in Japanese)
- 美作国, Dojo Miyamoto Musashi Gleizé (in French)