


Summary
Modified gross national income (also Modified GNI or GNI*) is a metric used by the Central Statistics Office (Ireland) to measure the Irish economy rather than GNI or GDP. GNI* is GNI minus the depreciation on Intellectual Property, depreciation on leased aircraft and the net factor income of redomiciled PLCs.

While "Inflated GDP-per-capita" due to BEPS tools is a feature of tax havens,[1][2] Ireland was the first to adjust its GDP metrics. Economists, including Eurostat,[3] noted Irish Modified GNI (GNI*) is still distorted by Irish BEPS tools and US multinational tax planning activities in Ireland (e.g. contract manufacturing); and that Irish BEPS tools distort aggregate EU-28 data,[4] and the EU-US trade deficit.[5]
In August 2018, the Central Statistics Office (Ireland) (CSO) restated table of Irish GDP versus Modified GNI (2009–2017) showed GDP was 162% of GNI* (EU-28 2017 GDP was 100% of GNI).[6] Ireland's public § 2018 Debt metrics differ dramatically depending on whether Debt-to-GDP, Debt-to-GNI* or Debt-per-Capita is used.[7]
Original distortion edit

In February 1994, tax academic James R. Hines Jr., identified Ireland as one of seven major tax havens in his 1994 Hines-Rice paper,[10] still[as of?] the most cited paper in research on tax havens.[11] Hines noted that the profit shifting tools of US multinationals in corporate-focused tax havens distorted the national economic statistics of the haven as the scale of the profit shifting was disproportionate to haven's economy. An elevated GDP-per-capita became a "proxy indicator" of a tax haven.[2]
In November 2005, the Wall Street Journal reported that US technology and life sciences multinationals (e.g. Microsoft), were using an Irish base erosion and profit shifting ("BEPS") tool called the double Irish, to minimise their corporate taxes.[12][13] Designed by PwC (Ireland) tax partner, Feargal O'Rourke,[14][15] the double Irish would become the largest BEPS tool in history, and would enable US multinationals to accumulate over US$1 trillion in untaxed offshore profits.[16]
The accounting flows of BEPS tools can appear in national economic statistics, varying with each tool, but without contributing to the economy of the tax haven.[2]
Subsequent US Senate (2013), and EU Commission (2014–2016) investigations, into Apple's Irish tax structure, would show that starting in 2004, Apple's Irish subsidiary, Apple Sales International ("ASI"), would almost double the untaxed profits shifted through its double Irish BEPS tool every year, for a decade.[17]
| Year |
ASI profit shifted (USD m) |
Average €/$ rate |
ASI profit shifted (EUR m) |
Irish corp. tax rate |
Irish corp. tax avoided (EUR m) |
|---|---|---|---|---|---|
| 2004 | 268 | .805 | 216 | 12.5% | 27 |
| 2005 | 725 | .804 | 583 | 12.5% | 73 |
| 2006 | 1,180 | .797 | 940 | 12.5% | 117 |
| 2007 | 1,844 | .731 | 1,347 | 12.5% | 168 |
| 2008 | 3,127 | .683 | 2,136 | 12.5% | 267 |
| 2009 | 4,003 | .719 | 2,878 | 12.5% | 360 |
| 2010 | 12,095 | .755 | 9,128 | 12.5% | 1,141 |
| 2011 | 21,855 | .719 | 15,709 | 12.5% | 1,964 |
| 2012 | 35,877 | .778 | 27,915 | 12.5% | 3,489 |
| 2013 | 32,099 | .753 | 24,176 | 12.5% | 3,022 |
| 2014 | 34,229 | .754 | 25,793 | 12.5% | 3,224 |
| Total | 147,304 | 110,821 | 13,853 |
From 2003 to 2007, research has shown that inflated Irish GDP from US multinational BEPS tools,[18] amplified the Irish Celtic Tiger period by stimulating Irish consumer optimism, who increased borrowing to OECD record levels; and global capital markets optimism about Ireland enabling Irish banks to borrow 180% of Irish deposits.[19]
This unwound in the economic crisis as global capital markets, who had ignored Ireland's deteriorating credit metrics and distorted GDP data when Irish GDP was rising, withdrew and precipitated an Irish property and banking collapse in 2009–2012.[18][20]
The 2009–2012 Irish economic collapse led to a transfer of indebtedness from the Irish private sector balance sheet, the most leveraged in the OECD with household debt-to-income at 190%, to the Irish public sector balance sheet, which was almost unleveraged pre-crisis. This was done via Irish bank bailouts and public deficit spending.[21][22]
2009 distortion restarts edit

During the Irish financial crisis from 2009 to 2012, two catalysts would restart the distortion of Irish economic statistics:
- The crisis caused the Irish State to look for new BEPS tools, and in September 2009, the Commission on Taxation,[24][25] recommended extending Irish capital allowances to intangible assets and intellectual property in particular; the "capital allowances for intangible assets" or "Green Jersey" BEPS tool, was created in the 2009 Finance Act; it would spur a new wave of US corporate tax inversions to Ireland;
- Irish-based US technology firms such as Apple and Google entered a stronger phase of growth; for example, in 2007, Apple's Irish ASI subsidiary was profit shifting just under USD 2 billion of untaxed global income through its hybrid-double Irish BEPS tool, however by 2012, ASI was profit shifting just under USD 36 billion of untaxed global income through Ireland, although only a small amount of this BEPS tool appeared in Irish GDP.[17]
In 2010, Hines published a new list of 52 global tax havens, the Hines 2010 list, which ranked Ireland as the 3rd largest tax haven in the world.[26]
By 2011, Eurostat showed that Ireland's ratio of GNI to GDP, had fallen to 80% (i.e. Irish GDP was 125% of Irish GNI, or artificially inflated by 25%). Only Luxembourg, who ranked 1st on Hines' 2010 list of global tax havens,[26] was lower at 73% (i.e. Luxembourg GDP was 137% of Luxembourg GNI). Eurostat's GNI/GDP table (see graphic) showed EU GDP is equal to EU GNI for almost every EU country, and for the aggregate EU-27 average.[18][27]
In 2013–2015 several large US life sciences multinationals executed tax inversions to Ireland (e.g. Medtronic). Ireland became the largest recipient of US corporate tax inversions in history.[28] The Irish BEPS tool enabled US multinationals to avoid almost all Irish corporate taxes, however, unlike other Irish BEPS tools, it registers fully in Irish economic statistics.[29] In April 2016, the Obama Administration blocked the proposed US$160 billion proposed Pfizer-Allergan Irish inversion.[30]
A 2015 EU Commission report into Ireland's economic statistics, showed that from 2010 to 2015, almost 23% of Ireland's GDP was now represented by untaxed multinational net royalty payments, thus implying that Irish GDP was now circa 130% of Irish GNI.[31] This analysis, however, did not capture the full effect of the BEPS tool as it uses capital allowances, rather than royalty payments, to execute the BEPS movement. The Irish media were also confused as to Ireland's state of indebtedness as Irish Debt-per-Capita diverged sharply from Irish Debt-to GDP.[32][33][34]
2016 distortion climax edit

By 2012–14, Apple's Irish subsidiary, ASI, was profit shifting circa US$35 billion per annum through Ireland, equivalent to 20% of Irish GDP, via its hybrid-double Irish BEPS tool.[17] However, this particular BEPS tool had a modest impact on Irish GDP data. In late 2014, to limit further exposure to fines from the EU Commission's investigation into Apple's Irish tax schemes, Apple closed its hybrid-double Irish BEPS tool,[35] and decided to swap into the BEPS tool.[36][37] In Q1 2015, Apple Ireland purchased circa US$300 billion of virtual IP assets owned by Apple Jersey, executing the largest BEPS action in history.[17][38]

The BEPS tool is recorded like a tax inversion in the Irish national accounts.[38] Because Apple's IP was now on-shored in Ireland, all of ASI's circa US$40 billion in profit shifting for 2015, appeared in 2015 Irish GDP and GNP, despite the fact that new BEPS tool would limit Apple's exposure to Irish corporation tax.
In July 2016, the Irish Central Statistice Office announced 2015 Irish economic growth rates of 26.3% (GDP) and 18.7% (GNP), as a result of Apple's restructuring.[39] The announcement led to ridicule,[40][41][42][43][44][45][46] and was labelled by Nobel Prize economist Paul Krugman as "leprechaun economics".[47]
From July 2016 to July 2018, the Central Statistics Office refused to identify the source of leprechaun economics, and suppressed the release of other economic data to protect Apple's identity under the 1993 Central Statistics Act,[48][49] in the manner of a "captured state", further damaging confidence in Ireland.[50]
By early 2017, research in the Sloan School of Management in the Massachusetts Institute of Technology, using the limited data released by the Irish CSO, could conclude: While corporate inversions and aircraft leasing firms were credited for increasing Irish [2015] GDP, the impact may have been exaggerated.[51] The same research noted that capital markets did not consider Irish macro economic statistics to be credible or meaningful, as evidenced by the lack of any reaction by the capital markets to Ireland's 26.3% GDP growth (both on the day of release, and in the subsequent days).[51]
Where as the Obama Administration blocked the proposed US$160 billion Pfizer-Allergan Irish inversion in 2016, Apple's larger US$300 billion Irish inversion was ignored. It is not clear if this was due to the confusion caused by the Central Statistics Office (Ireland) in protecting Apple's identity for 2 years, or other reasons.
2017 GNI* response edit

In September 2016, as a direct result of the "leprechaun economics" affair, the Governor of the Central Bank of Ireland ("CBI"), Philip R. Lane, chaired a special cross-economic steering group, the Economic Statistics Review Group ("ESRG"), of stakeholders (incl. CBI, IFAC, ESRI, NTMA, leading academics and the Department of Finance), to recommend new economic statistics that would better represent the true position of the Irish economy.[52]
In February 2017, a new metric, "Modified Gross National Income" (or GNI* for short) was announced. The difference between GNI* and GNI is due to having to deal with two problems (a) The retained earnings of re-domiciled firms in Ireland (where the earnings ultimately accrue to foreign investors), and (b) depreciation on foreign-owned capital assets located in Ireland, such as intellectual property (which inflate the size of Irish GDP, but again the benefits accrue to foreign investors).[53][54]
The Central Statistics Office (Ireland) ("CSO") simplifies the definition of Irish modified GNI (or GNI*) as follows:
Irish GNI less the effects of the profits of re-domiciled companies and the depreciation of intellectual property products and aircraft leasing companies.[55]
In February 2017, the CSO stated they would continue to calculate and release Irish GDP and Irish GNP to meet their EU and other International statistical reporting commitments.[56] In July 2017, the CSO estimated that 2016 Irish GNI* (€190bn) was 30% below Irish GDP (€275bn), or that Irish GDP is 143% above Irish GNI*. The CSO also confirmed that Irish Net Public Debt-to-GNI* was 106% (Irish Net Public Debt-to-GDP, post leprechaun economics, was 73%).[57][58]
In December 2017, Eurostat noted that while GNI* was helpful, it was still being artificially inflated by BEPS flows, and the BEPS activities of certain types of contract manufacturing in particular;[3] a view shared by several others.[18][59][60][61][62][63] There have been several material revisions to Irish 2015 GDP in particular (as per § Irish GDP versus Modified GNI (2009–2017).[64] Modified GNI, or GNI*, was adopted by the IMF and OECD in their 2017 Ireland Country Reports.[65][66]
Economists noted in May 2018 that distorted Irish economic data was calling into question the credibility of Eurostat's aggregate EU-28 economic data.[4]
In June 2018, tax academic Gabriel Zucman, using 2015 economic data, claimed Irish BEPS tools had made Ireland the world's largest tax haven (Zucman-Tørsløv-Wier 2018 list).[67][68] Zucman also showed that Irish BEPS flows were becoming so large, that they were artificially exaggerating the scale of the EU-US trade deficit.[5]
Another study published in June 2018 by the IMF called into question the economic data of all leading tax havens, and the artificial effect of their BEPS tools.[1][69]
2018 debt metrics edit

The issues post leprechaun economics, and "modified GNI", are captured on page 34 of the OECD 2018 Ireland survey:[66]
- On a gross public debt-to-GDP basis, Ireland's 2015 figure at 78.8% is not of concern;
- On a gross public debt-to-GNI* basis, Ireland's 2015 figure at 116.5% is more serious, but not alarming;
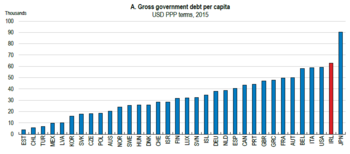
- On a gross public debt-per-capita basis, Ireland's 2015 figure at over $62,686 per capita, is the second highest in the OECD, after Japan.[71]
There is concern Ireland repeats the mistakes of the "Celtic Tiger" era, and over-leverages again, against distorted Irish economic data.[59] Given the transfer of Irish private sector debt to the Irish public balance sheet from the Irish 2009–2012 financial crisis, it will not be possible to bail out the Irish banking system again.
- In June 2017, the Irish Fiscal Advisory Council benchmarked Irish public debt against Irish tax revenues (similar to the debt-to-EBITDA ratio used in capital markets). Ireland's 2016 gross public debt-to-tax revenues was 282.9%, the 4th highest in the EU-28 (after Greece, Portugal, and Cyprus).[72][73][74]
- In November 2017, the Central Bank of Ireland benchmarked Irish private debt against Irish disposable income. Ireland's 2016 private debt as a % of Irish disposable income was 141.6%, the 4th highest in the EU-28 (after Netherlands, Denmark and Sweden).[75][76]
These two initiatives show Ireland's high public debt levels, and Ireland's high private sector debt levels, imply that on a "total debt" basis (i.e. Irish public debt plus Irish private debt), Ireland is likely one of the most indebted of the EU-27 countries when benchmarked on a GNI*-type basis; hence the importance of a GNI* metric.[citation needed]
Irish GDP versus Modified GNI (2009–2018) edit
| Year |
Irish GDP |
Irish GNI* |
Irish GDP/GNI* ratio |
EU-28 GDP/GNI ratio | ||
|---|---|---|---|---|---|---|
| (€ bn) | YOY (%) |
(€ bn) | YOY (%) | |||
| 2009 | 170.1 | - | 134.8 | - | 126% | 100% |
| 2010 | 167.7 | -1.4% | 128.9 | -4.3% | 130% | 100% |
| 2011 | 171.1 | 2.0% | 126.6 | -1.8% | 135% | 100% |
| 2012 | 175.2 | 2.4% | 126.4 | -0.2% | 139% | 100% |
| 2013 | 179.9 | 2.7% | 136.9 | 8.3%‡ | 131% | 100% |
| 2014 | 195.3 | 8.6% | 148.3 | 8.3%‡ | 132% | 100% |
| 2015 | 262.5† | 34.4% | 161.4 | 8.8%‡ | 163% | 100% |
| 2016 | 273.2 | 4.1% | 175.8 | 8.9%‡ | 155% | 100% |
| 2017 | 294.1 | 7.6% | 181.2 | 3.1% | 162% | 100% |
| 2018^ | 324.0 | 8.2% | 197.5 | - | - | 100% |
(†) The Central Statistics Office (Ireland) revised 2015 GDP higher in 2017, increasing Ireland's "leprechaun economics" 2015 GDP growth rate from 26.3% to 34.4%.
(‡) Eurostat show that GNI* is also still distorted by certain BEPS tools, and specifically contract manufacturing, which is a significant activity in Ireland.[3]
See also edit
References edit
- ^ a b JANNICK DAMGAARD; THOMAS ELKJAER; NIELS JOHANNESEN (June 2018). "Piercing the Veil of Tax Havens". International Monetary Fund: Finance & Development Quarterly. 55 (2). Archived from the original on 12 June 2018. Retrieved 12 June 2018.
The eight major pass-through economies—the Netherlands, Luxembourg, Hong Kong SAR, the British Virgin Islands, Bermuda, the Cayman Islands, Ireland, and Singapore—host more than 85 percent of the world's investment in special purpose entities, which are often set up for tax reasons.
- ^ a b c Dhammika Dharmapala (2014). "What Do We Know About Base Erosion and Profit Shifting? A Review of the Empirical Literature". University of Chicago. Archived from the original on 20 July 2018. Retrieved 23 August 2018.
- ^ a b c SILKE STAPEL-WEBER; JOHN VERRINDER (December 2017). "Globalisation at work in statistics — Questions arising from the 'Irish case'" (PDF). EuroStat. p. 31. Archived (PDF) from the original on 28 April 2018. Retrieved 22 August 2018.
Nevertheless the rise in [Irish] GNI* is still very substantial because the additional income flows of the companies (interest and dividends) concerned are considerably smaller than the value added of their activities
- ^ a b Brad Setser (11 May 2018). "Ireland Exports its Leprechaun". Council on Foreign Relations. Archived from the original on 14 May 2018. Retrieved 13 May 2018.
Ireland has, more or less, stopped using GDP to measure its own economy. And on current trends [because Irish GDP is distorting EU-28 aggregate data], the eurozone taken as a whole may need to consider something similar.
- ^ a b Gabriel Zucman; Thomas Tørsløv; Ludvig Wier (8 June 2018). "The Missing Profits of Nations∗" (PDF). National Bureau of Economic Research, Working Papers. p. 25. Archived (PDF) from the original on 2 August 2018. Retrieved 23 August 2018.
Profit shifting also has a significant effect on trade balances. For instance, after accounting for profit shifting, Japan, the U.K., France, and Greece turn out to have trade surpluses in 2015, in contrast to the published data that record trade deficits. According to our estimates, the true trade deficit of the United States was 2.1% of GDP in 2015, instead of 2.8% in the official statistics—that is, a quarter of the recorded trade deficit of the United States is an illusion of multinational corporate tax avoidance.
- ^ a b "Real GDP per capita". Eurostat. Archived from the original on 26 November 2018. Retrieved 26 November 2018.
- ^ Fiona Reddan (12 September 2018). "Who still owes more, Ireland or the Greeks". Irish Times. Archived from the original on 12 September 2018. Retrieved 15 September 2018.
- ^ "GDP (current US$) | Data". data.worldbank.org. Retrieved 13 May 2022.
- ^ "GNI per capita, Atlas method (current US$) | Data". data.worldbank.org. Retrieved 13 May 2022.
- ^ James R. Hines Jr.; Eric M. Rice (February 1994). "FISCAL PARADISE: FOREIGN TAX HAVENS AND AMERICAN BUSINESS" (PDF). Quarterly Journal of Economics (Harvard/MIT). 9 (1). Archived from the original (PDF) on 25 August 2017. Retrieved 22 August 2018.
We identify 41 countries and regions as tax havens for the purposes of U.S. businesses. Together the seven tax havens with populations greater than one million (Hong Kong, Ireland, Liberia, Lebanon, Panama, Singapore, and Switzerland) account for 80 percent of total tax haven population and 89 percent of tax haven GDP.
- ^ "IDEAS/RePEc Database". Federal Reserve Bank of St. Louis. Archived from the original on 4 December 2018. Retrieved 23 August 2018.
Tax Havens by Most Cited
- ^ "Irish Subsidiary Lets Microsoft Slash Taxes in U.S. and Europe". Wall Street Journal. 7 November 2005. Archived from the original on 16 June 2018. Retrieved 23 August 2018.
Round Island's legal address is in the headquarters of a Dublin law firm, Matheson Ormsby Prentice, that advertises its expertise in helping multinational companies use Ireland to shelter income from taxes.
- ^ "TAX JUSTICE NETWORK: Irish Subsidiary Lets Microsoft Slash Taxes in U.S. and Europe" (PDF). Tax Justice Network. 7 November 2005. Archived (PDF) from the original on 5 July 2016. Retrieved 23 August 2018.
- ^ "Man Making Ireland Tax Avoidance Hub Proves Local Hero". Bloomberg News. 28 October 2013. Archived from the original on 12 June 2018. Retrieved 24 August 2018.
- ^ "Controversial tax strategies brainchild of O'Rourke's son". Irish Independent. 3 November 2013. Archived from the original on 20 September 2018. Retrieved 24 August 2018.
- ^ "The real story behind US companies' offshore cash reserves". McKinsey & Company. June 2017. Archived from the original on 13 August 2018. Retrieved 23 August 2018.
- ^ a b c d e Seamus Coffey, Irish Fiscal Advisory Council (24 January 2014). "What Apple did next". Economic Incentives. Archived from the original on 30 March 2018. Retrieved 7 April 2018.
- ^ a b c d Heike Joebges (January 2017). "CRISIS RECOVERY IN A COUNTRY WITH A HIGH PRESENCE OF FOREIGN-OWNED COMPANIES: The Case of Ireland" (PDF). IMK Macroeconomic Policy Institute, Hans-Böckler-Stiftung. Archived from the original (PDF) on 12 April 2019. Retrieved 7 April 2018.
- ^ "Irish Banks continue to grow deposits as loan books shrink". Irish Examiner. December 2012. Archived from the original on 12 April 2018. Retrieved 11 April 2018.
- ^ "Ireland Financial System Stability Assessment 2016" (PDF). International Monetary Fund. July 2016. Archived (PDF) from the original on 8 May 2018. Retrieved 8 April 2018.
- ^ "Irish government debt four times pre-crisis level, NTMA says". 10 July 2017. Archived from the original on 8 April 2018. Retrieved 8 April 2018.
- ^ "42% of Europe's banking crisis paid by Ireland". 16 January 2013. Archived from the original on 8 April 2018. Retrieved 8 April 2018.
- ^ Seamus Coffey, Irish Fiscal Advisory Council (18 June 2018). "Who shifts profits to Ireland". Economic Incentives, University College Cork. Archived from the original on 20 November 2018. Retrieved 20 November 2018.
Eurostat's structural business statistics give a range of measures of the business economy broken down by the controlling country of the enterprises. Here is the Gross Operating Surplus generated in Ireland in 2015 for the countries with figures reported by Eurostat.
- ^ Daly, Frank; Arnold, Tom; Burke, Julie; Collins, Micheál; Convery, Frank J.; Donohue, Tom; Fahy, Eoin; Hunt, Colin; Leech, Sinead; Lucey, Con; McCoy, Danny; O'Rourke, Feargal; O'Sullivan, Mary; Redmond, Mark; Soffe, Willie; Walsh, Mary; Taxation, Ireland Commission on (September 2009). "Commission on Taxation report 2009". UCD Archives. Archived from the original on 13 June 2018. Retrieved 22 August 2018.
- ^ "Commission on Taxation Report Ireland 2009: Proposed property tax, a carbon tax, and domestic water charges as part of overhaul of Irish tax system". FinFacts. 7 September 2009. Archived from the original on 10 December 2017. Retrieved 22 August 2018.
- ^ a b James R. Hines Jr. (2010). "Treasure Islands". Journal of Economic Perspectives. 4 (24): 103–125.
Table 2: Largest Tax Havens
- ^ Seamus Coffey, Irish Fiscal Advisory Council (29 April 2013). "International GNI to GDP Comparisons". Economic Incentives. Archived from the original on 19 March 2018. Retrieved 7 April 2018.
- ^ "Tracking Tax Runaways". Bloomberg News. 1 March 2017. Archived from the original on 31 October 2018. Retrieved 23 August 2018.
- ^ "Effect of Redomiciled PLCs". Central Statistics Office (Ireland). July 2017. Archived from the original on 12 April 2018. Retrieved 11 April 2018.
- ^ "Pfizer pulls out of €140bn Irish Allergan merger". Irish Independent. 6 April 2016. Archived from the original on 8 July 2018. Retrieved 23 August 2018.
- ^ Rochelle Toplensky (7 March 2018). "Europe points finger at Ireland over tax avoidance". Irish Times. Archived from the original on 7 March 2018. Retrieved 7 April 2018.
Multinational companies have made such extensive use of Ireland to funnel royalties — a common way to shift profits and avoid tax — that these payments averaged 23 per cent of the country's annual gross domestic product between 2010 and 2015, according to a European Commission report seen by the Financial Times. The scale of the net royalty payments channelled through Ireland contrasts sharply with the average in the EU as a whole, where such payments are a fraction of one per cent of the bloc's annual GDP.
- ^ "Who owes more money - the Irish or the Greeks?". Irish Times. 4 June 2015. Archived from the original on 4 December 2018. Retrieved 8 April 2018.
- ^ "Why do the Irish still owe more than the Greeks?". Irish Times. 7 March 2017. Archived from the original on 4 October 2018. Retrieved 8 April 2018.
- ^ "Ireland's colossal level of indebtedness leaves any new government with precious little room for manoeuvre". Irish Independent. 16 April 2016. Archived from the original on 7 April 2018. Retrieved 8 April 2018.
- ^ Jesse Drucker; Simon Bowers (6 November 2017). "After a Tax Crackdown, Apple Found a New Shelter for Its Profits". New York Times. Archived from the original on 6 November 2017. Retrieved 24 August 2018.
- ^ Naomi Fowler (25 June 2018). "New Report on Apple's New Irish Tax Structure". Tax Justice Network. Archived from the original on 2 July 2018. Retrieved 24 August 2018.
- ^ Martin Brehm Christensen; Emma Clancy (21 June 2018). "Apple's Irish Tax Deals". European United Left–Nordic Green Left EU Parliament. Archived from the original on 14 July 2018. Retrieved 24 August 2018.
- ^ a b Brad Setser; Cole Frank (25 April 2018). "Tax Avoidance and the Irish Balance of Payments". Council on Foreign Relations. Archived from the original on 28 April 2018. Retrieved 28 April 2018.
- ^ "National Income and Expenditure Annual Results 2015". Central Statistics. 12 July 2016. Archived from the original on 22 November 2017. Retrieved 19 January 2018.
- ^ "'Leprechaun economics' - Ireland's 26pc growth spurt laughed off as 'farcical'". Irish Independent. 13 July 2016. Archived from the original on 14 June 2018. Retrieved 7 April 2018.
- ^ "Concern as Irish growth rate dubbed 'leprechaun economics'". Irish Times. 13 July 2016. Archived from the original on 19 March 2018. Retrieved 7 April 2018.
- ^ "Blog: The real story behind Ireland's 'Leprechaun' economics fiasco". RTE News. 25 July 2017. Archived from the original on 20 March 2018. Retrieved 7 April 2018.
- ^ "Irish tell a tale of 26.3% growth spurt". Financial Times. 12 July 2016. Archived from the original on 19 March 2018. Retrieved 7 April 2018.
- ^ ""Leprechaun economics" - experts aren't impressed with Ireland's GDP figures". thejournal.ie. 13 July 2016. Archived from the original on 13 April 2018. Retrieved 7 April 2018.
- ^ "'Leprechaun economics' leaves Irish growth story in limbo". Reuters News. 13 July 2016. Archived from the original on 30 March 2018. Retrieved 7 April 2018.
- ^ "'Leprechaun Economics' Earn Ireland Ridicule, $443 Million Bill". Bloomberg News. 13 July 2016. Archived from the original on 13 June 2018. Retrieved 7 April 2018.
- ^ "Leprechaun Economics". Paul Krugman (Twitter). 12 July 2016. Archived from the original on 16 June 2018. Retrieved 7 April 2018.
- ^ "CSO Press Release" (PDF). Central Statistics Office (Ireland). 12 July 2016. Archived (PDF) from the original on 22 November 2017. Retrieved 28 April 2018.
- ^ "'Leprechaun Economics' not all down to Apple move, insists CSO". Irish Independent. 9 September 2016. Archived from the original on 19 March 2018. Retrieved 7 April 2018.
- ^ "Meaningless economic statistics will cause problems for stewardship of country". RTE News. 13 July 2016. Archived from the original on 4 April 2018. Retrieved 7 April 2018.
- ^ a b Daniel Tierney (2017). "Finding "Gold" in Leprechaun Economics". MIT Sloan School of Management. p. 5,28,30.
- ^ "REPORT OF THE ECONOMIC STATISTICS REVIEW GROUP" (PDF). Central Statistics Office (Ireland). December 2016. Archived (PDF) from the original on 5 December 2017. Retrieved 7 April 2018.
- ^ "ESRG Presentation and CSO Response" (PDF). Central Statistics Office (Ireland). 4 February 2017. Archived (PDF) from the original on 5 December 2017. Retrieved 7 April 2018.
- ^ "Leprechaun-proofing economic data". RTE News. 4 February 2017. Archived from the original on 12 June 2018. Retrieved 7 April 2018.
- ^ "CSO Data Editor's Note". Central Statistics Office (Ireland). 14 July 2017. Archived from the original on 8 April 2018. Retrieved 7 April 2018.
- ^ "Central Statistics Office (CSO) Response to the Main Recommendations of the Economic Statistics Review Group (ESRG)" (PDF). Central Statistics Office (Ireland). 3 February 2017. Archived (PDF) from the original on 5 February 2018. Retrieved 11 April 2018.
- ^ "CSO paints a very different picture of Irish economy with new measure". Irish Times. 15 July 2017. Archived from the original on 29 March 2018. Retrieved 7 April 2018.
- ^ "New economic Leprechaun on loose as rate of growth plunges". Irish Independent. 15 July 2017. Archived from the original on 29 March 2018. Retrieved 7 April 2018.
- ^ a b "Ireland's economic figures still not adding up". Irish Times. January 2017. Archived from the original on 5 April 2018. Retrieved 7 April 2018.
- ^ Michael Hennigan (7 February 2019). "Irish workers most productive in world or same as Italians". FinFacts. Archived from the original on 24 February 2019. Retrieved 24 February 2019.
- ^ Seamus Coffey, Irish Fiscal Advisory Council (27 March 2018). "What is going on with GNP (again)?". Economic Incentives. Archived from the original on 5 April 2018. Retrieved 7 April 2018.
- ^ "Lies, damned lies and the national accounts headline figures". The Irish Times. 16 December 2017. Archived from the original on 9 April 2018. Retrieved 9 April 2018.
- ^ "Column: The Leprechauns are at it again in the latest GDP figures for Ireland". thejournal.ie. 17 March 2017. Archived from the original on 9 April 2018. Retrieved 9 April 2018.
- ^ "Ireland's deglobalised data to calculate a smaller economy". Financial Times. 17 July 2017. Archived from the original on 30 March 2018. Retrieved 7 April 2018.
- ^ "Ireland: Technical Assistance Report-Public Investment Management Assessment". International Monetary Fund. November 2017. Archived from the original on 13 April 2018. Retrieved 12 April 2018.
Country Report No. 17/333
- ^ a b c OECD Ireland Survey 2018 (PDF). OECD. March 2018. p. 34. ISBN 978-92-64-29177-5. Archived from the original (PDF) on 4 April 2018. Retrieved 7 April 2018.
- ^ Gabriel Zucman; Thomas Tørsløv; Ludvig Wier (8 June 2018). "The Missing Profits of Nations" (PDF). National Bureau of Economic Research. Archived (PDF) from the original on 2 August 2018. Retrieved 23 August 2018.
- ^ "Ireland is the world's biggest corporate 'tax haven', say academics". Irish Times. 13 June 2018. Archived from the original on 24 August 2018. Retrieved 23 August 2018.
New Gabriel Zucman study claims State shelters more multinational profits than the entire Caribbean
- ^ Max de Haldevang (11 June 2018). "How tax havens turn economic statistics into nonsense". Quartz (publication). Archived from the original on 12 June 2018. Retrieved 12 June 2018.
A recent IMF article reveals a perfect example: "A stunning $12 trillion—almost 40% of all foreign direct investment positions globally—is completely artificial," write economists Jannick Damgaard, Thomas Elkjaer, and Niels Johannesen
- ^ "ANNUAL TAXATION REPORT" (PDF). Department of Finance (Ireland). January 2018. p. 13. Archived (PDF) from the original on 9 February 2018. Retrieved 25 November 2018.
Figure A.4: public debt as a share of national income, per cent
- ^ "National debt now €44000 per head". Irish Independent. 7 July 2017. Archived from the original on 7 April 2018. Retrieved 7 April 2018.
- ^ "Debt levels remain high following the crisis June FAR Slide 7" (PDF). Irish Fiscal Advisory Council. June 2017. Archived from the original (PDF) on 14 November 2017. Retrieved 7 April 2018.
- ^ "Section 1.2.2 Recent Fiscal Context June FAR Page 14" (PDF). Irish Fiscal Advisory Council. June 2017. Archived (PDF) from the original on 14 November 2017. Retrieved 7 April 2018.
- ^ John Howlin (June 2014). "Future Implications of the Debt Rule" (PDF). Irish Fiscal Advisory Council. Archived (PDF) from the original on 14 November 2017. Retrieved 7 April 2018.
- ^ "Quarterly Statistical Release: November 2017" (PDF). Central Bank of Ireland. November 2017.
- ^ "Household debt now at its lowest level since 2005". Irish Independent. 7 November 2017. Archived from the original on 8 April 2018. Retrieved 7 April 2018.
- ^ "National Income and Expenditure 2017: Modified gross national income". Central Statistics Office (Ireland). 2018. Archived from the original on 21 August 2018. Retrieved 26 August 2018.
- ^ "National Income and Expenditure 2017 Frequently Asked Questions: Question 4, What is GNI*?". Central Statistics Office (Ireland). November 2017. Archived from the original on 26 August 2018. Retrieved 26 August 2018.
- ^ "National Income and Expenditure, Quarterly National Accounts and International Accounts (2018)". Central Statistics Office (Ireland). July 2019. Retrieved 11 July 2019.
External links edit
- Central Bank of Ireland ESRG Portal on Modified GNI (or GNI*)