
KNOWPIA
WELCOME TO KNOWPIA

Mourens 
Summary
Mourens is a commune in the Gironde department in Nouvelle-Aquitaine in southwestern France.
Mourens | |
|---|---|
 Town hall | |
Location of Mourens .mw-parser-output .locmap .od{position:absolute}.mw-parser-output .locmap .id{position:absolute;line-height:0}.mw-parser-output .locmap .l0{font-size:0;position:absolute}.mw-parser-output .locmap .pv{line-height:110%;position:absolute;text-align:center}.mw-parser-output .locmap .pl{line-height:110%;position:absolute;top:-0.75em;text-align:right}.mw-parser-output .locmap .pr{line-height:110%;position:absolute;top:-0.75em;text-align:left}.mw-parser-output .locmap .pv>div{display:inline;padding:1px}.mw-parser-output .locmap .pl>div{display:inline;padding:1px;float:right}.mw-parser-output .locmap .pr>div{display:inline;padding:1px;float:left}html.skin-theme-clientpref-night .mw-parser-output .od,html.skin-theme-clientpref-night .mw-parser-output .od .pv>div,html.skin-theme-clientpref-night .mw-parser-output .od .pl>div,html.skin-theme-clientpref-night .mw-parser-output .od .pr>div{background:#000;color:#fff}html.skin-theme-clientpref-night .mw-parser-output .locmap{filter:grayscale(0.6)}@media(prefers-color-scheme:dark){html.skin-theme-clientpref-os .mw-parser-output .locmap{filter:grayscale(0.6)}html.skin-theme-clientpref-os .mw-parser-output .od,html.skin-theme-clientpref-os .mw-parser-output .od .pv>div,html.skin-theme-clientpref-os .mw-parser-output .od .pl>div,html.skin-theme-clientpref-os .mw-parser-output .od .pr>div{background:#000;color:#fff}}  Mourens 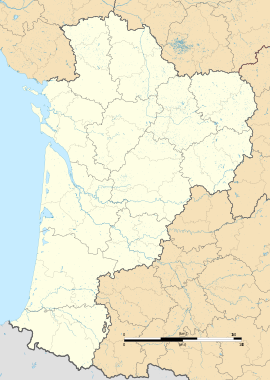 Mourens | |
| Coordinates: 44°39′00″N 0°12′31″W / 44.65°N 0.2086°W | |
| Country | France |
| Region | Nouvelle-Aquitaine |
| Department | Gironde |
| Arrondissement | Langon |
| Canton | L'Entre-Deux-Mers |
| Government | |
| • Mayor (2020–2026) | Philippe Jean Portejoie[1] |
| Area 1 | 10.63 km2 (4.10 sq mi) |
| Population (2021)[2] | 386 |
| • Density | 36/km2 (94/sq mi) |
| Time zone | UTC+01:00 (CET) |
| • Summer (DST) | UTC+02:00 (CEST) |
| INSEE/Postal code | 33299 /33410 |
| Elevation | 47–116 m (154–381 ft) (avg. 115 m or 377 ft) |
| 1 French Land Register data, which excludes lakes, ponds, glaciers > 1 km2 (0.386 sq mi or 247 acres) and river estuaries. | |
Population edit
| Year | Pop. | ±% |
|---|---|---|
| 1962 | 416 | — |
| 1968 | 434 | +4.3% |
| 1975 | 385 | −11.3% |
| 1982 | 382 | −0.8% |
| 1990 | 341 | −10.7% |
| 1999 | 358 | +5.0% |
| 2008 | 395 | +10.3% |
See also edit
References edit
- ^ "Répertoire national des élus: les maires". data.gouv.fr, Plateforme ouverte des données publiques françaises (in French). 9 August 2021.
- ^ "Populations légales 2021". The National Institute of Statistics and Economic Studies. 28 December 2023.
Wikimedia Commons has media related to Mourens.