
KNOWPIA
WELCOME TO KNOWPIA

Murasson 
Summary
Murasson (French pronunciation: [myʁasɔ̃]) is a commune in the Aveyron department in southern France.
Murasson | |
|---|---|
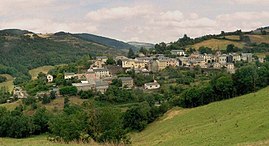 A general view of Murasson | |
Location of Murasson .mw-parser-output .locmap .od{position:absolute}.mw-parser-output .locmap .id{position:absolute;line-height:0}.mw-parser-output .locmap .l0{font-size:0;position:absolute}.mw-parser-output .locmap .pv{line-height:110%;position:absolute;text-align:center}.mw-parser-output .locmap .pl{line-height:110%;position:absolute;top:-0.75em;text-align:right}.mw-parser-output .locmap .pr{line-height:110%;position:absolute;top:-0.75em;text-align:left}.mw-parser-output .locmap .pv>div{display:inline;padding:1px}.mw-parser-output .locmap .pl>div{display:inline;padding:1px;float:right}.mw-parser-output .locmap .pr>div{display:inline;padding:1px;float:left}html.skin-theme-clientpref-night .mw-parser-output .od,html.skin-theme-clientpref-night .mw-parser-output .od .pv>div,html.skin-theme-clientpref-night .mw-parser-output .od .pl>div,html.skin-theme-clientpref-night .mw-parser-output .od .pr>div{background:#000;color:#fff}html.skin-theme-clientpref-night .mw-parser-output .locmap{filter:grayscale(0.6)}@media(prefers-color-scheme:dark){html.skin-theme-clientpref-os .mw-parser-output .locmap{filter:grayscale(0.6)}html.skin-theme-clientpref-os .mw-parser-output .od,html.skin-theme-clientpref-os .mw-parser-output .od .pv>div,html.skin-theme-clientpref-os .mw-parser-output .od .pl>div,html.skin-theme-clientpref-os .mw-parser-output .od .pr>div{background:#000;color:#fff}}  Murasson  Murasson | |
| Coordinates: 43°45′40″N 2°45′54″E / 43.7611°N 2.765°E | |
| Country | France |
| Region | Occitania |
| Department | Aveyron |
| Arrondissement | Millau |
| Canton | Causses-Rougiers |
| Government | |
| • Mayor (2023–2026) | Céline Ginieis[1] |
| Area 1 | 40.25 km2 (15.54 sq mi) |
| Population (2021)[2] | 213 |
| • Density | 5.3/km2 (14/sq mi) |
| Time zone | UTC+01:00 (CET) |
| • Summer (DST) | UTC+02:00 (CEST) |
| INSEE/Postal code | 12163 /12370 |
| Elevation | 473–1,013 m (1,552–3,323 ft) (avg. 600 m or 2,000 ft) |
| 1 French Land Register data, which excludes lakes, ponds, glaciers > 1 km2 (0.386 sq mi or 247 acres) and river estuaries. | |
Population edit
| Year | Pop. | ±% p.a. |
|---|---|---|
| 1968 | 362 | — |
| 1975 | 299 | −2.69% |
| 1982 | 266 | −1.66% |
| 1990 | 235 | −1.54% |
| 1999 | 212 | −1.14% |
| 2009 | 199 | −0.63% |
| 2014 | 184 | −1.56% |
| 2020 | 211 | +2.31% |
| Source: INSEE[3] | ||
See also edit
References edit
- ^ "Répertoire national des élus: les maires" (in French). data.gouv.fr, Plateforme ouverte des données publiques françaises. 30 November 2023.
- ^ "Populations légales 2021". The National Institute of Statistics and Economic Studies. 28 December 2023.
- ^ Population en historique depuis 1968, INSEE
Wikimedia Commons has media related to Murasson.